
|
|||||
|
 | |
| |
| |
| |
| |
| |
|
Gene: ARMH3 |
Gene summary for ARMH3 |
| Gene information | Species | Human | Gene symbol | ARMH3 | Gene ID | 79591 |
| Gene name | armadillo like helical domain containing 3 | |
| Gene Alias | C10orf76 | |
| Cytomap | 10q24.32 | |
| Gene Type | protein-coding | GO ID | GO:0006996 | UniProtAcc | B3KUU6 |
Top |
Malignant transformation analysis |
| Identification of the aberrant gene expression in precancerous and cancerous lesions by comparing the gene expression of stem-like cells in diseased tissues with normal stem cells |
| Entrez ID | Symbol | Replicates | Species | Organ | Tissue | Adj P-value | Log2FC | Malignancy |
| 79591 | ARMH3 | RNA-P25T1-P25T1-2 | Human | Lung | AIS | 1.36e-03 | 4.81e-01 | -0.1941 |
| 79591 | ARMH3 | RNA-P25T1-P25T1-3 | Human | Lung | AIS | 3.06e-07 | 5.44e-01 | -0.2107 |
| 79591 | ARMH3 | RNA-P25T1-P25T1-4 | Human | Lung | AIS | 1.70e-10 | 5.41e-01 | -0.2119 |
| 79591 | ARMH3 | RNA-P3T-P3T-4 | Human | Lung | IAC | 1.67e-02 | 3.50e-01 | 0.1859 |
| 79591 | ARMH3 | RNA-P6T1-P6T1-3 | Human | Lung | MIAC | 2.58e-05 | 6.84e-01 | -0.0296 |
| 79591 | ARMH3 | RNA-P6T1-P6T1-4 | Human | Lung | MIAC | 8.52e-06 | 6.90e-01 | -0.0263 |
| 79591 | ARMH3 | RNA-P6T2-P6T2-1 | Human | Lung | IAC | 1.24e-16 | 5.58e-01 | -0.0166 |
| 79591 | ARMH3 | RNA-P6T2-P6T2-2 | Human | Lung | IAC | 5.22e-22 | 6.46e-01 | -0.0132 |
| 79591 | ARMH3 | RNA-P6T2-P6T2-3 | Human | Lung | IAC | 1.84e-18 | 5.32e-01 | -0.013 |
| 79591 | ARMH3 | RNA-P6T2-P6T2-4 | Human | Lung | IAC | 2.90e-11 | 4.20e-01 | -0.0121 |
| 79591 | ARMH3 | RNA-P7T1-P7T1-1 | Human | Lung | AIS | 9.39e-09 | 6.98e-01 | -0.0961 |
| 79591 | ARMH3 | RNA-P7T1-P7T1-2 | Human | Lung | AIS | 8.94e-07 | 5.27e-01 | -0.0876 |
| 79591 | ARMH3 | RNA-P7T1-P7T1-3 | Human | Lung | AIS | 1.01e-04 | 5.20e-01 | -0.0822 |
| 79591 | ARMH3 | RNA-P7T1-P7T1-4 | Human | Lung | AIS | 3.37e-05 | 4.69e-01 | -0.0809 |
| Page: 1 2 3 |
| Tissue | Expression Dynamics | Abbreviation |
| Cervix | 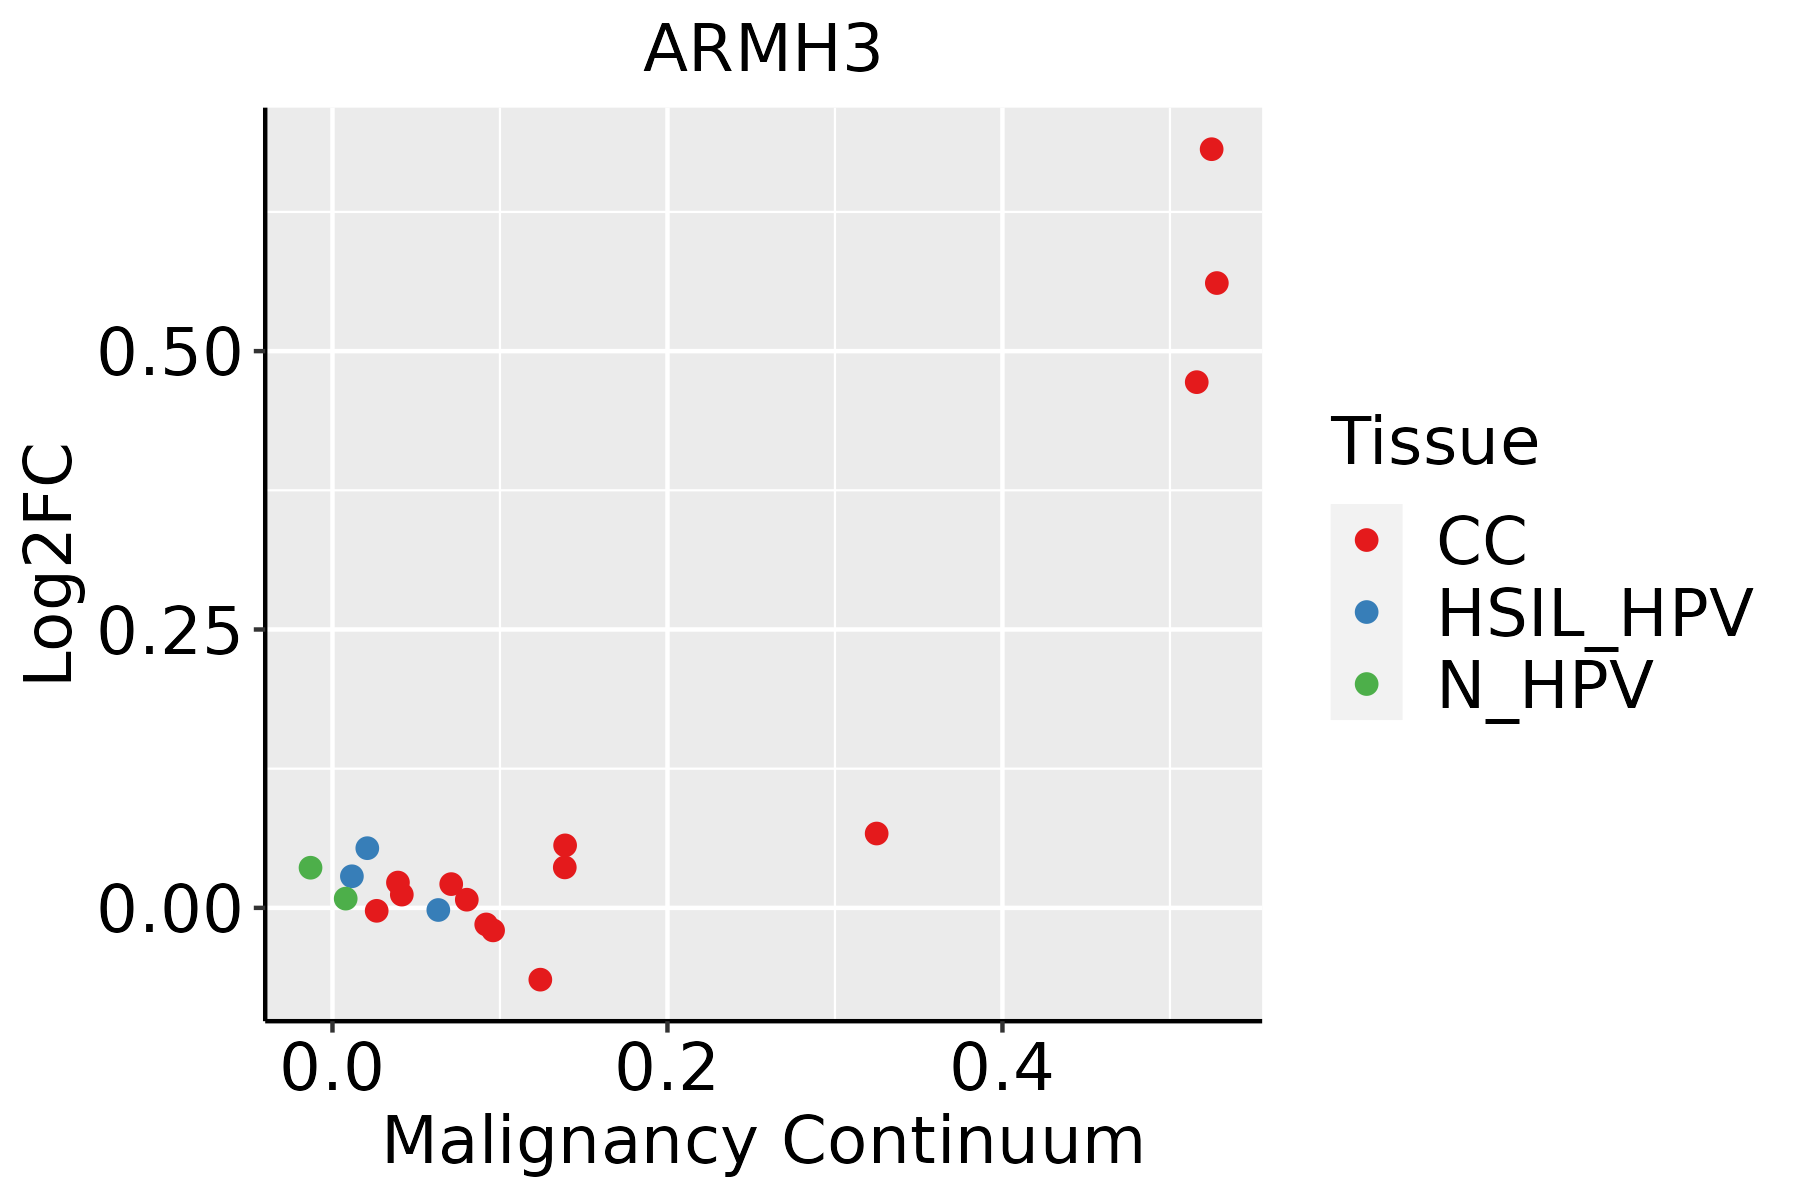 | CC: Cervix cancer |
| HSIL_HPV: HPV-infected high-grade squamous intraepithelial lesions | ||
| N_HPV: HPV-infected normal cervix | ||
| Colorectum (GSE201348) |  | FAP: Familial adenomatous polyposis |
| CRC: Colorectal cancer | ||
| Colorectum (HTA11) |  | AD: Adenomas |
| SER: Sessile serrated lesions | ||
| MSI-H: Microsatellite-high colorectal cancer | ||
| MSS: Microsatellite stable colorectal cancer | ||
| Lung | 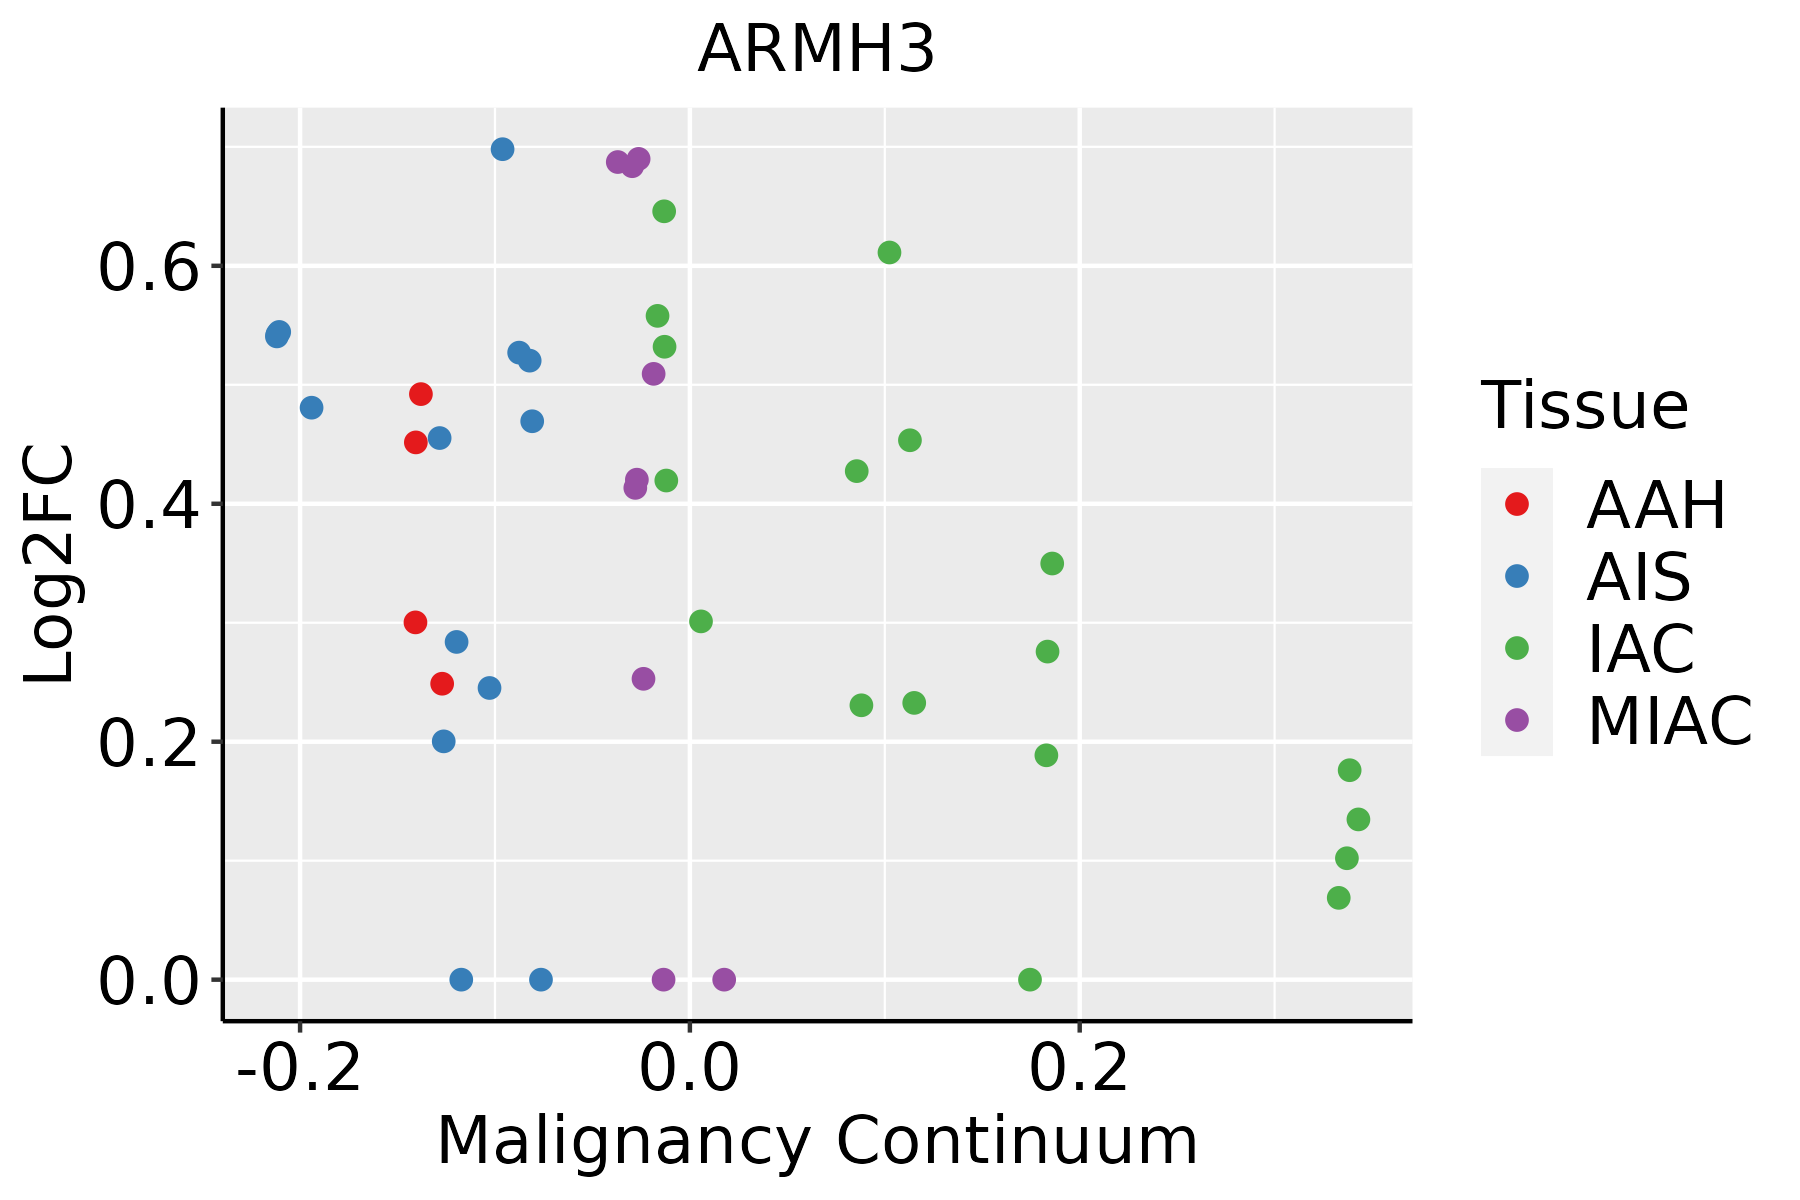 | AAH: Atypical adenomatous hyperplasia |
| AIS: Adenocarcinoma in situ | ||
| IAC: Invasive lung adenocarcinoma | ||
| MIA: Minimally invasive adenocarcinoma |
| ∗log2FC in expression of this searched gene in stem-like cells from each diseased tissue sample relative to stem-like cells in normal samples in each tissue plotted against the malignancy continuum. Samples are colored based on if they are from different disease stage. |
Top |
Malignant transformation related pathway analysis |
| Find out the enriched GO biological processes and KEGG pathways involved in transition from healthy to precancer to cancer |
| Tissue | Disease Stage | Enriched GO biological Processes |
| Colorectum | AD |  |
| Colorectum | SER |  |
| Colorectum | MSS |  |
| Colorectum | MSI-H |  |
| Colorectum | FAP |  |
| ∗Top 15 enriched GO BP terms are showed in the bar plot of each disease state in each tissue. Each row represents a significant GO biological process which is colored according to the -log10(p.adjust). |
| Page: 1 2 3 4 5 6 7 8 9 |
| GO ID | Tissue | Disease Stage | Description | Gene Ratio | Bg Ratio | pvalue | p.adjust | Count |
| GO:19033583 | Cervix | CC | regulation of Golgi organization | 7/2311 | 17/18723 | 2.72e-03 | 1.85e-02 | 7 |
| GO:00070304 | Cervix | CC | Golgi organization | 32/2311 | 157/18723 | 2.78e-03 | 1.87e-02 | 32 |
| GO:00070303 | Lung | IAC | Golgi organization | 32/2061 | 157/18723 | 4.13e-04 | 6.22e-03 | 32 |
| GO:000703011 | Lung | AIS | Golgi organization | 30/1849 | 157/18723 | 3.09e-04 | 5.63e-03 | 30 |
| GO:000703021 | Lung | MIAC | Golgi organization | 18/967 | 157/18723 | 1.27e-03 | 2.37e-02 | 18 |
| Page: 1 |
| Pathway ID | Tissue | Disease Stage | Description | Gene Ratio | Bg Ratio | pvalue | p.adjust | qvalue | Count |
| Page: 1 |
Top |
Cell-cell communication analysis |
| Identification of potential cell-cell interactions between two cell types and their ligand-receptor pairs for different disease states |
| Ligand | Receptor | LRpair | Pathway | Tissue | Disease Stage |
| Page: 1 |
Top |
Single-cell gene regulatory network inference analysis |
| Find out the significant the regulons (TFs) and the target genes of each regulon across cell types for different disease states |
| TF | Cell Type | Tissue | Disease Stage | Target Gene | RSS | Regulon Activity |
| ∗The dot plots of a searched regulon are shown for all cell subpopulations in each disease state of each tissue based on the regulon specific score inferred using pySCENIC and by calculating the average expression. |
| Page: 1 |
Top |
Somatic mutation of malignant transformation related genes |
| Annotation of somatic variants for genes involved in malignant transformation |
| Hugo Symbol | Variant Class | Variant Classification | dbSNP RS | HGVSc | HGVSp | HGVSp Short | SWISSPROT | BIOTYPE | SIFT | PolyPhen | Tumor Sample Barcode | Tissue | Histology | Sex | Age | Stage | Therapy Types | Drugs | Outcome |
| Page: 1 |
Top |
Related drugs of malignant transformation related genes |
| Identification of chemicals and drugs interact with genes involved in malignant transfromation |
| (DGIdb 4.0) |
| Entrez ID | Symbol | Category | Interaction Types | Drug Claim Name | Drug Name | PMIDs |
| Page: 1 |

Copyright 2023-Present -The University of Texas Health Science Center at Houston |