
|
|||||
|
 | |
| |
| |
| |
| |
| |
|
Gene: ARL2 |
Gene summary for ARL2 |
| Gene information | Species | Human | Gene symbol | ARL2 | Gene ID | 402 |
| Gene name | ADP ribosylation factor like GTPase 2 | |
| Gene Alias | ARFL2 | |
| Cytomap | 11q13.1 | |
| Gene Type | protein-coding | GO ID | GO:0000226 | UniProtAcc | P36404 |
Top |
Malignant transformation analysis |
| Identification of the aberrant gene expression in precancerous and cancerous lesions by comparing the gene expression of stem-like cells in diseased tissues with normal stem cells |
| Entrez ID | Symbol | Replicates | Species | Organ | Tissue | Adj P-value | Log2FC | Malignancy |
| 402 | ARL2 | GSM5276935 | Human | Endometrium | EEC | 9.72e-04 | -3.25e-01 | -0.123 |
| 402 | ARL2 | GSM5276937 | Human | Endometrium | EEC | 1.36e-06 | -3.97e-01 | -0.0897 |
| 402 | ARL2 | GSM6177620_NYU_UCEC1_lib1_lib1 | Human | Endometrium | EEC | 1.99e-20 | -4.49e-01 | -0.1869 |
| 402 | ARL2 | GSM6177620_NYU_UCEC1_lib2_lib2 | Human | Endometrium | EEC | 1.56e-18 | -4.66e-01 | -0.1875 |
| 402 | ARL2 | GSM6177620_NYU_UCEC1_lib3_lib3 | Human | Endometrium | EEC | 1.22e-22 | -3.76e-01 | -0.1883 |
| 402 | ARL2 | GSM6177621_NYU_UCEC2_lib1_lib1 | Human | Endometrium | EEC | 6.02e-29 | -4.92e-01 | -0.1934 |
| 402 | ARL2 | GSM6177622_NYU_UCEC3_lib1_lib1 | Human | Endometrium | EEC | 1.35e-33 | -3.94e-01 | -0.1917 |
| 402 | ARL2 | GSM6177622_NYU_UCEC3_lib2_lib2 | Human | Endometrium | EEC | 3.39e-31 | -4.28e-01 | -0.1916 |
| 402 | ARL2 | GSM6177623_NYU_UCEC3_Vis | Human | Endometrium | EEC | 1.30e-02 | -2.17e-01 | -0.1269 |
| 402 | ARL2 | LZE4T | Human | Esophagus | ESCC | 2.32e-13 | 7.47e-01 | 0.0811 |
| 402 | ARL2 | LZE7T | Human | Esophagus | ESCC | 2.10e-08 | 8.81e-01 | 0.0667 |
| 402 | ARL2 | LZE8T | Human | Esophagus | ESCC | 1.26e-02 | 3.50e-01 | 0.067 |
| 402 | ARL2 | LZE24T | Human | Esophagus | ESCC | 5.13e-27 | 1.04e+00 | 0.0596 |
| 402 | ARL2 | LZE22D3 | Human | Esophagus | HGIN | 2.35e-04 | 6.93e-01 | 0.0653 |
| 402 | ARL2 | LZE6T | Human | Esophagus | ESCC | 2.49e-11 | 1.12e+00 | 0.0845 |
| 402 | ARL2 | P1T-E | Human | Esophagus | ESCC | 1.03e-10 | 1.03e+00 | 0.0875 |
| 402 | ARL2 | P2T-E | Human | Esophagus | ESCC | 4.92e-27 | 5.54e-01 | 0.1177 |
| 402 | ARL2 | P4T-E | Human | Esophagus | ESCC | 3.52e-58 | 1.75e+00 | 0.1323 |
| 402 | ARL2 | P5T-E | Human | Esophagus | ESCC | 3.55e-52 | 1.06e+00 | 0.1327 |
| 402 | ARL2 | P8T-E | Human | Esophagus | ESCC | 2.79e-44 | 9.60e-01 | 0.0889 |
| Page: 1 2 3 4 5 6 7 8 9 |
| Tissue | Expression Dynamics | Abbreviation |
| Colorectum (GSE201348) |  | FAP: Familial adenomatous polyposis |
| CRC: Colorectal cancer | ||
| Colorectum (HTA11) |  | AD: Adenomas |
| SER: Sessile serrated lesions | ||
| MSI-H: Microsatellite-high colorectal cancer | ||
| MSS: Microsatellite stable colorectal cancer | ||
| Endometrium | 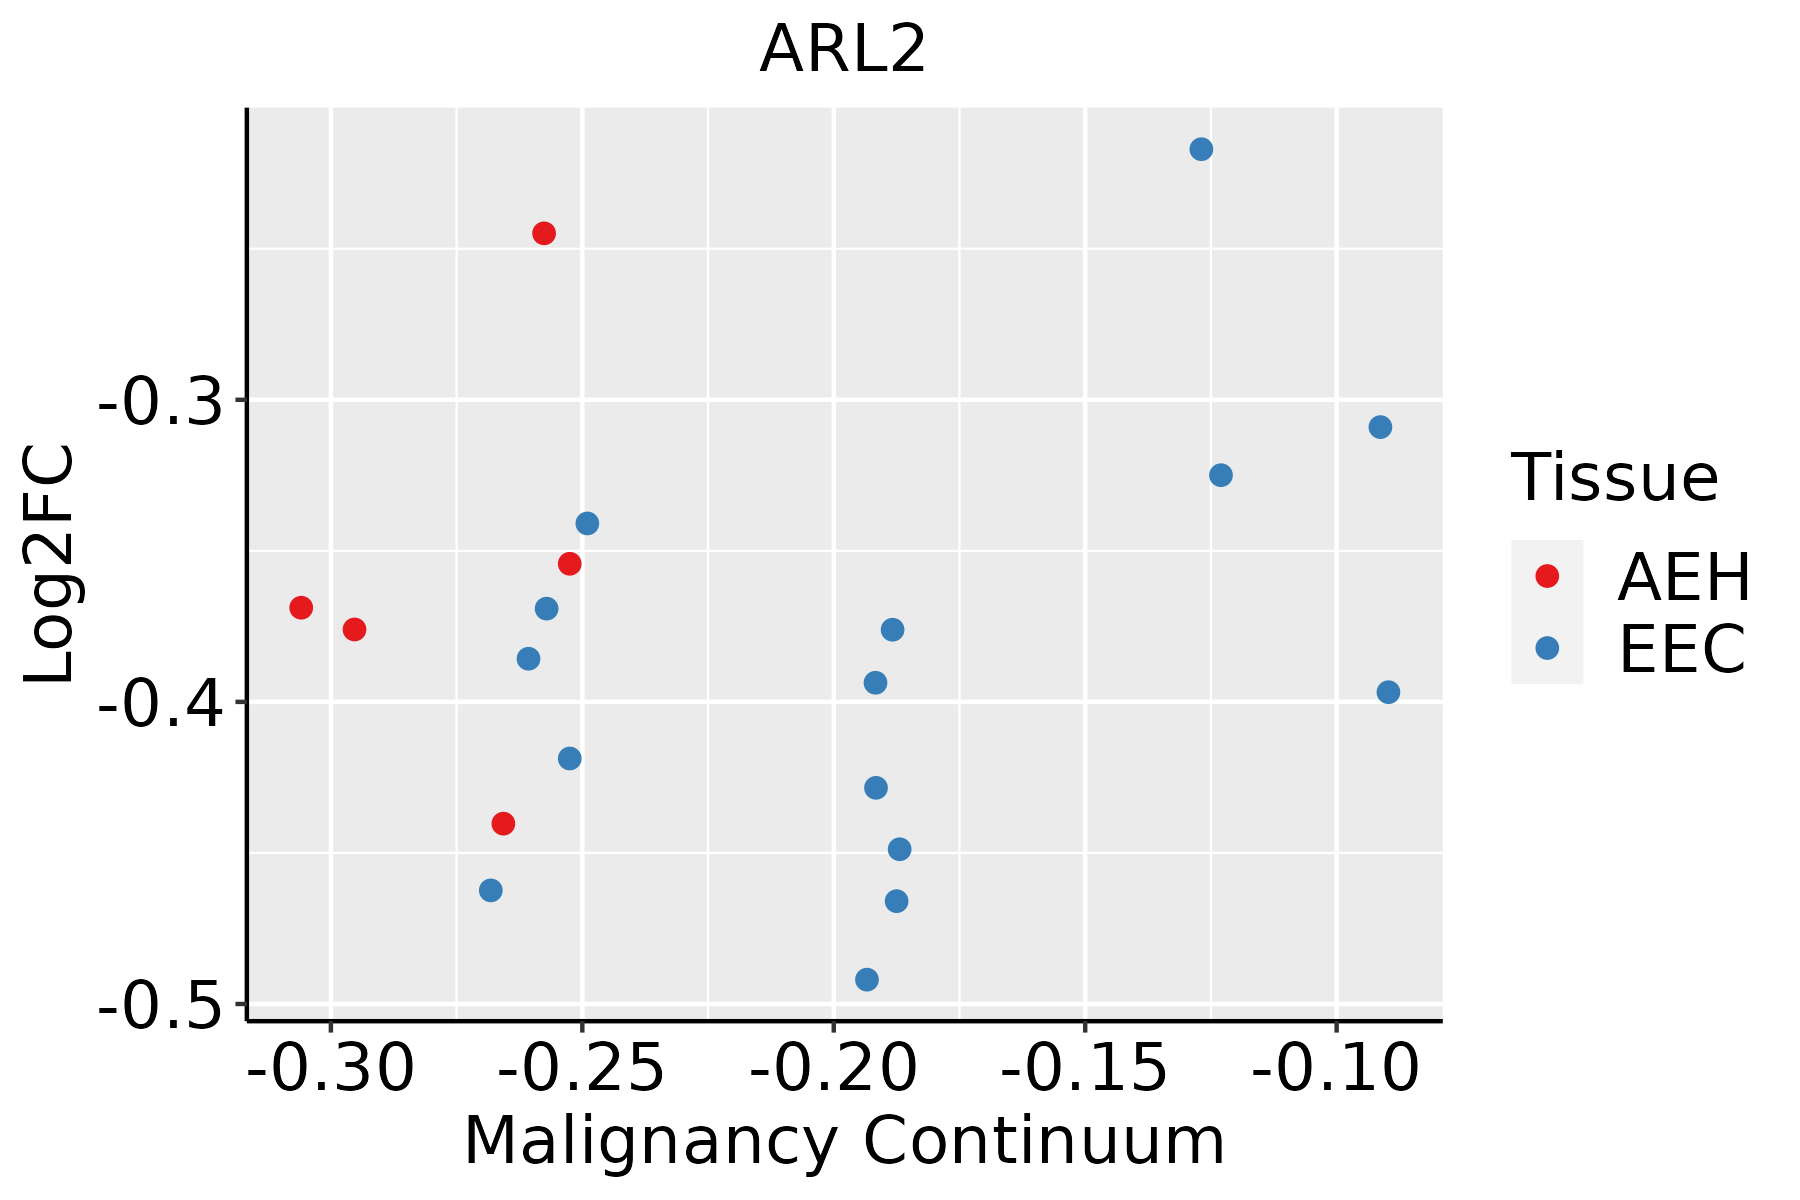 | AEH: Atypical endometrial hyperplasia |
| EEC: Endometrioid Cancer | ||
| Esophagus | 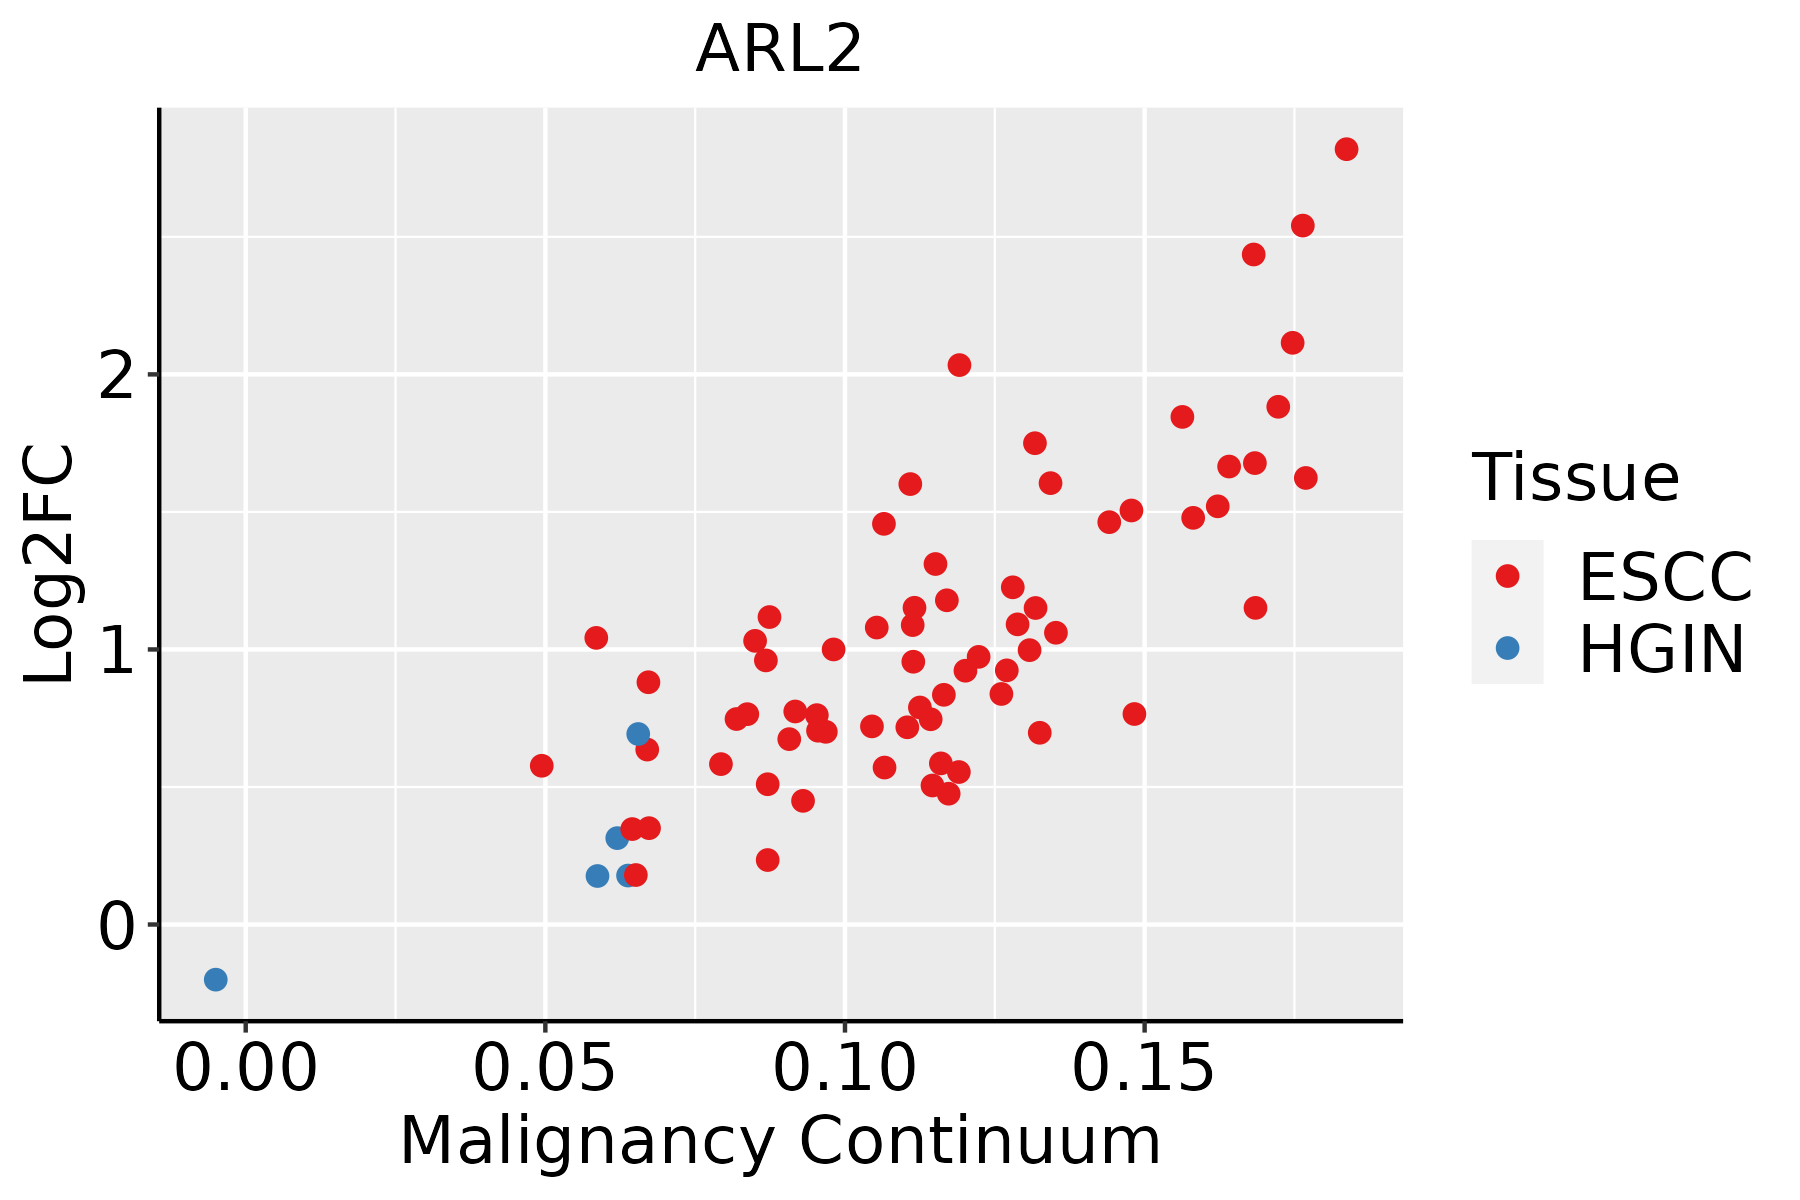 | ESCC: Esophageal squamous cell carcinoma |
| HGIN: High-grade intraepithelial neoplasias | ||
| LGIN: Low-grade intraepithelial neoplasias | ||
| Liver | 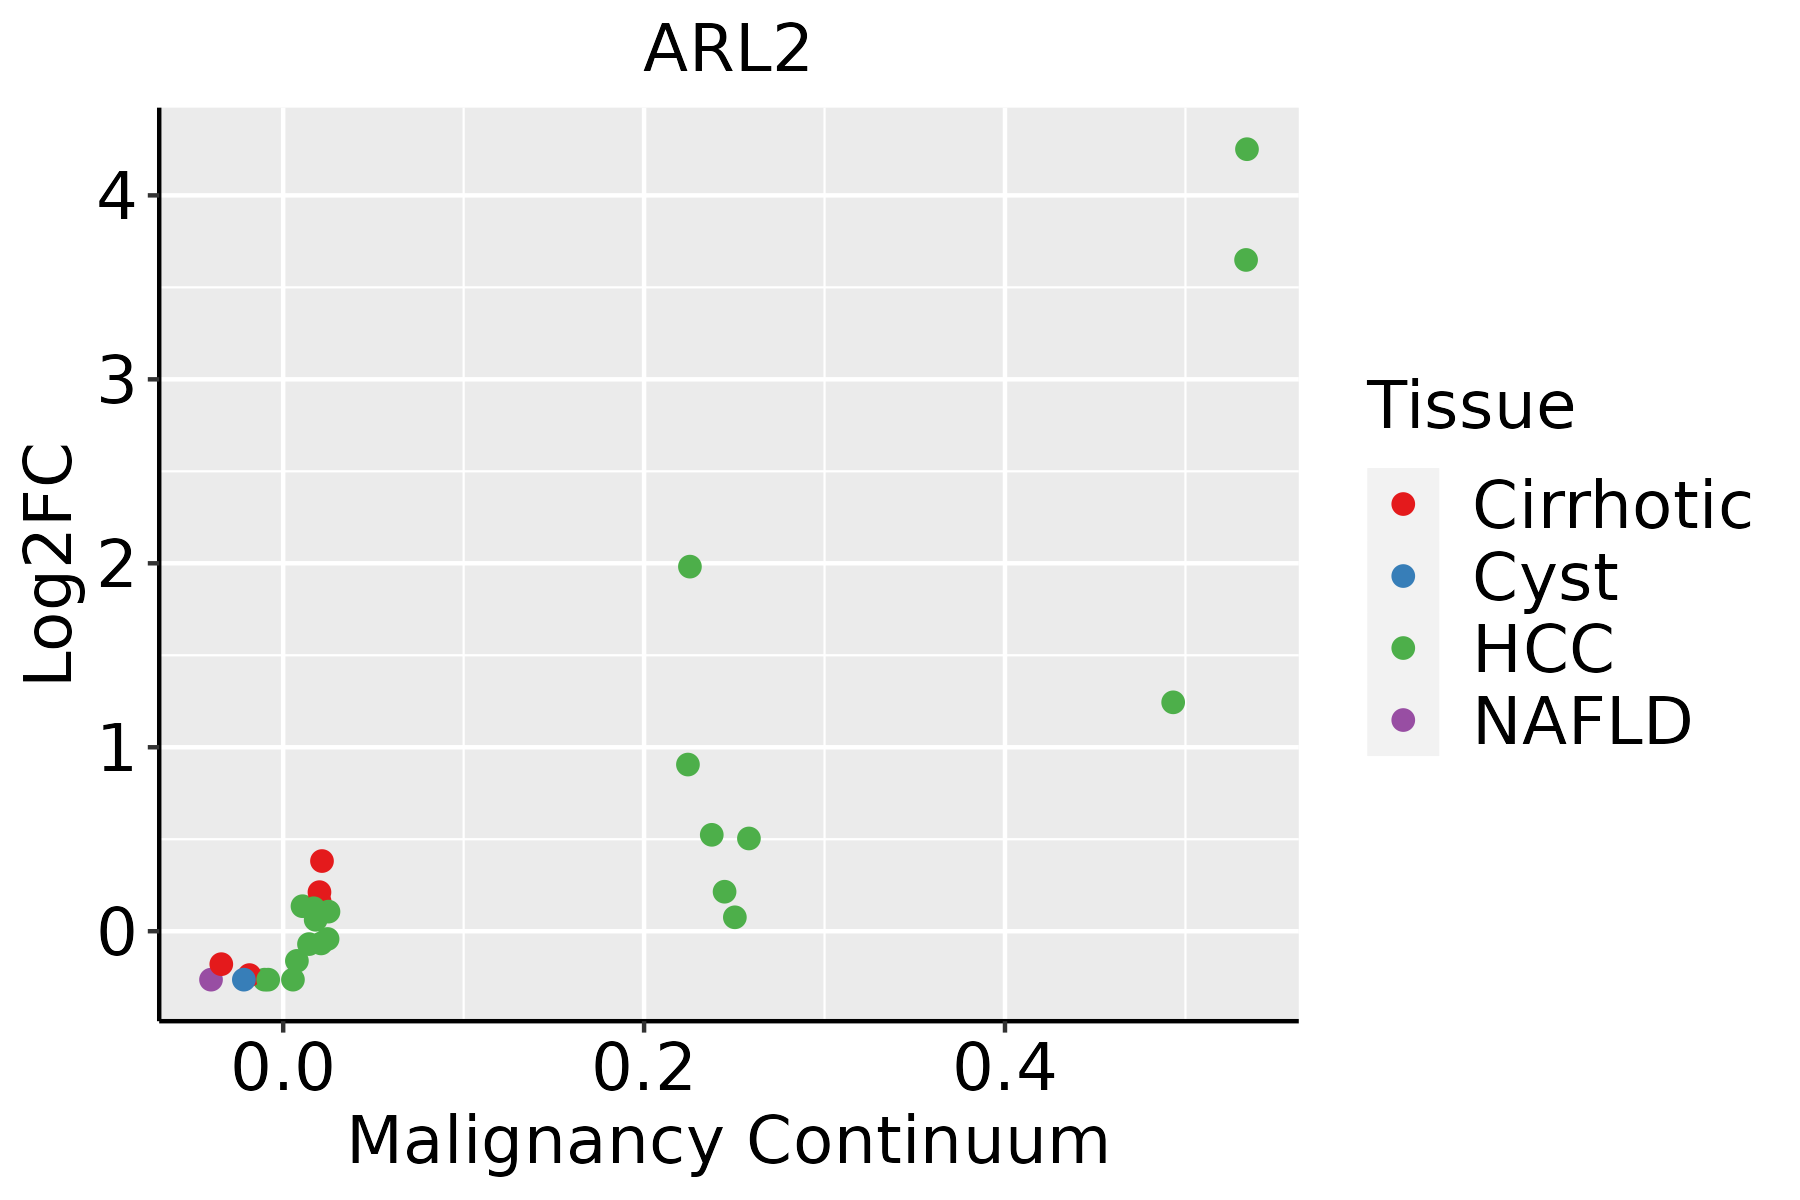 | HCC: Hepatocellular carcinoma |
| NAFLD: Non-alcoholic fatty liver disease | ||
| Oral Cavity |  | EOLP: Erosive Oral lichen planus |
| LP: leukoplakia | ||
| NEOLP: Non-erosive oral lichen planus | ||
| OSCC: Oral squamous cell carcinoma | ||
| Skin | 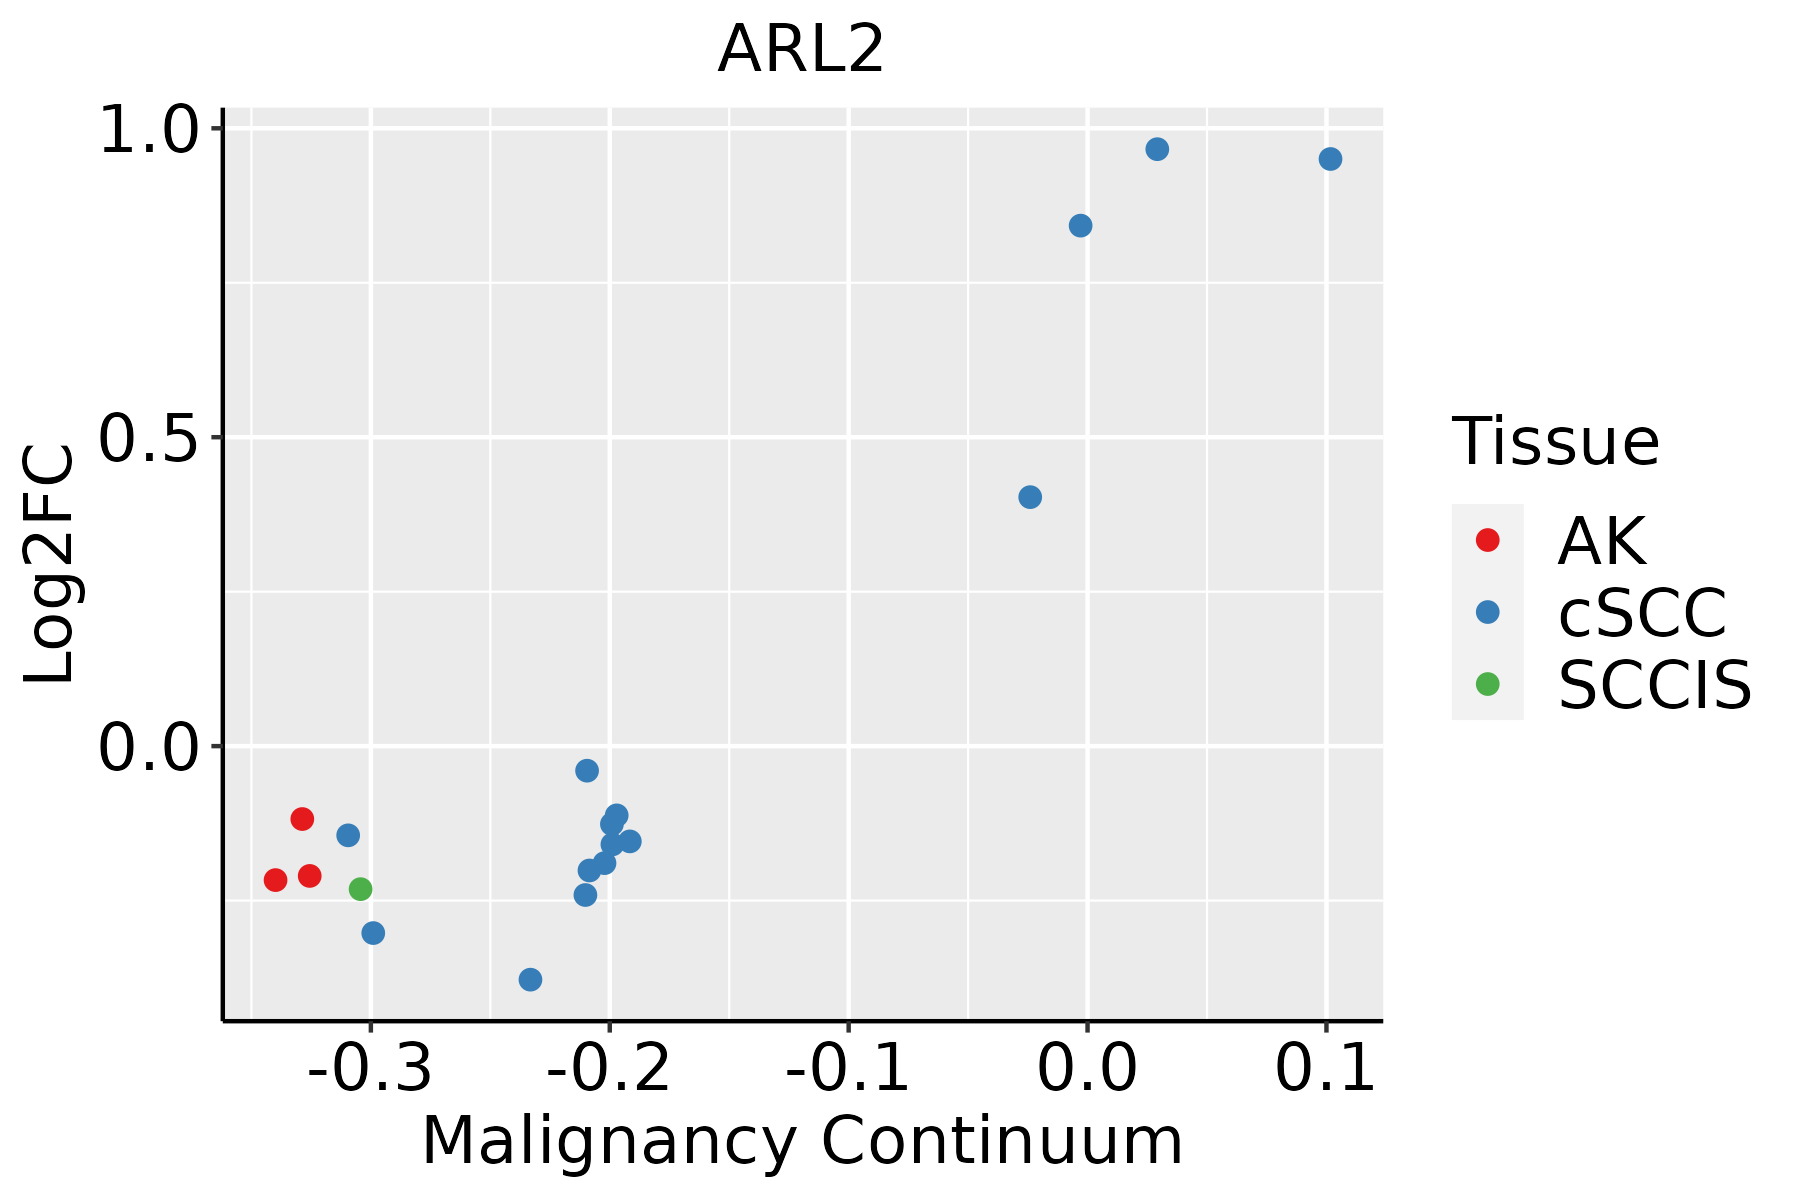 | AK: Actinic keratosis |
| cSCC: Cutaneous squamous cell carcinoma | ||
| SCCIS:squamous cell carcinoma in situ | ||
| Thyroid | 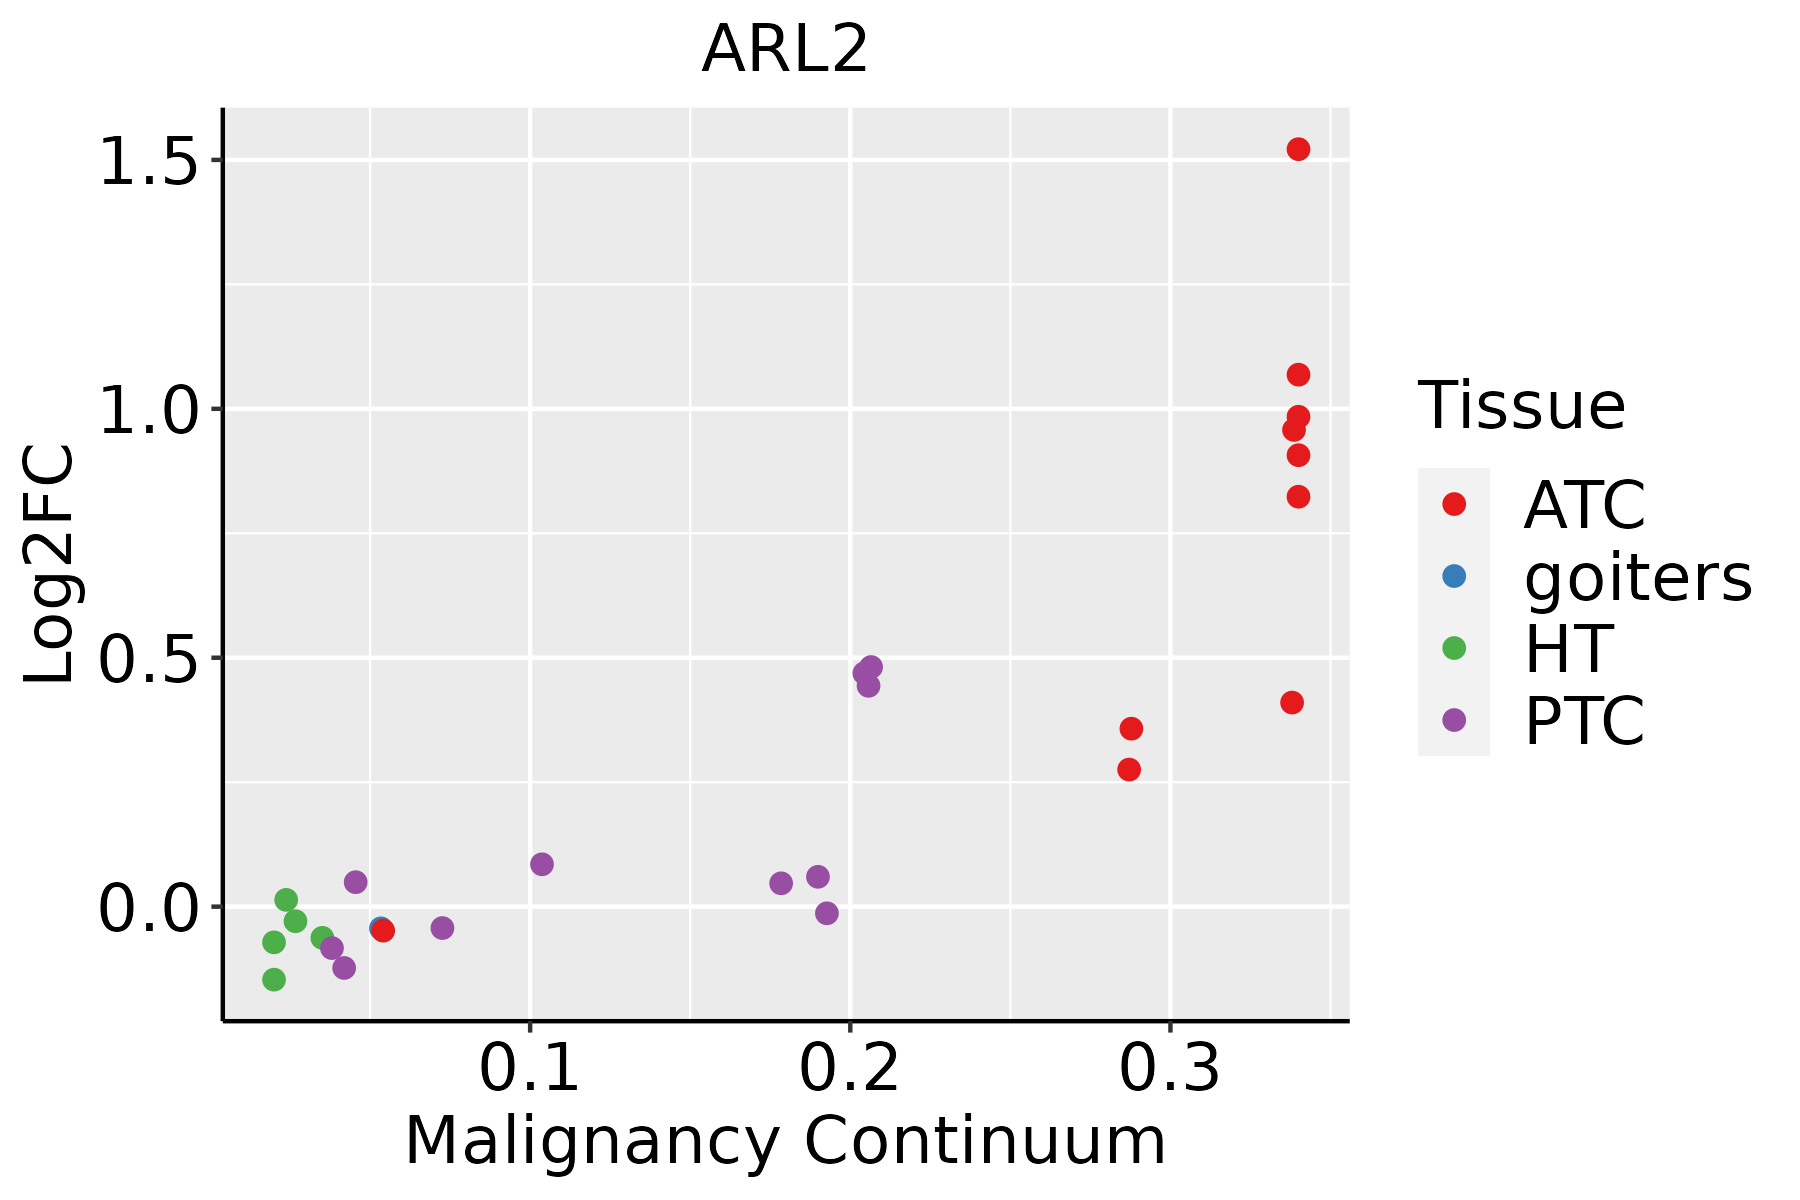 | ATC: Anaplastic thyroid cancer |
| HT: Hashimoto's thyroiditis | ||
| PTC: Papillary thyroid cancer |
| ∗log2FC in expression of this searched gene in stem-like cells from each diseased tissue sample relative to stem-like cells in normal samples in each tissue plotted against the malignancy continuum. Samples are colored based on if they are from different disease stage. |
Top |
Malignant transformation related pathway analysis |
| Find out the enriched GO biological processes and KEGG pathways involved in transition from healthy to precancer to cancer |
| Tissue | Disease Stage | Enriched GO biological Processes |
| Colorectum | AD |  |
| Colorectum | SER |  |
| Colorectum | MSS |  |
| Colorectum | MSI-H |  |
| Colorectum | FAP |  |
| ∗Top 15 enriched GO BP terms are showed in the bar plot of each disease state in each tissue. Each row represents a significant GO biological process which is colored according to the -log10(p.adjust). |
| Page: 1 2 3 4 5 6 7 8 9 |
| GO ID | Tissue | Disease Stage | Description | Gene Ratio | Bg Ratio | pvalue | p.adjust | Count |
| GO:0046034 | Colorectum | AD | ATP metabolic process | 142/3918 | 277/18723 | 2.64e-29 | 8.26e-26 | 142 |
| GO:0006091 | Colorectum | AD | generation of precursor metabolites and energy | 209/3918 | 490/18723 | 3.17e-28 | 6.61e-25 | 209 |
| GO:0009060 | Colorectum | AD | aerobic respiration | 108/3918 | 189/18723 | 9.14e-28 | 1.43e-24 | 108 |
| GO:0045333 | Colorectum | AD | cellular respiration | 119/3918 | 230/18723 | 3.21e-25 | 4.02e-22 | 119 |
| GO:0015980 | Colorectum | AD | energy derivation by oxidation of organic compounds | 143/3918 | 318/18723 | 2.78e-22 | 2.49e-19 | 143 |
| GO:0009150 | Colorectum | AD | purine ribonucleotide metabolic process | 142/3918 | 368/18723 | 4.29e-15 | 1.17e-12 | 142 |
| GO:0006163 | Colorectum | AD | purine nucleotide metabolic process | 149/3918 | 396/18723 | 1.08e-14 | 2.80e-12 | 149 |
| GO:0072521 | Colorectum | AD | purine-containing compound metabolic process | 153/3918 | 416/18723 | 4.34e-14 | 1.01e-11 | 153 |
| GO:0009259 | Colorectum | AD | ribonucleotide metabolic process | 144/3918 | 385/18723 | 5.25e-14 | 1.13e-11 | 144 |
| GO:0019693 | Colorectum | AD | ribose phosphate metabolic process | 145/3918 | 396/18723 | 3.01e-13 | 5.71e-11 | 145 |
| GO:1902903 | Colorectum | AD | regulation of supramolecular fiber organization | 139/3918 | 383/18723 | 2.01e-12 | 3.19e-10 | 139 |
| GO:0009117 | Colorectum | AD | nucleotide metabolic process | 168/3918 | 489/18723 | 2.20e-12 | 3.36e-10 | 168 |
| GO:0006753 | Colorectum | AD | nucleoside phosphate metabolic process | 169/3918 | 497/18723 | 4.99e-12 | 6.98e-10 | 169 |
| GO:0032271 | Colorectum | AD | regulation of protein polymerization | 94/3918 | 233/18723 | 1.01e-11 | 1.29e-09 | 94 |
| GO:0051258 | Colorectum | AD | protein polymerization | 112/3918 | 297/18723 | 1.85e-11 | 2.27e-09 | 112 |
| GO:0043254 | Colorectum | AD | regulation of protein-containing complex assembly | 148/3918 | 428/18723 | 2.64e-11 | 3.18e-09 | 148 |
| GO:1902905 | Colorectum | AD | positive regulation of supramolecular fiber organization | 85/3918 | 209/18723 | 5.95e-11 | 6.33e-09 | 85 |
| GO:0051495 | Colorectum | AD | positive regulation of cytoskeleton organization | 89/3918 | 226/18723 | 1.61e-10 | 1.56e-08 | 89 |
| GO:0032273 | Colorectum | AD | positive regulation of protein polymerization | 62/3918 | 138/18723 | 1.94e-10 | 1.76e-08 | 62 |
| GO:0031334 | Colorectum | AD | positive regulation of protein-containing complex assembly | 91/3918 | 237/18723 | 4.78e-10 | 3.99e-08 | 91 |
| Page: 1 2 3 4 5 6 7 8 9 10 11 12 13 14 15 16 17 18 19 20 21 22 23 24 25 26 27 28 29 30 31 32 33 34 35 36 37 38 39 40 41 42 43 44 45 46 |
| Pathway ID | Tissue | Disease Stage | Description | Gene Ratio | Bg Ratio | pvalue | p.adjust | qvalue | Count |
| Page: 1 |
Top |
Cell-cell communication analysis |
| Identification of potential cell-cell interactions between two cell types and their ligand-receptor pairs for different disease states |
| Ligand | Receptor | LRpair | Pathway | Tissue | Disease Stage |
| Page: 1 |
Top |
Single-cell gene regulatory network inference analysis |
| Find out the significant the regulons (TFs) and the target genes of each regulon across cell types for different disease states |
| TF | Cell Type | Tissue | Disease Stage | Target Gene | RSS | Regulon Activity |
| ∗The dot plots of a searched regulon are shown for all cell subpopulations in each disease state of each tissue based on the regulon specific score inferred using pySCENIC and by calculating the average expression. |
| Page: 1 |
Top |
Somatic mutation of malignant transformation related genes |
| Annotation of somatic variants for genes involved in malignant transformation |
| Hugo Symbol | Variant Class | Variant Classification | dbSNP RS | HGVSc | HGVSp | HGVSp Short | SWISSPROT | BIOTYPE | SIFT | PolyPhen | Tumor Sample Barcode | Tissue | Histology | Sex | Age | Stage | Therapy Types | Drugs | Outcome |
| ARL2 | SNV | Missense_Mutation | c.221G>T | p.Arg74Leu | p.R74L | P36404 | protein_coding | deleterious(0) | probably_damaging(1) | TCGA-A2-A0YE-01 | Breast | breast invasive carcinoma | Female | <65 | I/II | Unspecific | Taxotere | SD | |
| ARL2 | SNV | Missense_Mutation | rs766982672 | c.280G>A | p.Ala94Thr | p.A94T | P36404 | protein_coding | tolerated(0.64) | benign(0.011) | TCGA-C5-A1BF-01 | Cervix | cervical & endocervical cancer | Female | <65 | I/II | Chemotherapy | cisplatin | PD |
| ARL2 | SNV | Missense_Mutation | rs146832019 | c.443G>A | p.Arg148His | p.R148H | P36404 | protein_coding | deleterious(0.04) | benign(0.001) | TCGA-AZ-4315-01 | Colorectum | colon adenocarcinoma | Male | <65 | I/II | Unknown | Unknown | SD |
| ARL2 | SNV | Missense_Mutation | c.409N>A | p.Ala137Thr | p.A137T | P36404 | protein_coding | deleterious(0.04) | benign(0.003) | TCGA-AZ-6598-01 | Colorectum | colon adenocarcinoma | Female | >=65 | I/II | Unknown | Unknown | SD | |
| ARL2 | SNV | Missense_Mutation | rs746518542 | c.124G>A | p.Asp42Asn | p.D42N | P36404 | protein_coding | tolerated(0.47) | benign(0.007) | TCGA-EI-6917-01 | Colorectum | rectum adenocarcinoma | Male | <65 | III/IV | Chemotherapy | 5fluorouracil+oxaciplatina+l-folinian | SD |
| ARL2 | SNV | Missense_Mutation | novel | c.140C>T | p.Thr47Met | p.T47M | P36404 | protein_coding | deleterious(0.02) | probably_damaging(0.941) | TCGA-AJ-A3BH-01 | Endometrium | uterine corpus endometrioid carcinoma | Female | Unknown | I/II | Unknown | Unknown | SD |
| ARL2 | SNV | Missense_Mutation | rs748651201 | c.221N>A | p.Arg74Gln | p.R74Q | P36404 | protein_coding | deleterious(0) | probably_damaging(1) | TCGA-AJ-A8CV-01 | Endometrium | uterine corpus endometrioid carcinoma | Female | <65 | I/II | Unknown | Unknown | SD |
| ARL2 | SNV | Missense_Mutation | rs778402408 | c.310N>T | p.Arg104Trp | p.R104W | P36404 | protein_coding | deleterious(0.02) | benign(0.022) | TCGA-AP-A1DV-01 | Endometrium | uterine corpus endometrioid carcinoma | Female | <65 | I/II | Unknown | Unknown | SD |
| ARL2 | SNV | Missense_Mutation | rs758628032 | c.475G>A | p.Ala159Thr | p.A159T | P36404 | protein_coding | deleterious(0.02) | probably_damaging(0.963) | TCGA-AX-A06F-01 | Endometrium | uterine corpus endometrioid carcinoma | Female | <65 | III/IV | Chemotherapy | carboplatin | SD |
| ARL2 | SNV | Missense_Mutation | rs779164260 | c.394G>A | p.Ala132Thr | p.A132T | P36404 | protein_coding | deleterious(0) | possibly_damaging(0.903) | TCGA-AX-A0IZ-01 | Endometrium | uterine corpus endometrioid carcinoma | Female | <65 | I/II | Unknown | Unknown | SD |
| Page: 1 2 |
Top |
Related drugs of malignant transformation related genes |
| Identification of chemicals and drugs interact with genes involved in malignant transfromation |
| (DGIdb 4.0) |
| Entrez ID | Symbol | Category | Interaction Types | Drug Claim Name | Drug Name | PMIDs |
| Page: 1 |

Copyright 2023-Present -The University of Texas Health Science Center at Houston |