
|
|||||
|
 | |
| |
| |
| |
| |
| |
|
Gene: ARID2 |
Gene summary for ARID2 |
| Gene information | Species | Human | Gene symbol | ARID2 | Gene ID | 196528 |
| Gene name | AT-rich interaction domain 2 | |
| Gene Alias | BAF200 | |
| Cytomap | 12q12 | |
| Gene Type | protein-coding | GO ID | GO:0000018 | UniProtAcc | Q68CP9 |
Top |
Malignant transformation analysis |
| Identification of the aberrant gene expression in precancerous and cancerous lesions by comparing the gene expression of stem-like cells in diseased tissues with normal stem cells |
| Entrez ID | Symbol | Replicates | Species | Organ | Tissue | Adj P-value | Log2FC | Malignancy |
| 196528 | ARID2 | AEH-subject1 | Human | Endometrium | AEH | 1.28e-22 | 6.22e-01 | -0.3059 |
| 196528 | ARID2 | AEH-subject2 | Human | Endometrium | AEH | 1.43e-03 | 2.56e-01 | -0.2525 |
| 196528 | ARID2 | AEH-subject3 | Human | Endometrium | AEH | 1.15e-05 | 3.20e-01 | -0.2576 |
| 196528 | ARID2 | AEH-subject4 | Human | Endometrium | AEH | 4.34e-11 | 4.90e-01 | -0.2657 |
| 196528 | ARID2 | AEH-subject5 | Human | Endometrium | AEH | 1.11e-07 | 4.51e-01 | -0.2953 |
| 196528 | ARID2 | EEC-subject1 | Human | Endometrium | EEC | 2.50e-19 | 5.50e-01 | -0.2682 |
| 196528 | ARID2 | EEC-subject2 | Human | Endometrium | EEC | 1.12e-05 | 3.70e-01 | -0.2607 |
| 196528 | ARID2 | EEC-subject4 | Human | Endometrium | EEC | 1.16e-04 | 2.71e-01 | -0.2571 |
| 196528 | ARID2 | EEC-subject5 | Human | Endometrium | EEC | 3.31e-07 | 3.62e-01 | -0.249 |
| 196528 | ARID2 | GSM6177620_NYU_UCEC1_lib1_lib1 | Human | Endometrium | EEC | 1.48e-11 | 1.17e-01 | -0.1869 |
| 196528 | ARID2 | GSM6177620_NYU_UCEC1_lib2_lib2 | Human | Endometrium | EEC | 4.62e-08 | 9.79e-02 | -0.1875 |
| 196528 | ARID2 | GSM6177620_NYU_UCEC1_lib3_lib3 | Human | Endometrium | EEC | 3.84e-14 | 5.12e-02 | -0.1883 |
| 196528 | ARID2 | GSM6177621_NYU_UCEC2_lib1_lib1 | Human | Endometrium | EEC | 1.62e-12 | 4.30e-01 | -0.1934 |
| 196528 | ARID2 | GSM6177622_NYU_UCEC3_lib1_lib1 | Human | Endometrium | EEC | 1.94e-12 | 4.68e-02 | -0.1917 |
| 196528 | ARID2 | GSM6177622_NYU_UCEC3_lib2_lib2 | Human | Endometrium | EEC | 3.25e-14 | 6.00e-02 | -0.1916 |
| 196528 | ARID2 | LZE4T | Human | Esophagus | ESCC | 4.36e-03 | 1.21e-01 | 0.0811 |
| 196528 | ARID2 | LZE7T | Human | Esophagus | ESCC | 3.89e-07 | 3.90e-01 | 0.0667 |
| 196528 | ARID2 | LZE8T | Human | Esophagus | ESCC | 4.18e-04 | 1.83e-01 | 0.067 |
| 196528 | ARID2 | LZE20T | Human | Esophagus | ESCC | 9.39e-10 | 4.19e-01 | 0.0662 |
| 196528 | ARID2 | LZE22T | Human | Esophagus | ESCC | 1.48e-02 | 3.43e-01 | 0.068 |
| Page: 1 2 3 4 5 6 7 8 |
| Tissue | Expression Dynamics | Abbreviation |
| Cervix |  | CC: Cervix cancer |
| HSIL_HPV: HPV-infected high-grade squamous intraepithelial lesions | ||
| N_HPV: HPV-infected normal cervix | ||
| Colorectum (GSE201348) |  | FAP: Familial adenomatous polyposis |
| CRC: Colorectal cancer | ||
| Colorectum (HTA11) |  | AD: Adenomas |
| SER: Sessile serrated lesions | ||
| MSI-H: Microsatellite-high colorectal cancer | ||
| MSS: Microsatellite stable colorectal cancer | ||
| Endometrium | 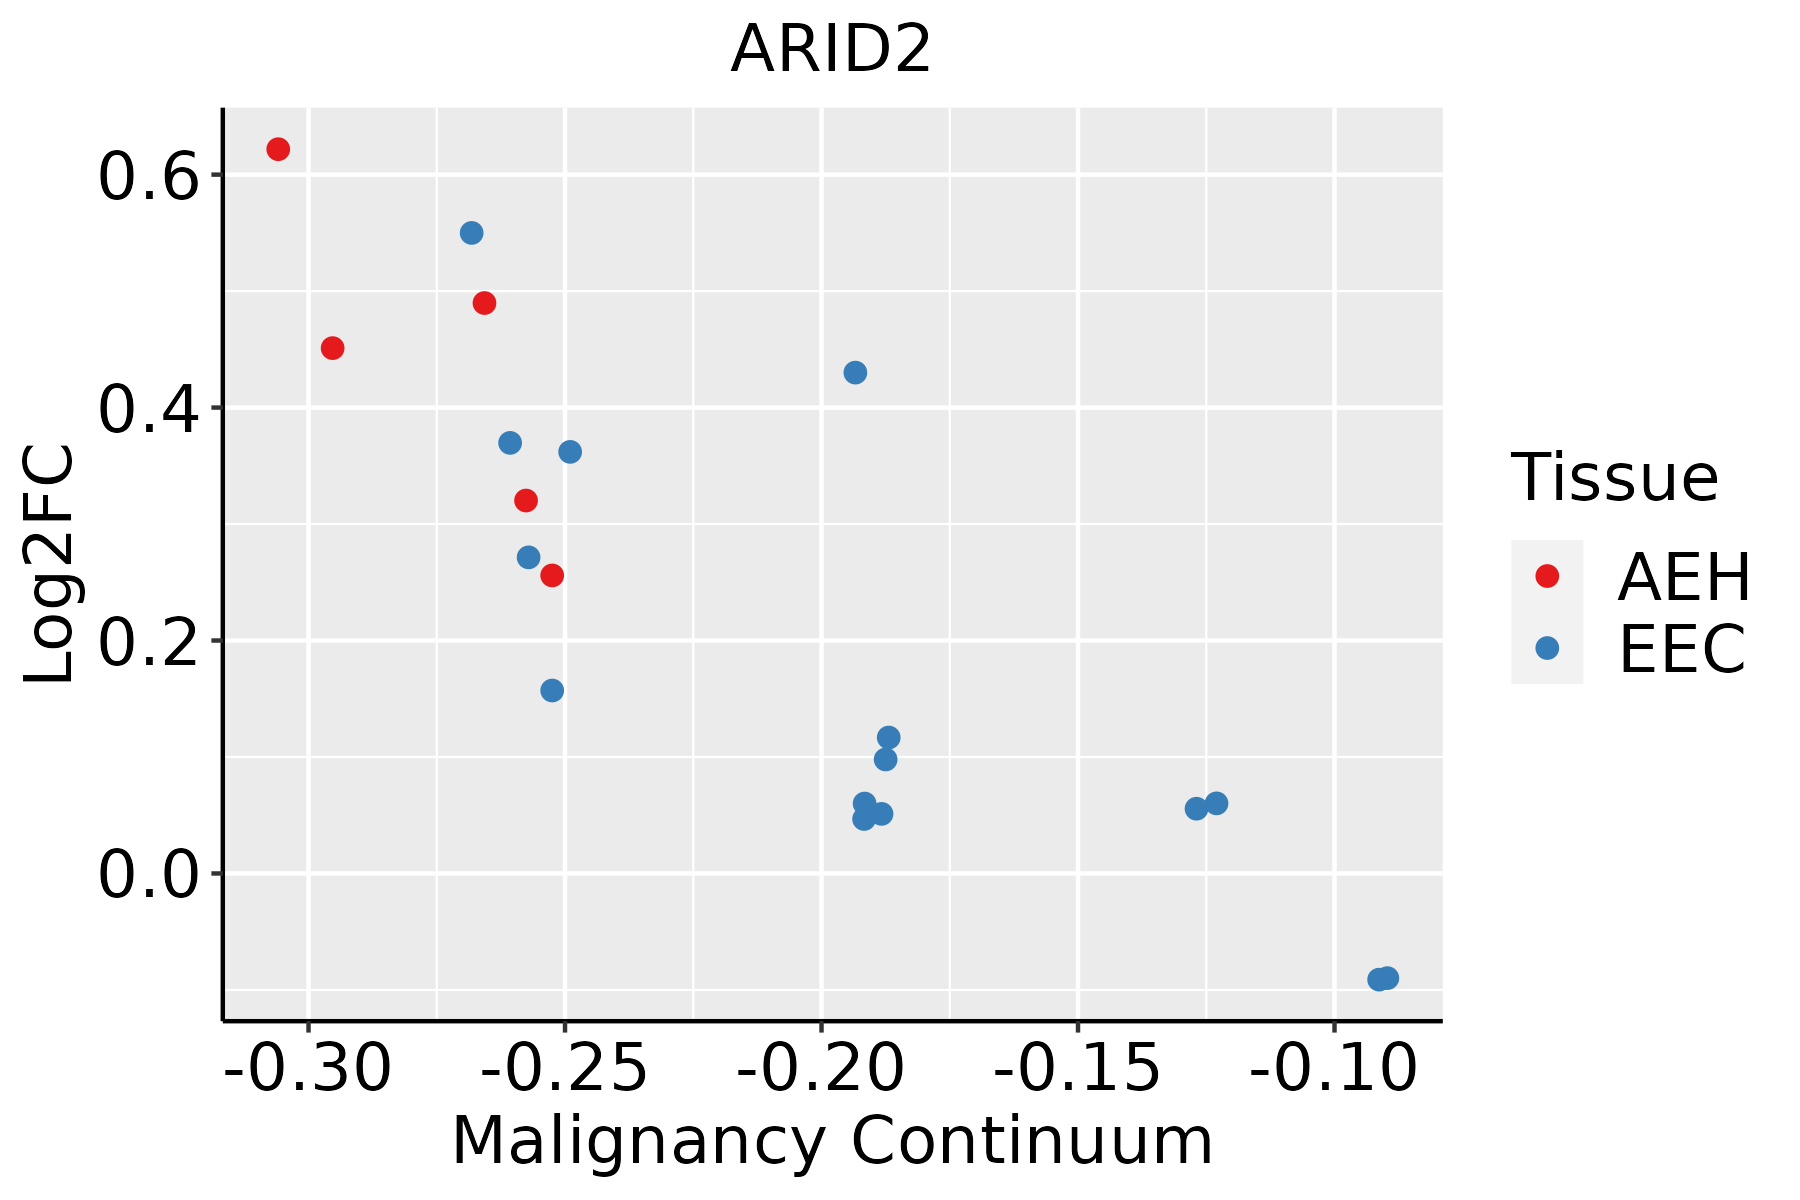 | AEH: Atypical endometrial hyperplasia |
| EEC: Endometrioid Cancer | ||
| Esophagus | 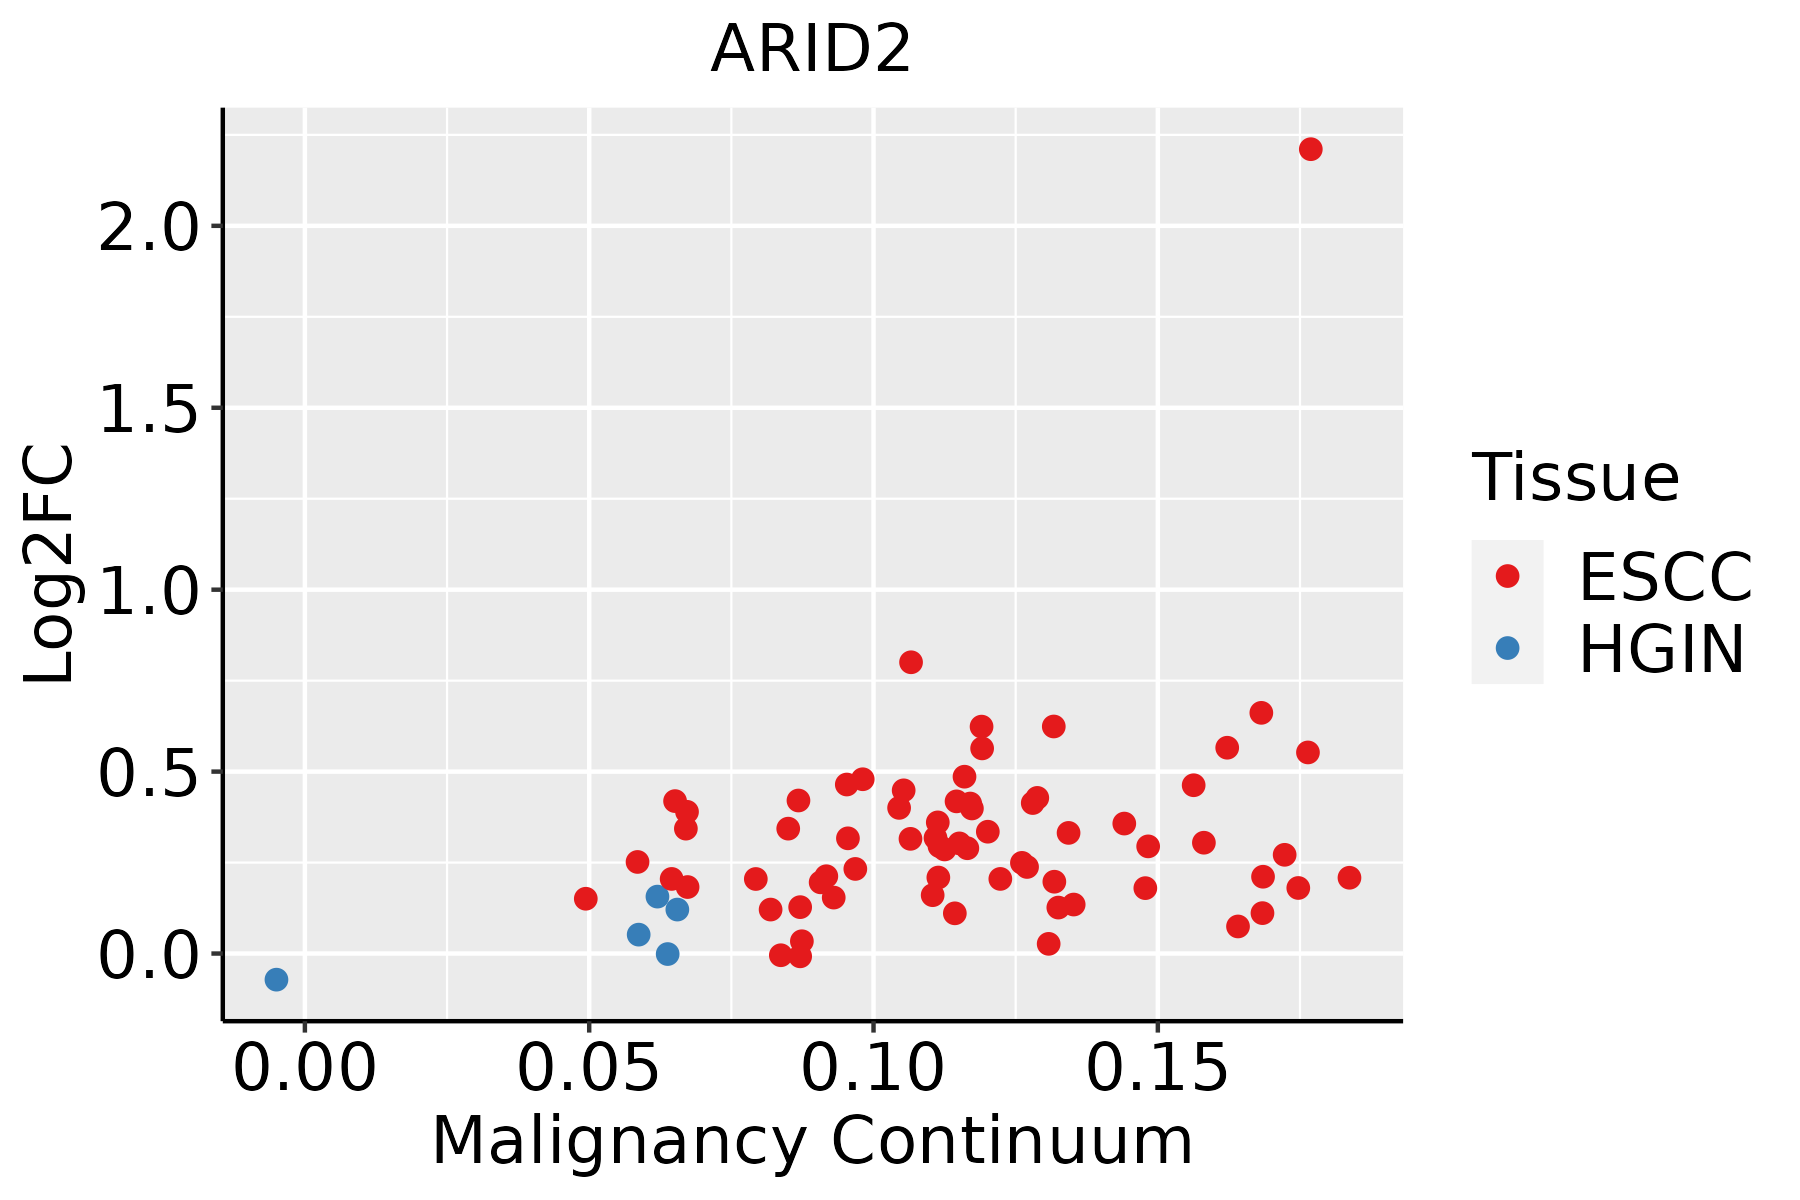 | ESCC: Esophageal squamous cell carcinoma |
| HGIN: High-grade intraepithelial neoplasias | ||
| LGIN: Low-grade intraepithelial neoplasias | ||
| Lung | 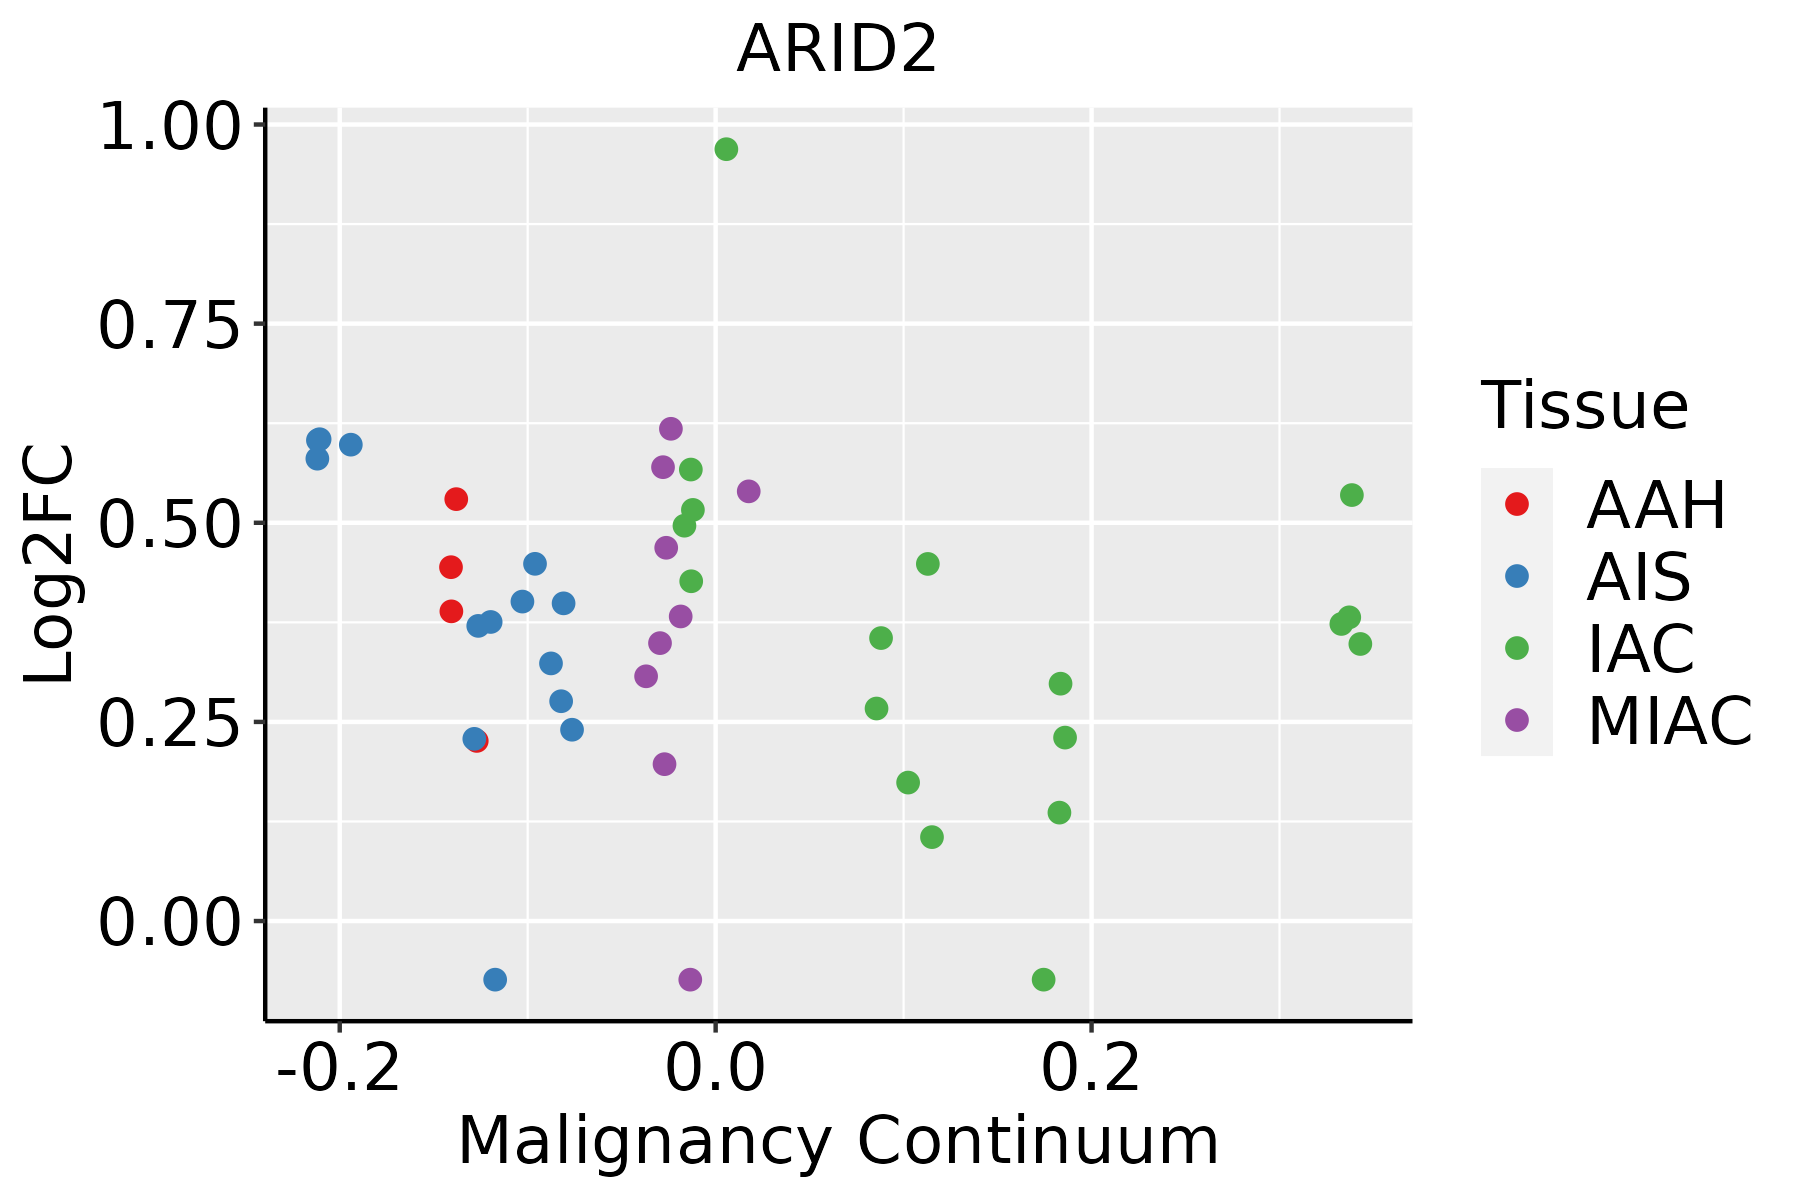 | AAH: Atypical adenomatous hyperplasia |
| AIS: Adenocarcinoma in situ | ||
| IAC: Invasive lung adenocarcinoma | ||
| MIA: Minimally invasive adenocarcinoma | ||
| Oral Cavity |  | EOLP: Erosive Oral lichen planus |
| LP: leukoplakia | ||
| NEOLP: Non-erosive oral lichen planus | ||
| OSCC: Oral squamous cell carcinoma | ||
| Skin |  | AK: Actinic keratosis |
| cSCC: Cutaneous squamous cell carcinoma | ||
| SCCIS:squamous cell carcinoma in situ | ||
| Thyroid | 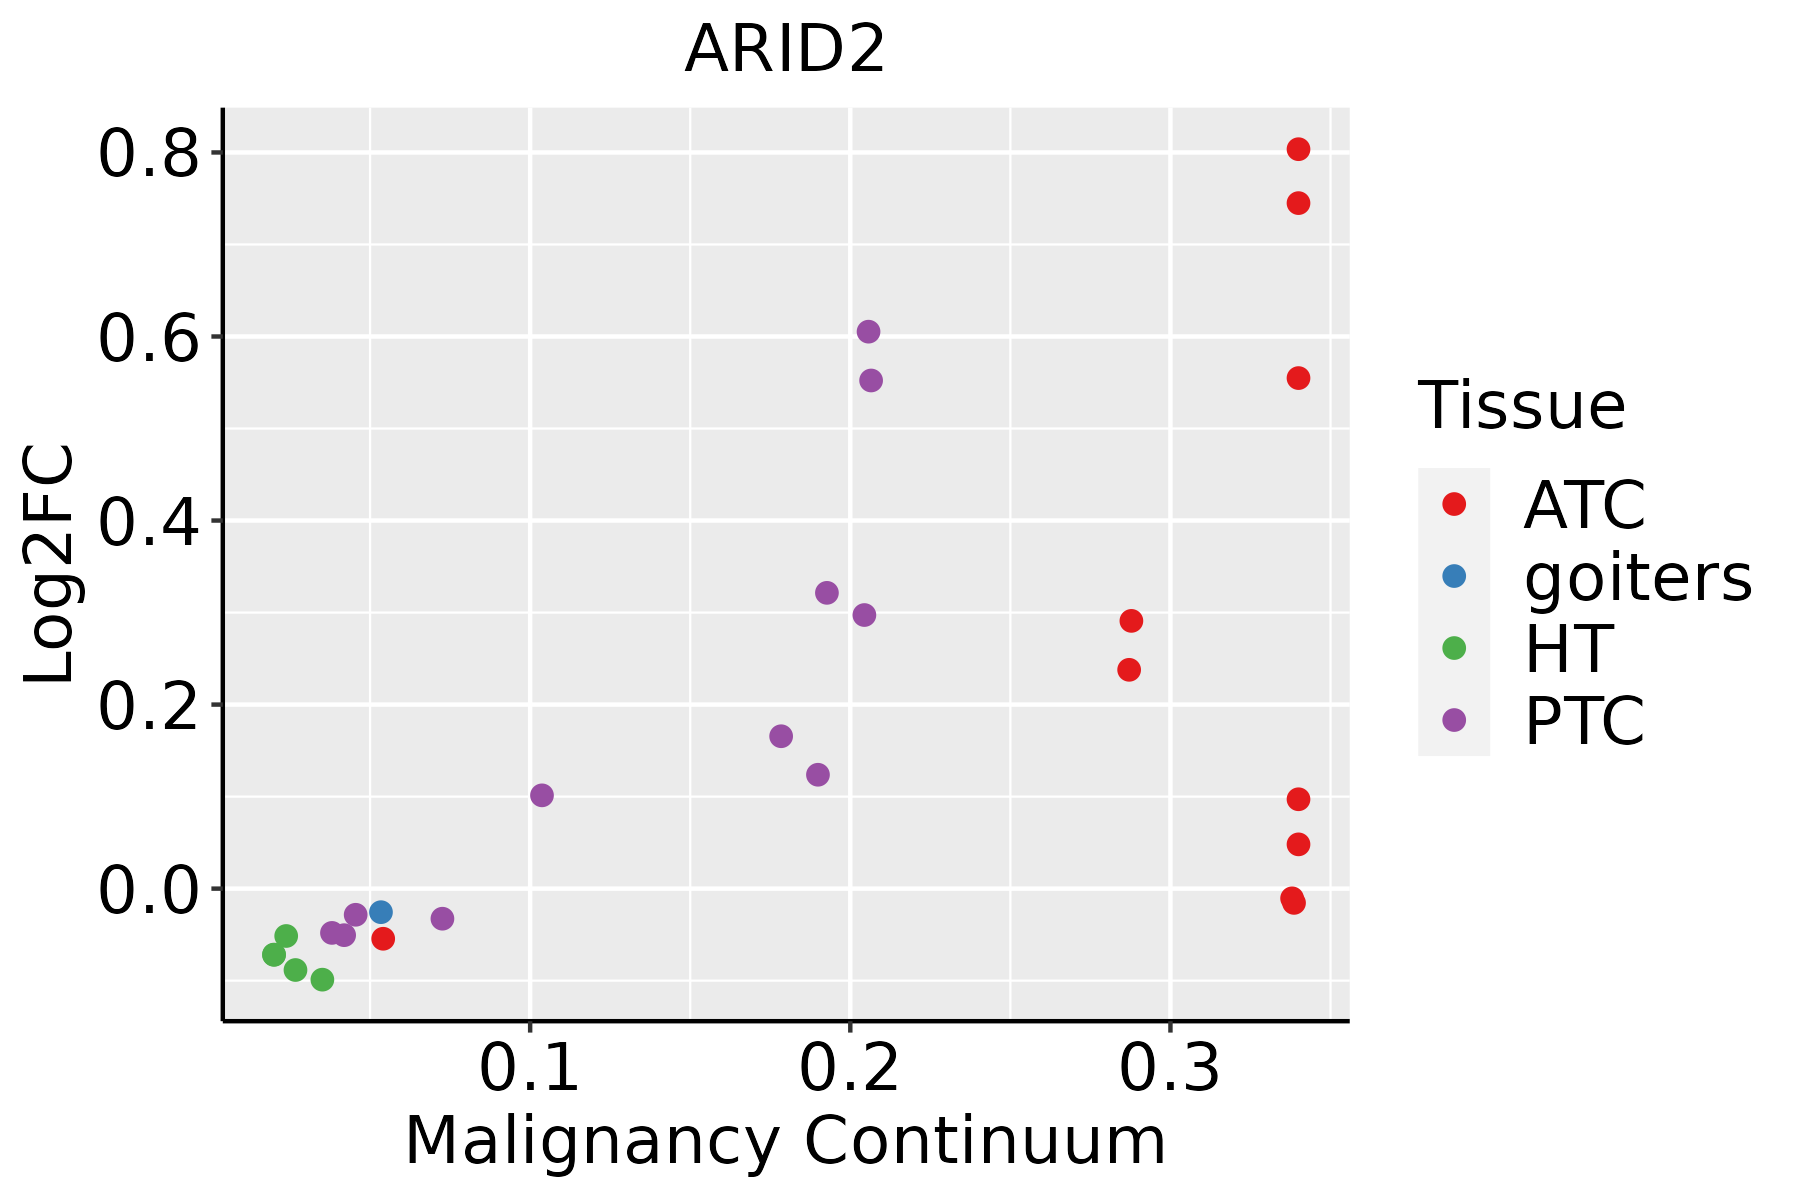 | ATC: Anaplastic thyroid cancer |
| HT: Hashimoto's thyroiditis | ||
| PTC: Papillary thyroid cancer |
| ∗log2FC in expression of this searched gene in stem-like cells from each diseased tissue sample relative to stem-like cells in normal samples in each tissue plotted against the malignancy continuum. Samples are colored based on if they are from different disease stage. |
Top |
Malignant transformation related pathway analysis |
| Find out the enriched GO biological processes and KEGG pathways involved in transition from healthy to precancer to cancer |
| Tissue | Disease Stage | Enriched GO biological Processes |
| Colorectum | AD |  |
| Colorectum | SER |  |
| Colorectum | MSS |  |
| Colorectum | MSI-H |  |
| Colorectum | FAP |  |
| ∗Top 15 enriched GO BP terms are showed in the bar plot of each disease state in each tissue. Each row represents a significant GO biological process which is colored according to the -log10(p.adjust). |
| Page: 1 2 3 4 5 6 7 8 9 |
| GO ID | Tissue | Disease Stage | Description | Gene Ratio | Bg Ratio | pvalue | p.adjust | Count |
| GO:004873210 | Cervix | CC | gland development | 84/2311 | 436/18723 | 1.93e-05 | 3.54e-04 | 84 |
| GO:00512713 | Cervix | CC | negative regulation of cellular component movement | 73/2311 | 367/18723 | 2.22e-05 | 3.95e-04 | 73 |
| GO:00400133 | Cervix | CC | negative regulation of locomotion | 76/2311 | 391/18723 | 3.47e-05 | 5.60e-04 | 76 |
| GO:20001463 | Cervix | CC | negative regulation of cell motility | 71/2311 | 359/18723 | 3.47e-05 | 5.60e-04 | 71 |
| GO:00488634 | Cervix | CC | stem cell differentiation | 46/2311 | 206/18723 | 4.11e-05 | 6.36e-04 | 46 |
| GO:00303363 | Cervix | CC | negative regulation of cell migration | 68/2311 | 344/18723 | 5.11e-05 | 7.70e-04 | 68 |
| GO:00063257 | Cervix | CC | chromatin organization | 78/2311 | 409/18723 | 5.40e-05 | 8.02e-04 | 78 |
| GO:002241110 | Cervix | CC | cellular component disassembly | 83/2311 | 443/18723 | 6.04e-05 | 8.68e-04 | 83 |
| GO:00605375 | Cervix | CC | muscle tissue development | 76/2311 | 403/18723 | 9.76e-05 | 1.27e-03 | 76 |
| GO:00165705 | Cervix | CC | histone modification | 84/2311 | 463/18723 | 1.70e-04 | 2.01e-03 | 84 |
| GO:00147064 | Cervix | CC | striated muscle tissue development | 72/2311 | 384/18723 | 1.76e-04 | 2.07e-03 | 72 |
| GO:20010209 | Cervix | CC | regulation of response to DNA damage stimulus | 46/2311 | 219/18723 | 1.92e-04 | 2.23e-03 | 46 |
| GO:00610089 | Cervix | CC | hepaticobiliary system development | 34/2311 | 150/18723 | 2.92e-04 | 3.14e-03 | 34 |
| GO:00018899 | Cervix | CC | liver development | 33/2311 | 147/18723 | 4.27e-04 | 4.30e-03 | 33 |
| GO:0033002 | Cervix | CC | muscle cell proliferation | 49/2311 | 248/18723 | 5.43e-04 | 5.24e-03 | 49 |
| GO:00349685 | Cervix | CC | histone lysine methylation | 27/2311 | 115/18723 | 6.61e-04 | 6.09e-03 | 27 |
| GO:00486386 | Cervix | CC | regulation of developmental growth | 61/2311 | 330/18723 | 7.69e-04 | 6.85e-03 | 61 |
| GO:00310565 | Cervix | CC | regulation of histone modification | 33/2311 | 152/18723 | 7.97e-04 | 7.00e-03 | 33 |
| GO:00510528 | Cervix | CC | regulation of DNA metabolic process | 65/2311 | 359/18723 | 9.25e-04 | 7.84e-03 | 65 |
| GO:00165715 | Cervix | CC | histone methylation | 30/2311 | 141/18723 | 1.88e-03 | 1.39e-02 | 30 |
| Page: 1 2 3 4 5 6 7 8 9 10 11 12 13 14 15 16 17 18 19 20 21 22 23 24 25 26 27 28 29 30 31 32 33 34 35 |
| Pathway ID | Tissue | Disease Stage | Description | Gene Ratio | Bg Ratio | pvalue | p.adjust | qvalue | Count |
| hsa0522510 | Cervix | CC | Hepatocellular carcinoma | 40/1267 | 168/8465 | 1.52e-03 | 6.39e-03 | 3.78e-03 | 40 |
| hsa0522513 | Cervix | CC | Hepatocellular carcinoma | 40/1267 | 168/8465 | 1.52e-03 | 6.39e-03 | 3.78e-03 | 40 |
| hsa05225 | Colorectum | AD | Hepatocellular carcinoma | 59/2092 | 168/8465 | 1.50e-03 | 8.69e-03 | 5.54e-03 | 59 |
| hsa052251 | Colorectum | AD | Hepatocellular carcinoma | 59/2092 | 168/8465 | 1.50e-03 | 8.69e-03 | 5.54e-03 | 59 |
| hsa052252 | Colorectum | MSS | Hepatocellular carcinoma | 56/1875 | 168/8465 | 5.04e-04 | 3.45e-03 | 2.11e-03 | 56 |
| hsa052253 | Colorectum | MSS | Hepatocellular carcinoma | 56/1875 | 168/8465 | 5.04e-04 | 3.45e-03 | 2.11e-03 | 56 |
| hsa052254 | Colorectum | FAP | Hepatocellular carcinoma | 43/1404 | 168/8465 | 1.78e-03 | 8.99e-03 | 5.47e-03 | 43 |
| hsa052255 | Colorectum | FAP | Hepatocellular carcinoma | 43/1404 | 168/8465 | 1.78e-03 | 8.99e-03 | 5.47e-03 | 43 |
| hsa052256 | Colorectum | CRC | Hepatocellular carcinoma | 37/1091 | 168/8465 | 6.38e-04 | 5.89e-03 | 3.99e-03 | 37 |
| hsa052257 | Colorectum | CRC | Hepatocellular carcinoma | 37/1091 | 168/8465 | 6.38e-04 | 5.89e-03 | 3.99e-03 | 37 |
| hsa0522518 | Esophagus | ESCC | Hepatocellular carcinoma | 109/4205 | 168/8465 | 4.27e-05 | 1.88e-04 | 9.64e-05 | 109 |
| hsa0522519 | Esophagus | ESCC | Hepatocellular carcinoma | 109/4205 | 168/8465 | 4.27e-05 | 1.88e-04 | 9.64e-05 | 109 |
| hsa052259 | Lung | IAC | Hepatocellular carcinoma | 33/1053 | 168/8465 | 4.77e-03 | 2.15e-02 | 1.43e-02 | 33 |
| hsa0522512 | Lung | IAC | Hepatocellular carcinoma | 33/1053 | 168/8465 | 4.77e-03 | 2.15e-02 | 1.43e-02 | 33 |
| hsa0522521 | Lung | AIS | Hepatocellular carcinoma | 31/961 | 168/8465 | 4.11e-03 | 2.15e-02 | 1.38e-02 | 31 |
| hsa0522531 | Lung | AIS | Hepatocellular carcinoma | 31/961 | 168/8465 | 4.11e-03 | 2.15e-02 | 1.38e-02 | 31 |
| hsa0522516 | Oral cavity | OSCC | Hepatocellular carcinoma | 97/3704 | 168/8465 | 1.63e-04 | 5.52e-04 | 2.81e-04 | 97 |
| hsa0522517 | Oral cavity | OSCC | Hepatocellular carcinoma | 97/3704 | 168/8465 | 1.63e-04 | 5.52e-04 | 2.81e-04 | 97 |
| hsa0522523 | Oral cavity | EOLP | Hepatocellular carcinoma | 39/1218 | 168/8465 | 1.35e-03 | 4.80e-03 | 2.83e-03 | 39 |
| hsa0522533 | Oral cavity | EOLP | Hepatocellular carcinoma | 39/1218 | 168/8465 | 1.35e-03 | 4.80e-03 | 2.83e-03 | 39 |
| Page: 1 |
Top |
Cell-cell communication analysis |
| Identification of potential cell-cell interactions between two cell types and their ligand-receptor pairs for different disease states |
| Ligand | Receptor | LRpair | Pathway | Tissue | Disease Stage |
| Page: 1 |
Top |
Single-cell gene regulatory network inference analysis |
| Find out the significant the regulons (TFs) and the target genes of each regulon across cell types for different disease states |
| TF | Cell Type | Tissue | Disease Stage | Target Gene | RSS | Regulon Activity |
| ∗The dot plots of a searched regulon are shown for all cell subpopulations in each disease state of each tissue based on the regulon specific score inferred using pySCENIC and by calculating the average expression. |
| Page: 1 |
Top |
Somatic mutation of malignant transformation related genes |
| Annotation of somatic variants for genes involved in malignant transformation |
| Hugo Symbol | Variant Class | Variant Classification | dbSNP RS | HGVSc | HGVSp | HGVSp Short | SWISSPROT | BIOTYPE | SIFT | PolyPhen | Tumor Sample Barcode | Tissue | Histology | Sex | Age | Stage | Therapy Types | Drugs | Outcome |
| ARID2 | SNV | Missense_Mutation | c.3931N>G | p.Lys1311Glu | p.K1311E | Q68CP9 | protein_coding | tolerated_low_confidence(0.06) | benign(0.444) | TCGA-A7-A13E-01 | Breast | breast invasive carcinoma | Female | <65 | I/II | Targeted Molecular therapy | bevacizumab | PD | |
| ARID2 | SNV | Missense_Mutation | c.4304C>T | p.Ser1435Leu | p.S1435L | Q68CP9 | protein_coding | tolerated_low_confidence(0.14) | benign(0) | TCGA-A8-A06T-01 | Breast | breast invasive carcinoma | Female | >=65 | III/IV | Hormone Therapy | anastrozole | SD | |
| ARID2 | SNV | Missense_Mutation | c.1113N>C | p.Lys371Asn | p.K371N | Q68CP9 | protein_coding | tolerated(0.08) | probably_damaging(0.991) | TCGA-AC-A23H-01 | Breast | breast invasive carcinoma | Female | >=65 | I/II | Unknown | Unknown | PD | |
| ARID2 | SNV | Missense_Mutation | novel | c.3877N>A | p.Leu1293Ile | p.L1293I | Q68CP9 | protein_coding | tolerated_low_confidence(0.08) | benign(0.019) | TCGA-AN-A046-01 | Breast | breast invasive carcinoma | Female | >=65 | I/II | Unknown | Unknown | SD |
| ARID2 | SNV | Missense_Mutation | c.5199T>G | p.Ile1733Met | p.I1733M | Q68CP9 | protein_coding | deleterious(0.01) | benign(0.294) | TCGA-AN-A0FW-01 | Breast | breast invasive carcinoma | Female | >=65 | III/IV | Unknown | Unknown | SD | |
| ARID2 | SNV | Missense_Mutation | c.4364N>A | p.Ser1455Asn | p.S1455N | Q68CP9 | protein_coding | tolerated(0.08) | benign(0) | TCGA-AO-A0JD-01 | Breast | breast invasive carcinoma | Female | <65 | III/IV | Chemotherapy | cyclophosphamide | SD | |
| ARID2 | SNV | Missense_Mutation | c.1715N>A | p.Arg572Lys | p.R572K | Q68CP9 | protein_coding | tolerated(0.1) | probably_damaging(0.987) | TCGA-BH-A0HF-01 | Breast | breast invasive carcinoma | Female | >=65 | I/II | Hormone Therapy | arimidex | SD | |
| ARID2 | SNV | Missense_Mutation | c.4531N>A | p.Glu1511Lys | p.E1511K | Q68CP9 | protein_coding | deleterious_low_confidence(0) | benign(0.257) | TCGA-BH-A0HF-01 | Breast | breast invasive carcinoma | Female | >=65 | I/II | Hormone Therapy | arimidex | SD | |
| ARID2 | SNV | Missense_Mutation | c.2713C>A | p.Gln905Lys | p.Q905K | Q68CP9 | protein_coding | tolerated_low_confidence(0.38) | benign(0.01) | TCGA-BH-A18N-01 | Breast | breast invasive carcinoma | Female | >=65 | I/II | Unknown | Unknown | SD | |
| ARID2 | SNV | Missense_Mutation | novel | c.4758N>T | p.Gln1586His | p.Q1586H | Q68CP9 | protein_coding | deleterious(0.02) | possibly_damaging(0.564) | TCGA-BH-A2L8-01 | Breast | breast invasive carcinoma | Female | <65 | I/II | Chemotherapy | cytoxan | CR |
| Page: 1 2 3 4 5 6 7 8 9 10 11 12 13 14 15 16 17 18 19 20 21 22 23 |
Top |
Related drugs of malignant transformation related genes |
| Identification of chemicals and drugs interact with genes involved in malignant transfromation |
| (DGIdb 4.0) |
| Entrez ID | Symbol | Category | Interaction Types | Drug Claim Name | Drug Name | PMIDs |
| Page: 1 |

Copyright 2023-Present -The University of Texas Health Science Center at Houston |