| Tissue | Expression Dynamics | Abbreviation |
| Cervix | 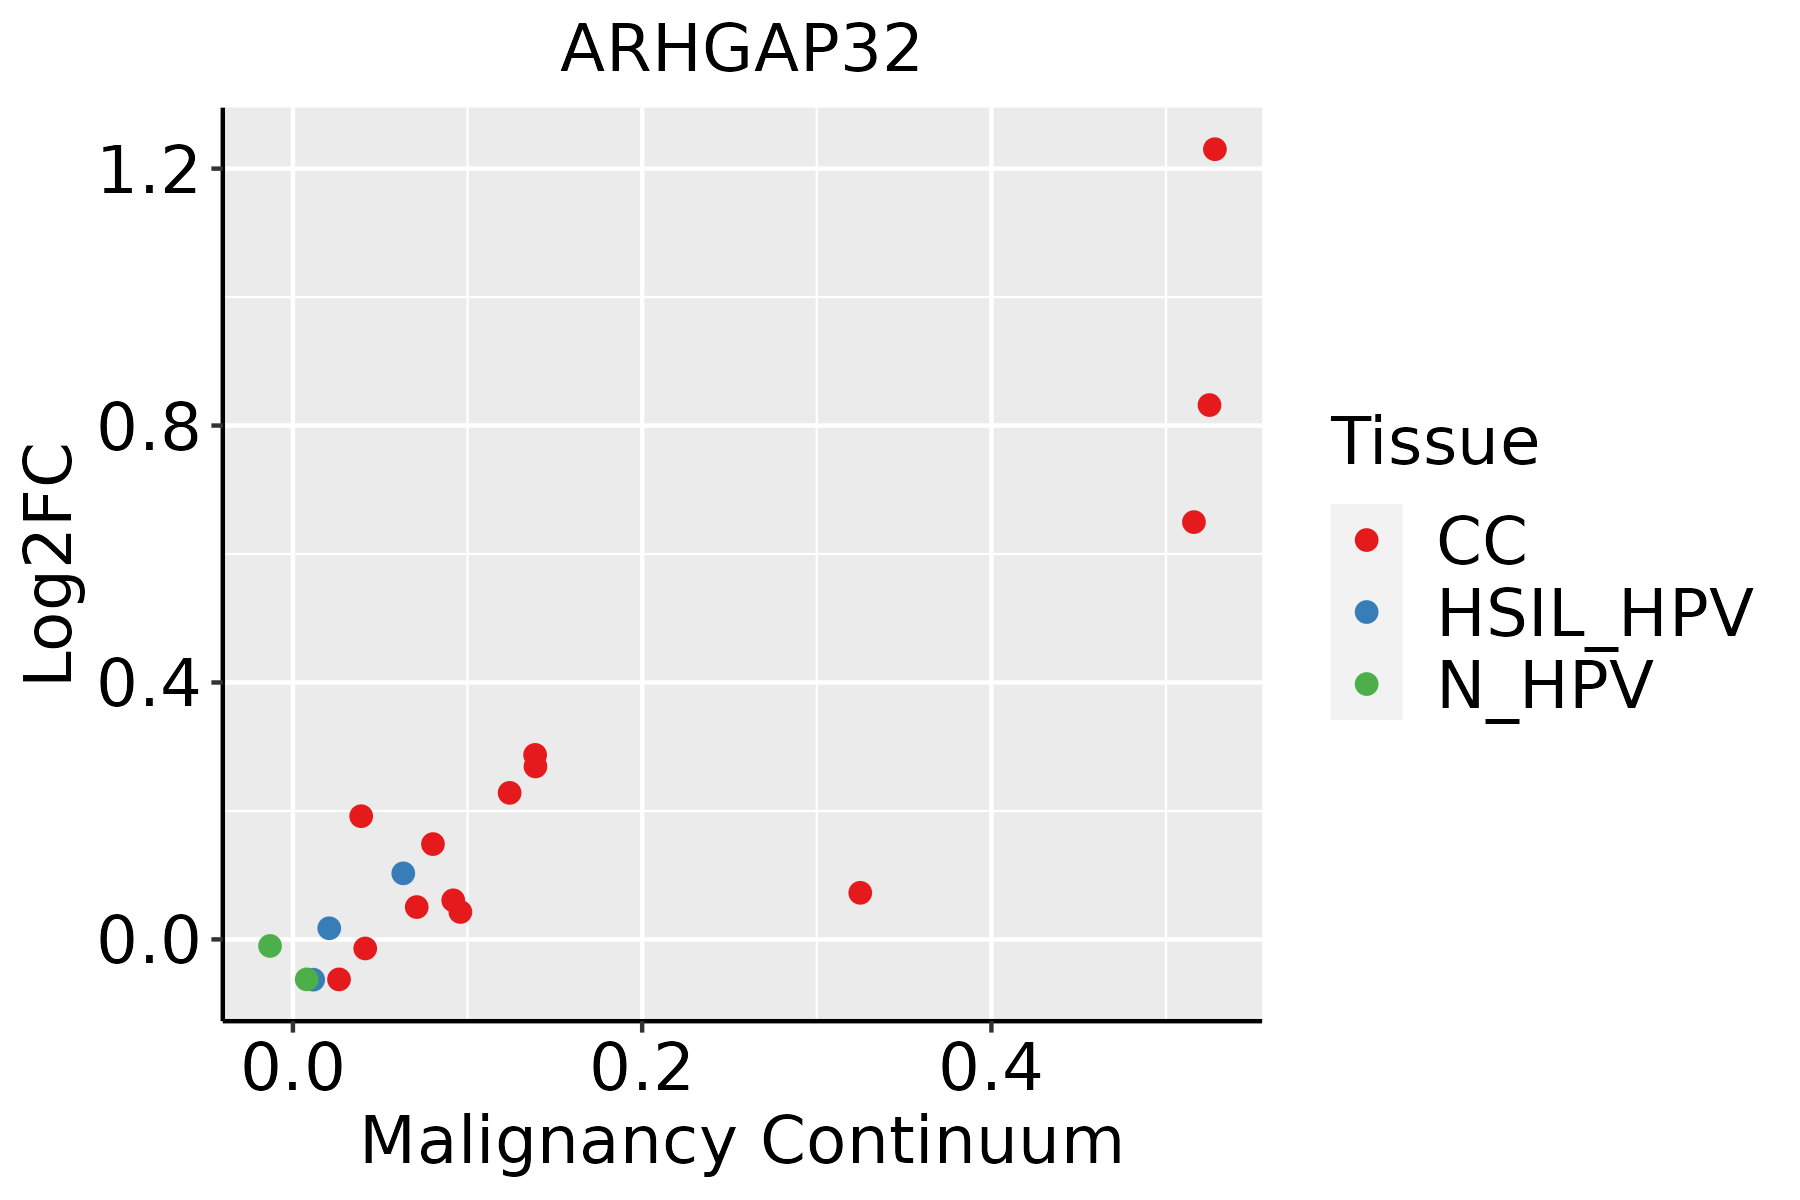 | CC: Cervix cancer |
| HSIL_HPV: HPV-infected high-grade squamous intraepithelial lesions |
| N_HPV: HPV-infected normal cervix |
| Colorectum (GSE201348) | 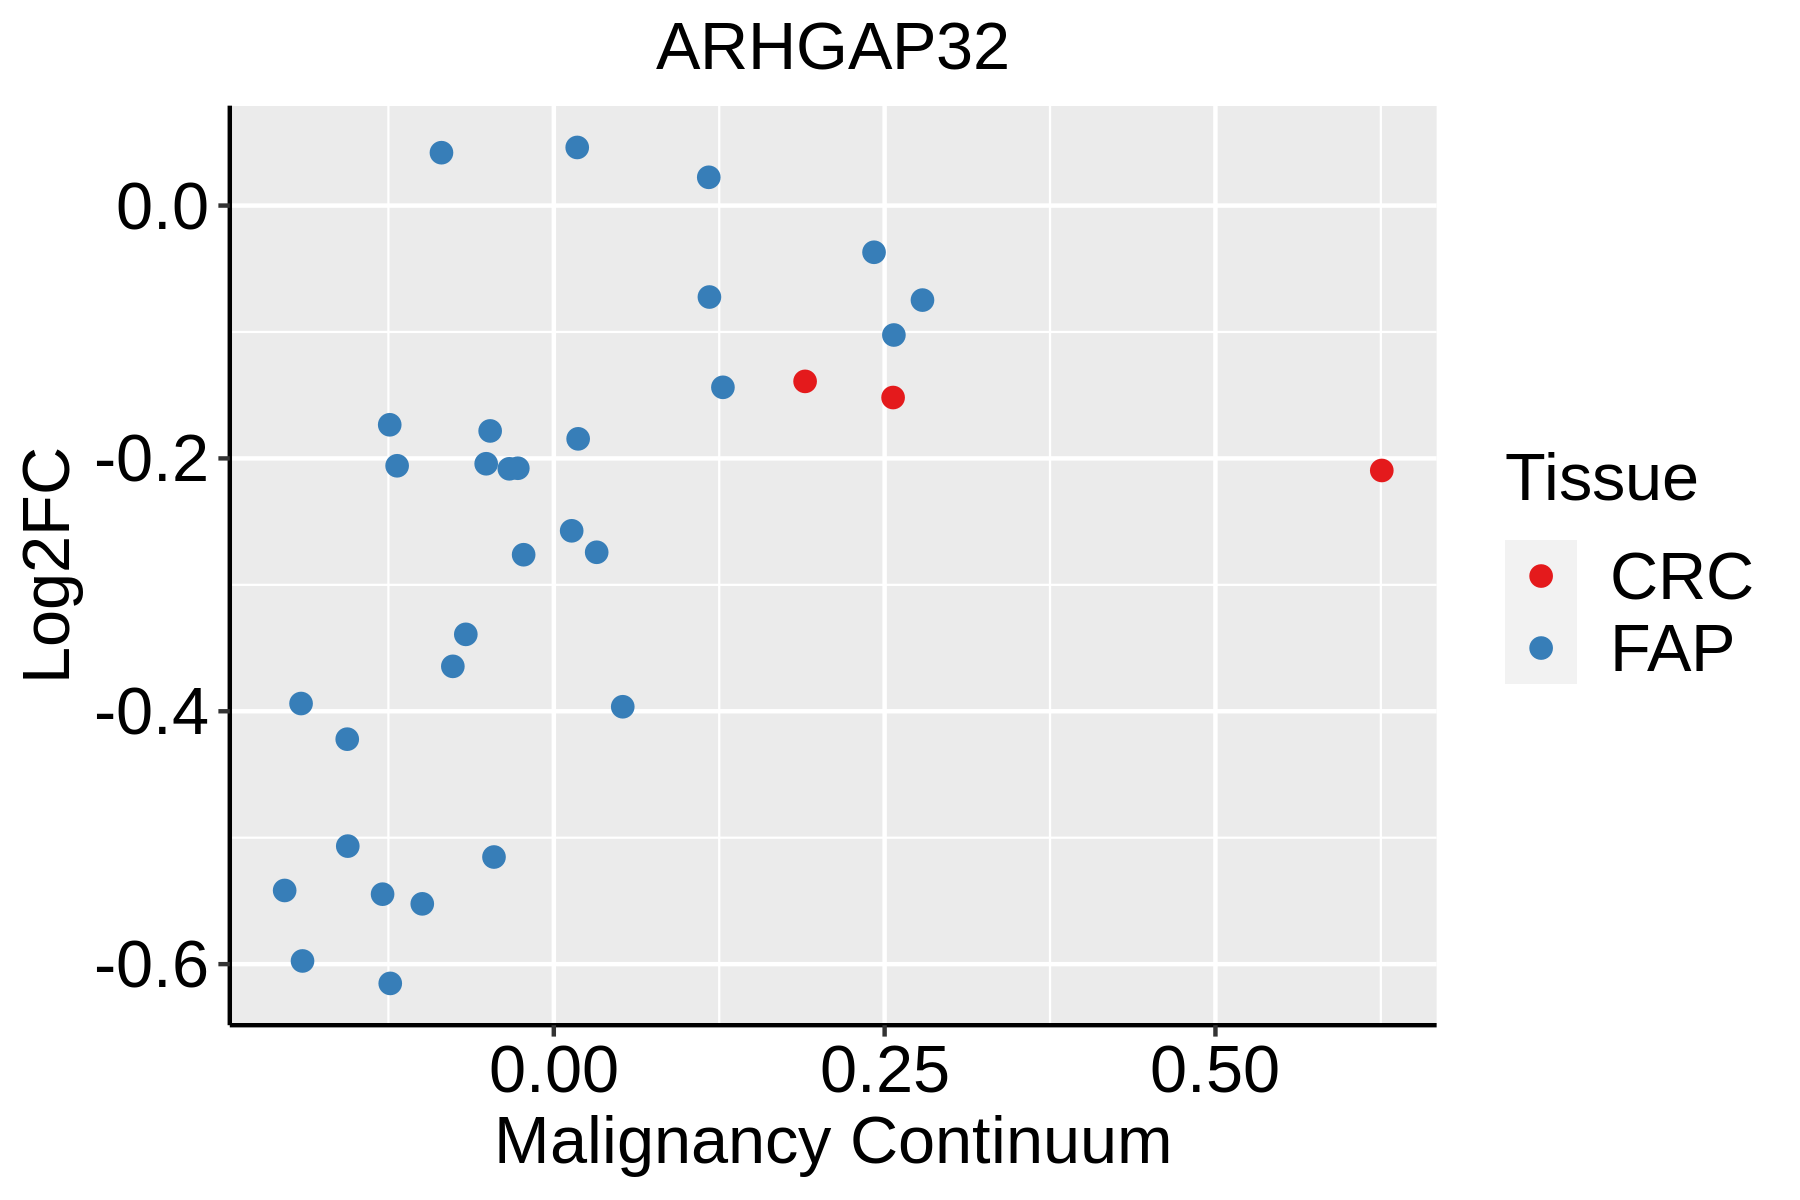 | FAP: Familial adenomatous polyposis |
| CRC: Colorectal cancer |
| Colorectum (HTA11) |  | AD: Adenomas |
| SER: Sessile serrated lesions |
| MSI-H: Microsatellite-high colorectal cancer |
| MSS: Microsatellite stable colorectal cancer |
| Endometrium | 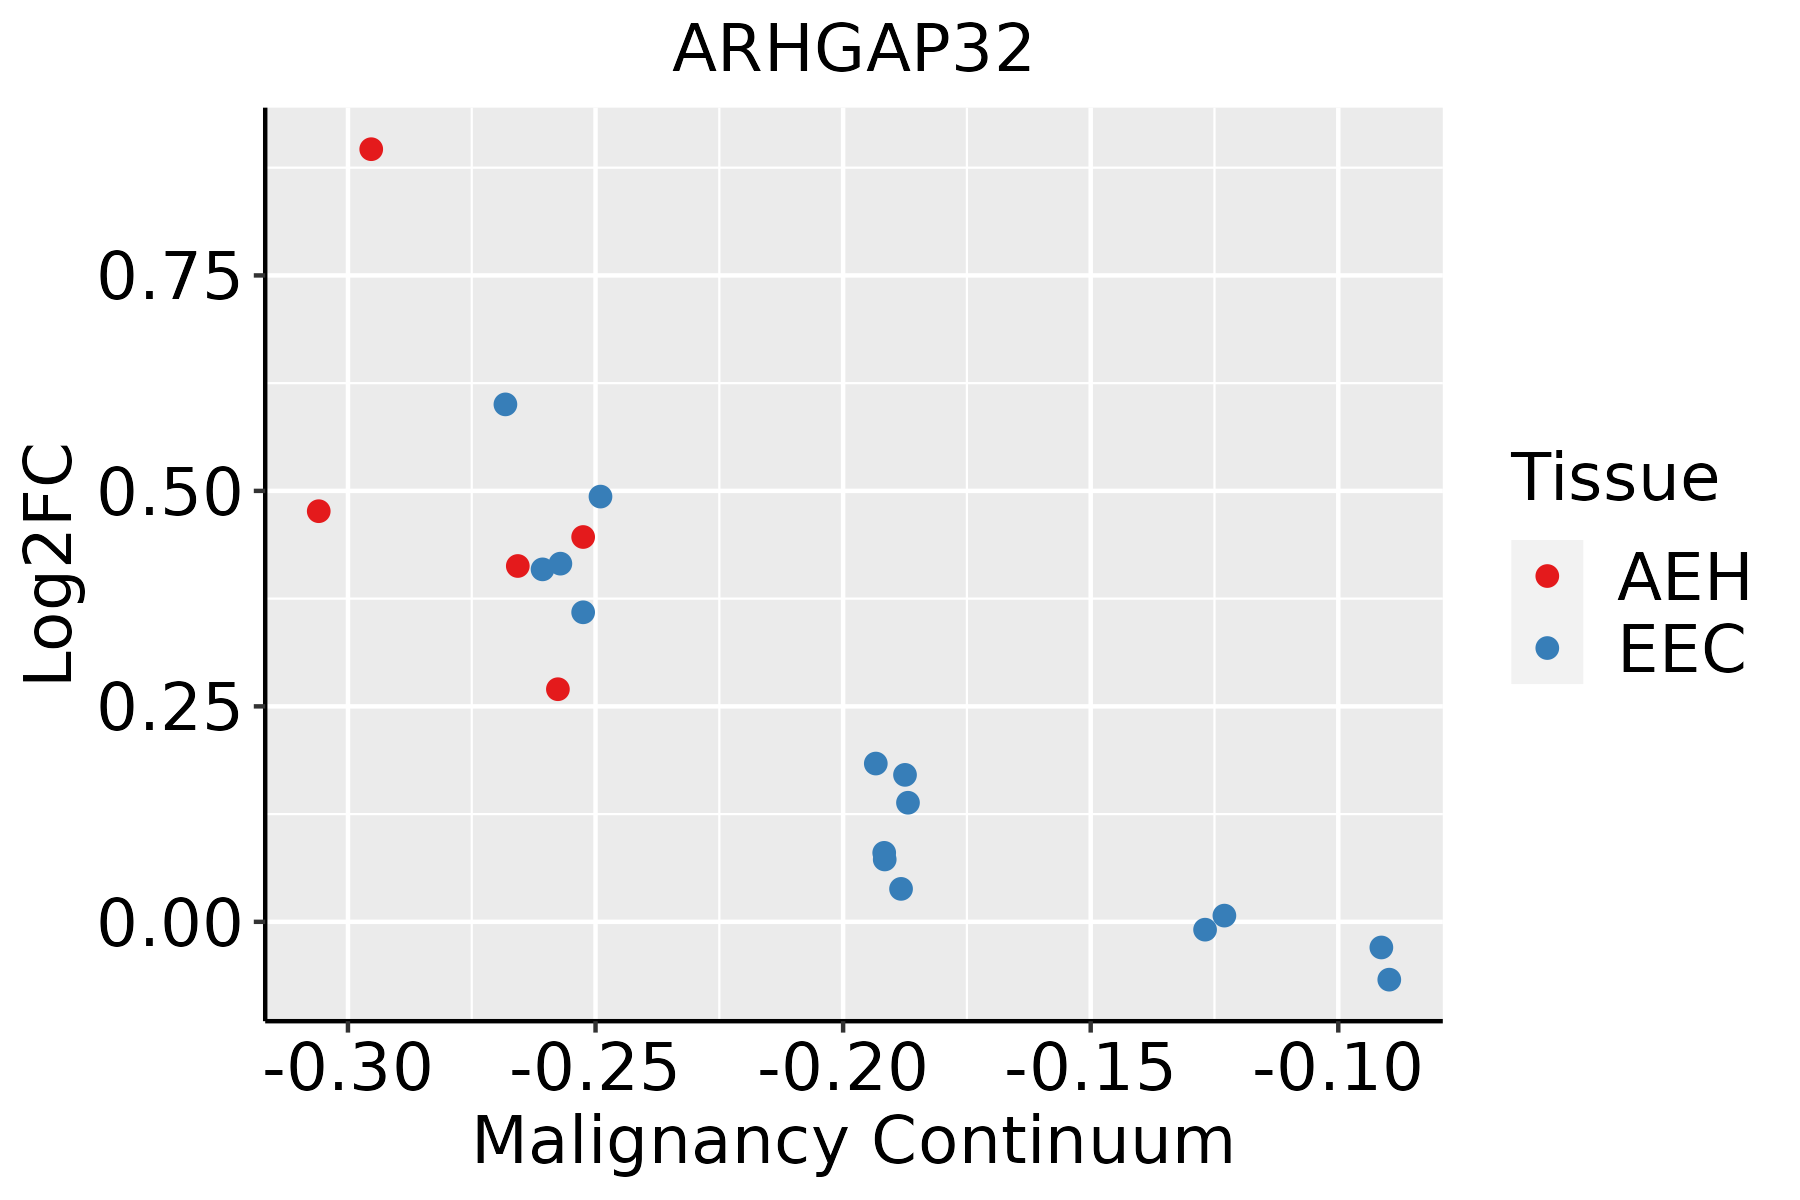 | AEH: Atypical endometrial hyperplasia |
| EEC: Endometrioid Cancer |
| Esophagus | 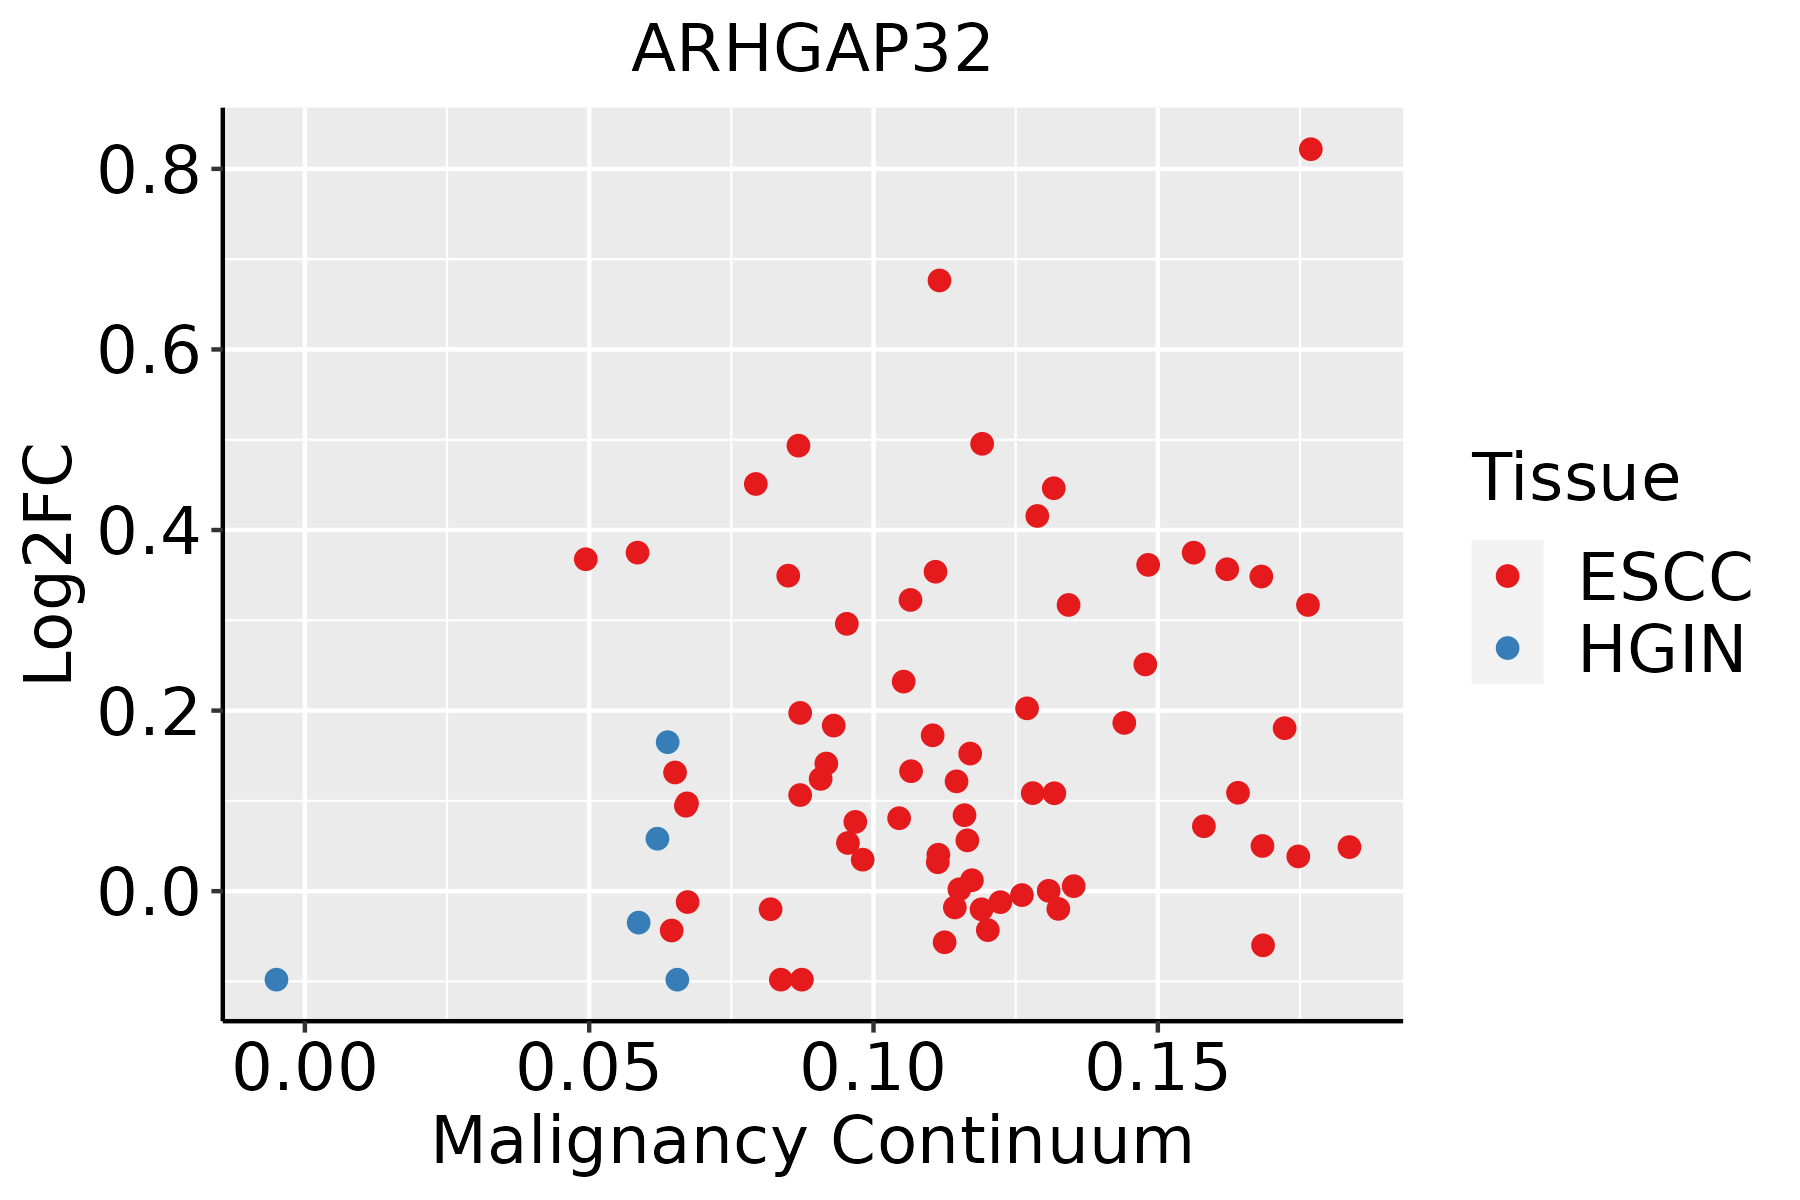 | ESCC: Esophageal squamous cell carcinoma |
| HGIN: High-grade intraepithelial neoplasias |
| LGIN: Low-grade intraepithelial neoplasias |
| Lung | 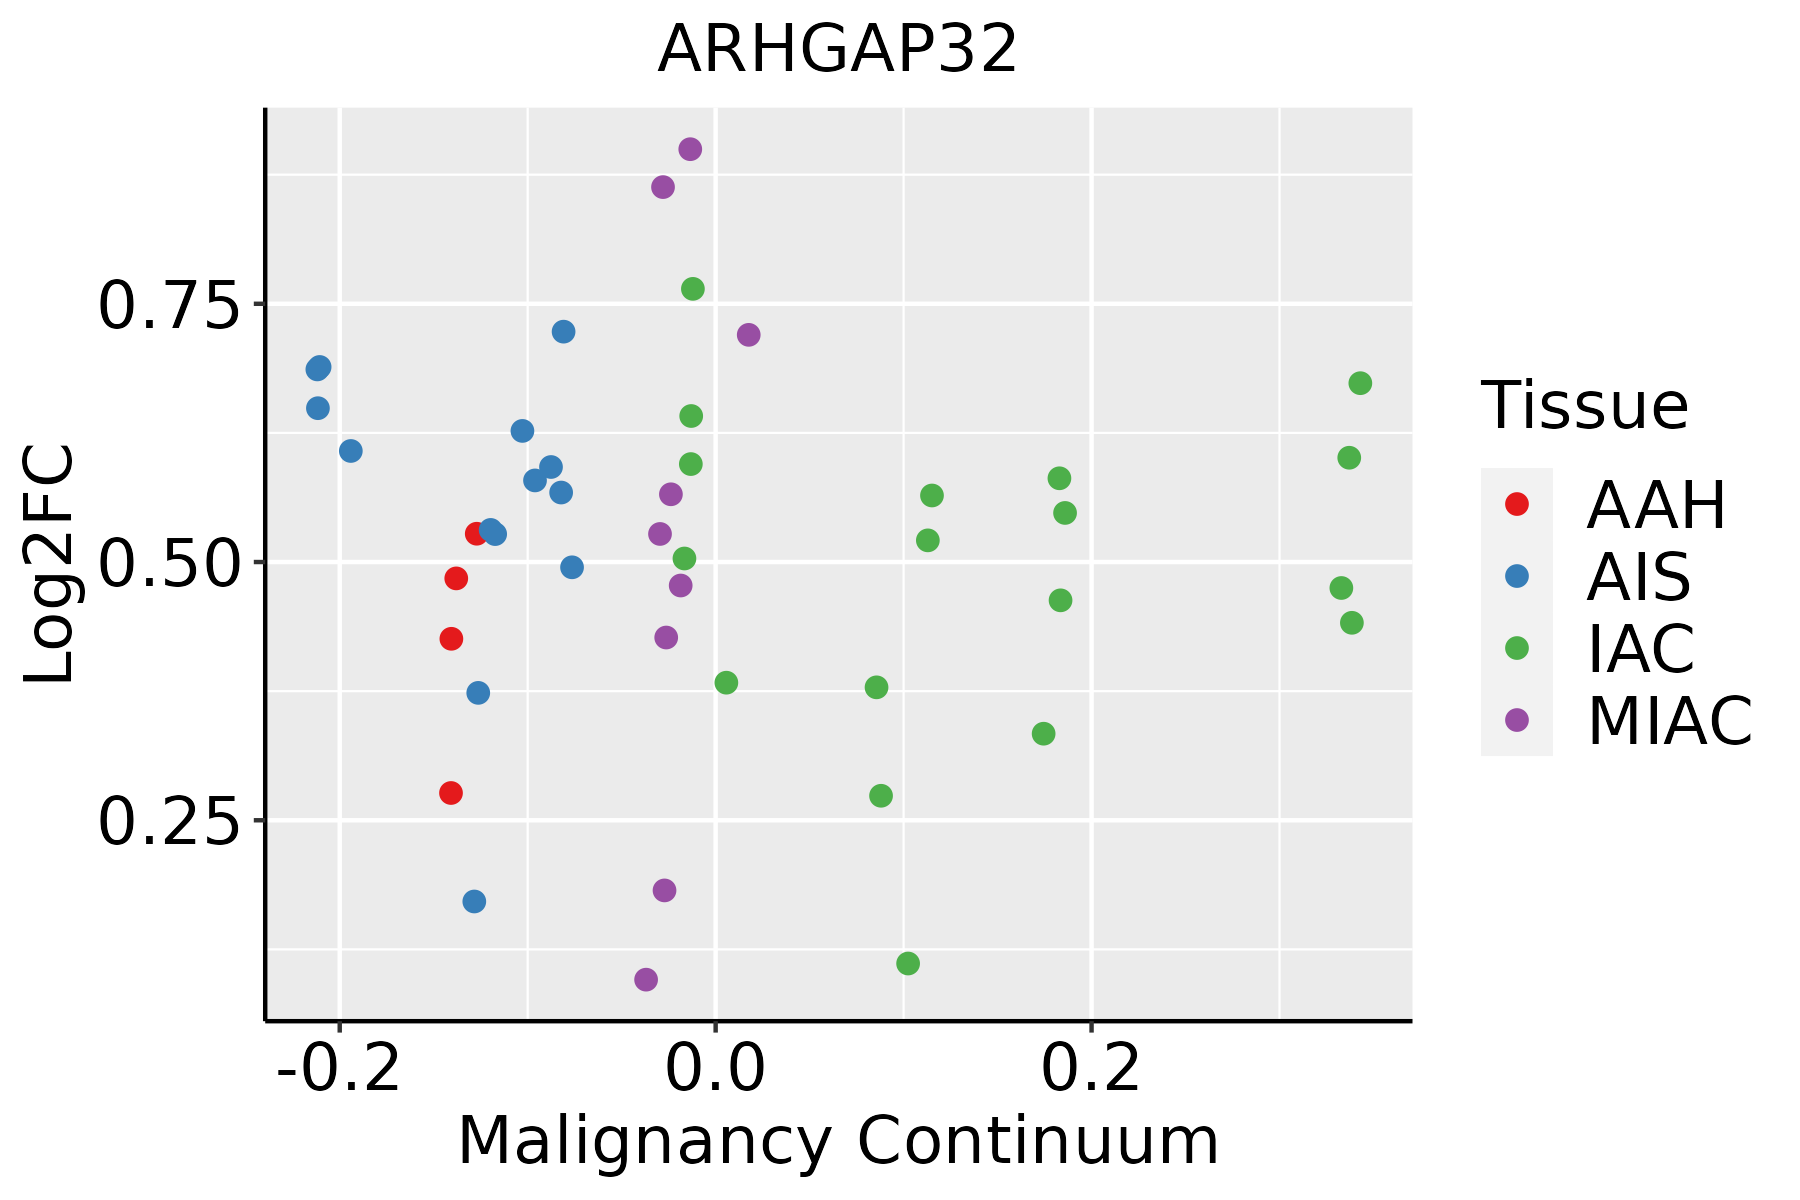 | AAH: Atypical adenomatous hyperplasia |
| AIS: Adenocarcinoma in situ |
| IAC: Invasive lung adenocarcinoma |
| MIA: Minimally invasive adenocarcinoma |
| Oral Cavity | 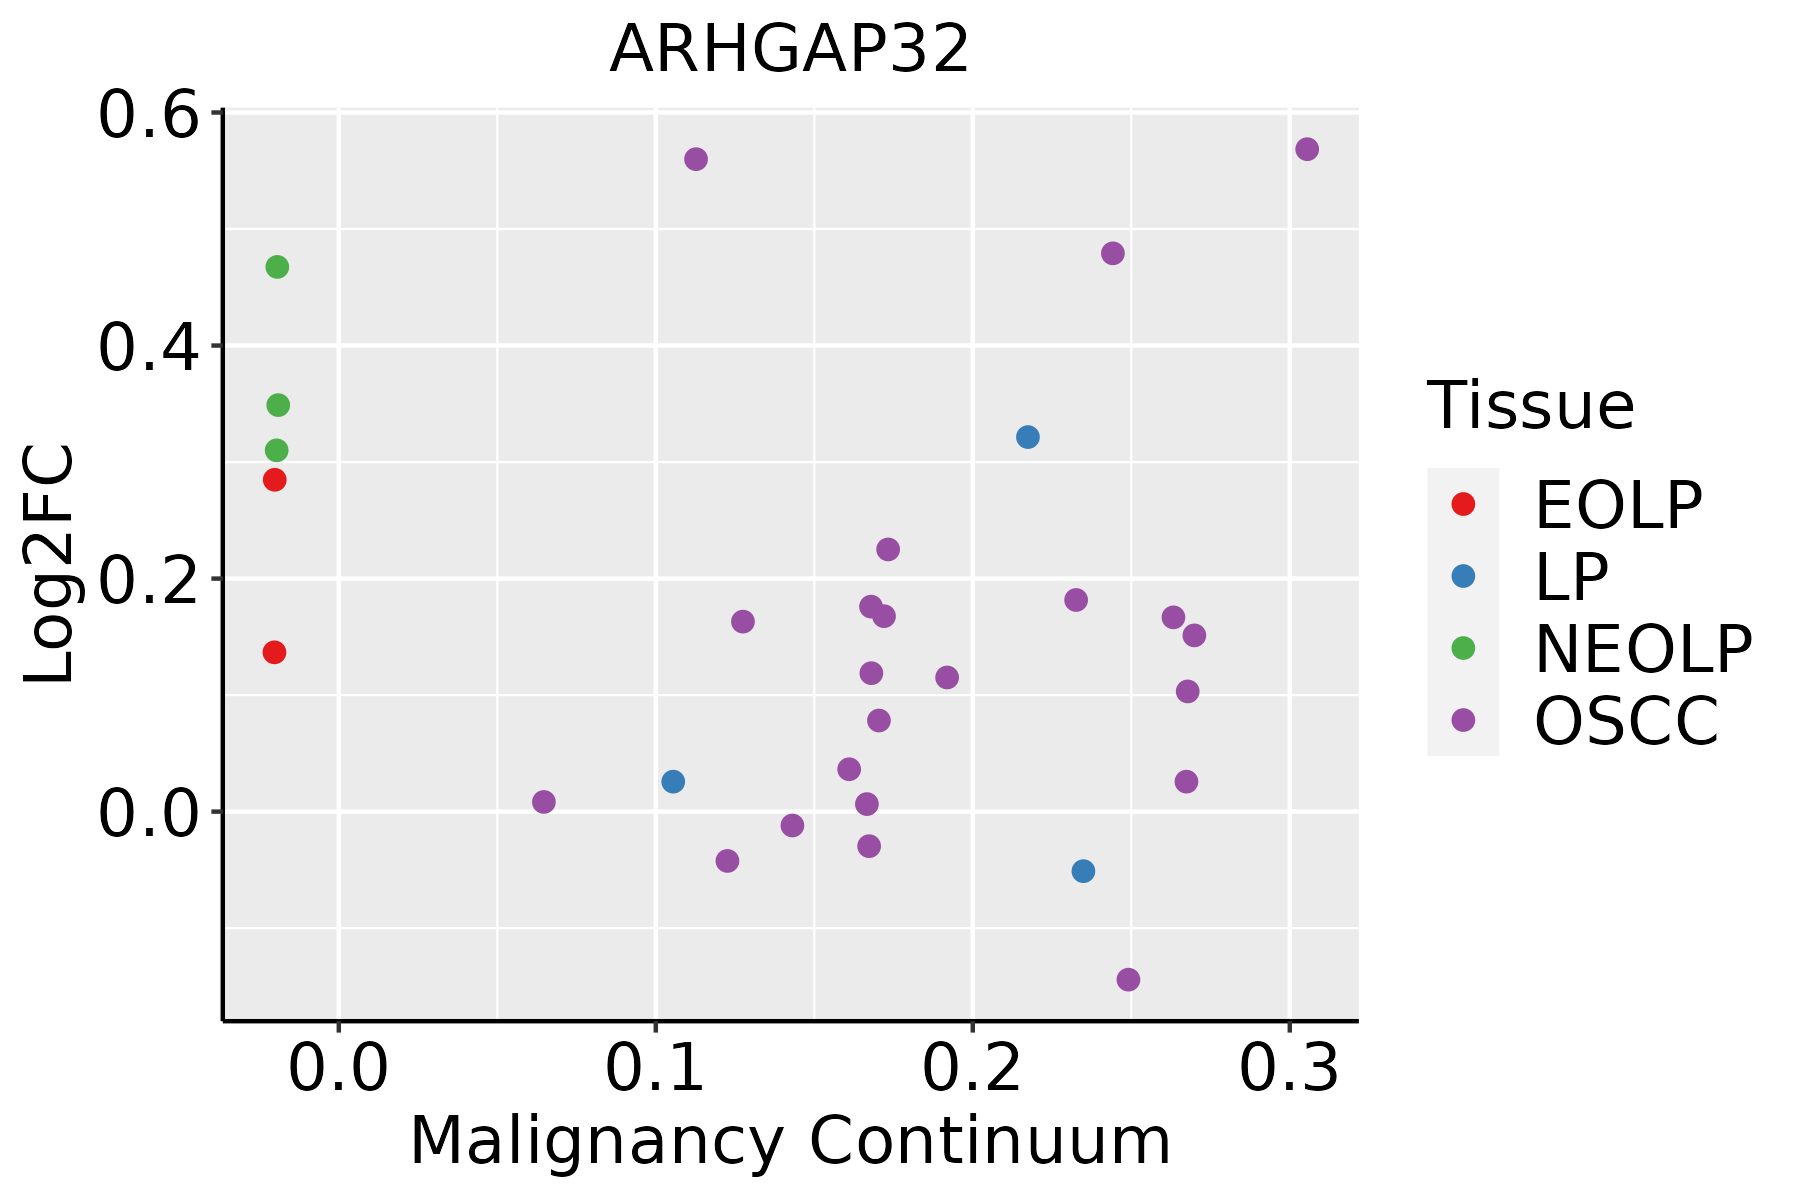 | EOLP: Erosive Oral lichen planus |
| LP: leukoplakia |
| NEOLP: Non-erosive oral lichen planus |
| OSCC: Oral squamous cell carcinoma |
| Prostate | 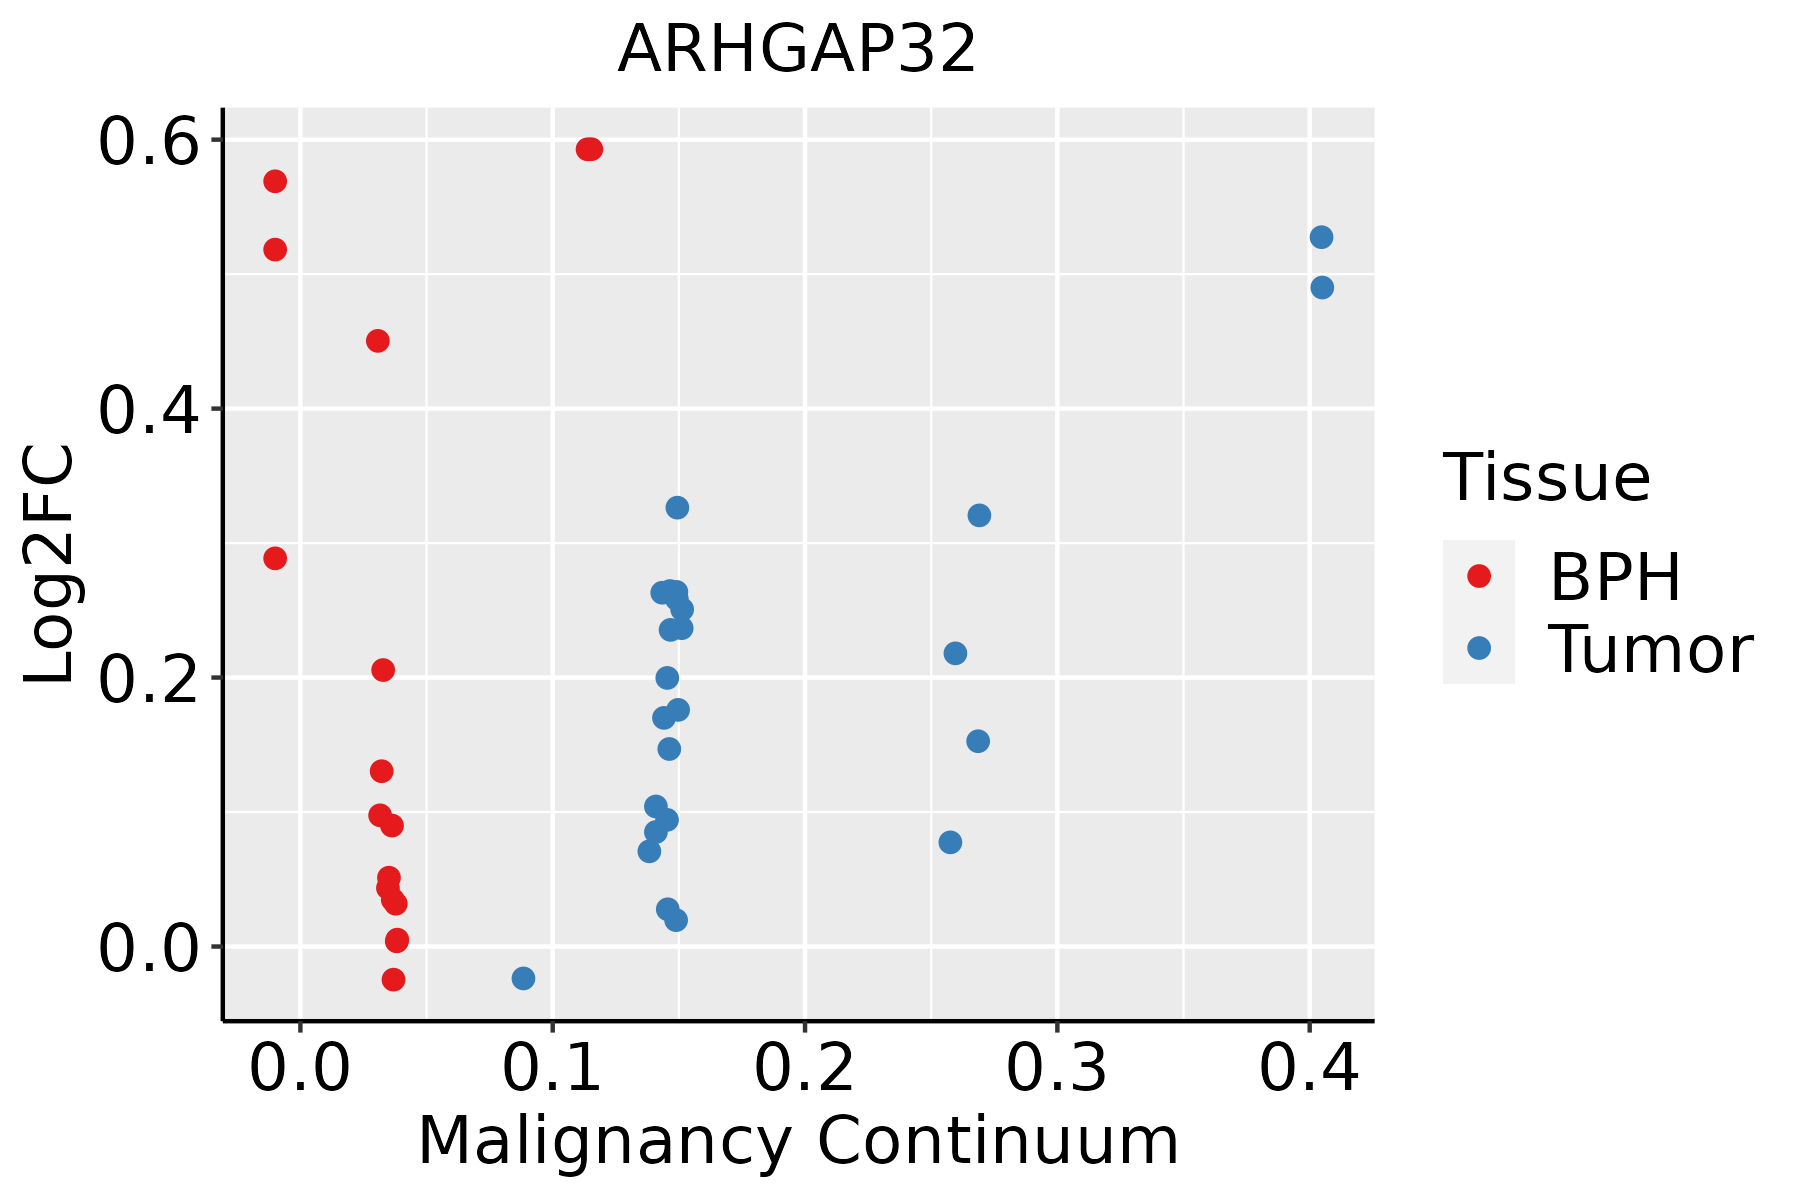 | BPH: Benign Prostatic Hyperplasia |
| Skin |  | AK: Actinic keratosis |
| cSCC: Cutaneous squamous cell carcinoma |
| SCCIS:squamous cell carcinoma in situ |
| GO ID | Tissue | Disease Stage | Description | Gene Ratio | Bg Ratio | pvalue | p.adjust | Count |
| GO:00510566 | Cervix | CC | regulation of small GTPase mediated signal transduction | 75/2311 | 302/18723 | 1.54e-09 | 1.74e-07 | 75 |
| GO:0051056 | Colorectum | AD | regulation of small GTPase mediated signal transduction | 94/3918 | 302/18723 | 1.81e-05 | 3.76e-04 | 94 |
| GO:00510561 | Colorectum | MSS | regulation of small GTPase mediated signal transduction | 82/3467 | 302/18723 | 1.31e-04 | 1.99e-03 | 82 |
| GO:00510562 | Colorectum | FAP | regulation of small GTPase mediated signal transduction | 78/2622 | 302/18723 | 3.25e-08 | 2.85e-06 | 78 |
| GO:00510563 | Colorectum | CRC | regulation of small GTPase mediated signal transduction | 69/2078 | 302/18723 | 3.34e-09 | 9.08e-07 | 69 |
| GO:00510567 | Endometrium | AEH | regulation of small GTPase mediated signal transduction | 59/2100 | 302/18723 | 1.43e-05 | 3.03e-04 | 59 |
| GO:005105612 | Endometrium | EEC | regulation of small GTPase mediated signal transduction | 61/2168 | 302/18723 | 9.42e-06 | 2.08e-04 | 61 |
| GO:005105610 | Esophagus | ESCC | regulation of small GTPase mediated signal transduction | 157/8552 | 302/18723 | 1.55e-02 | 4.98e-02 | 157 |
| GO:00510565 | Lung | IAC | regulation of small GTPase mediated signal transduction | 70/2061 | 302/18723 | 9.44e-10 | 1.87e-07 | 70 |
| GO:005105611 | Lung | AIS | regulation of small GTPase mediated signal transduction | 66/1849 | 302/18723 | 4.26e-10 | 9.53e-08 | 66 |
| GO:005105621 | Lung | MIAC | regulation of small GTPase mediated signal transduction | 35/967 | 302/18723 | 6.81e-06 | 6.35e-04 | 35 |
| GO:00510569 | Oral cavity | EOLP | regulation of small GTPase mediated signal transduction | 51/2218 | 302/18723 | 5.67e-03 | 2.92e-02 | 51 |
| GO:005105614 | Oral cavity | NEOLP | regulation of small GTPase mediated signal transduction | 49/2005 | 302/18723 | 2.04e-03 | 1.36e-02 | 49 |
| GO:00510568 | Prostate | BPH | regulation of small GTPase mediated signal transduction | 78/3107 | 302/18723 | 2.69e-05 | 3.16e-04 | 78 |
| GO:005105613 | Prostate | Tumor | regulation of small GTPase mediated signal transduction | 80/3246 | 302/18723 | 3.96e-05 | 4.57e-04 | 80 |
| GO:005105615 | Skin | AK | regulation of small GTPase mediated signal transduction | 48/1910 | 302/18723 | 1.28e-03 | 9.69e-03 | 48 |
| GO:005105616 | Skin | SCCIS | regulation of small GTPase mediated signal transduction | 33/919 | 302/18723 | 1.49e-05 | 4.86e-04 | 33 |
| Hugo Symbol | Variant Class | Variant Classification | dbSNP RS | HGVSc | HGVSp | HGVSp Short | SWISSPROT | BIOTYPE | SIFT | PolyPhen | Tumor Sample Barcode | Tissue | Histology | Sex | Age | Stage | Therapy Types | Drugs | Outcome |
| ARHGAP32 | SNV | Missense_Mutation | rs149060649 | c.2105N>A | p.Arg702His | p.R702H | A7KAX9 | protein_coding | deleterious(0) | possibly_damaging(0.657) | TCGA-AN-A0FF-01 | Breast | breast invasive carcinoma | Female | <65 | I/II | Unknown | Unknown | SD |
| ARHGAP32 | SNV | Missense_Mutation | | c.2382N>G | p.Asp794Glu | p.D794E | A7KAX9 | protein_coding | deleterious(0) | possibly_damaging(0.866) | TCGA-AO-A03T-01 | Breast | breast invasive carcinoma | Female | <65 | I/II | Chemotherapy | cyclophosphamide | SD |
| ARHGAP32 | SNV | Missense_Mutation | | c.2207N>G | p.Ser736Cys | p.S736C | A7KAX9 | protein_coding | deleterious(0.01) | benign(0.287) | TCGA-BH-A0HP-01 | Breast | breast invasive carcinoma | Female | >=65 | III/IV | Chemotherapy | doxorubicin | SD |
| ARHGAP32 | SNV | Missense_Mutation | rs749143928 | c.3131N>T | p.Ala1044Val | p.A1044V | A7KAX9 | protein_coding | deleterious_low_confidence(0) | probably_damaging(0.996) | TCGA-D8-A1Y1-01 | Breast | breast invasive carcinoma | Female | >=65 | III/IV | Hormone Therapy | tamoxiphen | PD |
| ARHGAP32 | SNV | Missense_Mutation | novel | c.1817N>T | p.Arg606Leu | p.R606L | A7KAX9 | protein_coding | deleterious(0) | probably_damaging(0.963) | TCGA-LL-A6FP-01 | Breast | breast invasive carcinoma | Female | >=65 | I/II | Hormone Therapy | arimidex | SD |
| ARHGAP32 | SNV | Missense_Mutation | novel | c.3792N>A | p.Met1264Ile | p.M1264I | A7KAX9 | protein_coding | deleterious_low_confidence(0.05) | benign(0) | TCGA-PE-A5DD-01 | Breast | breast invasive carcinoma | Female | <65 | I/II | Chemotherapy | | CR |
| ARHGAP32 | SNV | Missense_Mutation | rs746604429 | c.4765N>T | p.Pro1589Ser | p.P1589S | A7KAX9 | protein_coding | tolerated(0.08) | possibly_damaging(0.573) | TCGA-S3-AA15-01 | Breast | breast invasive carcinoma | Female | <65 | I/II | Chemotherapy | adriamycin | CR |
| ARHGAP32 | insertion | Nonsense_Mutation | novel | c.2785_2786insTCCTGTGTGCCATCTGTGCCTTTTAAGAGAGAAATTTGT | p.Thr929delinsIleLeuCysAlaIleCysAlaPheTerGluArgAsnLeuSer | p.T929delinsILCAICAF*ERNLS | A7KAX9 | protein_coding | | | TCGA-A2-A0CM-01 | Breast | breast invasive carcinoma | Female | <65 | I/II | Chemotherapy | adriamycin | PD |
| ARHGAP32 | insertion | Frame_Shift_Ins | novel | c.3911_3912insACACAACAAT | p.Pro1305HisfsTer33 | p.P1305Hfs*33 | A7KAX9 | protein_coding | | | TCGA-A7-A0CE-01 | Breast | breast invasive carcinoma | Female | <65 | I/II | Chemotherapy | adriamycin | SD |
| ARHGAP32 | insertion | Nonsense_Mutation | novel | c.3910_3911insTTTGAGTCA | p.Arg1304delinsLeuTerValSer | p.R1304delinsL*VS | A7KAX9 | protein_coding | | | TCGA-A7-A0CE-01 | Breast | breast invasive carcinoma | Female | <65 | I/II | Chemotherapy | adriamycin | SD |


