
|
|||||
|
 | |
| |
| |
| |
| |
| |
|
Gene: ARCN1 |
Gene summary for ARCN1 |
| Gene information | Species | Human | Gene symbol | ARCN1 | Gene ID | 372 |
| Gene name | archain 1 | |
| Gene Alias | COPD | |
| Cytomap | 11q23.3 | |
| Gene Type | protein-coding | GO ID | GO:0006810 | UniProtAcc | P48444 |
Top |
Malignant transformation analysis |
| Identification of the aberrant gene expression in precancerous and cancerous lesions by comparing the gene expression of stem-like cells in diseased tissues with normal stem cells |
| Entrez ID | Symbol | Replicates | Species | Organ | Tissue | Adj P-value | Log2FC | Malignancy |
| 372 | ARCN1 | P32T-E | Human | Esophagus | ESCC | 6.90e-17 | 4.87e-01 | 0.1666 |
| 372 | ARCN1 | P36T-E | Human | Esophagus | ESCC | 9.61e-11 | 2.22e-01 | 0.1187 |
| 372 | ARCN1 | P37T-E | Human | Esophagus | ESCC | 3.56e-14 | 3.94e-01 | 0.1371 |
| 372 | ARCN1 | P38T-E | Human | Esophagus | ESCC | 9.97e-06 | 2.68e-01 | 0.127 |
| 372 | ARCN1 | P39T-E | Human | Esophagus | ESCC | 7.82e-11 | 1.18e-01 | 0.0894 |
| 372 | ARCN1 | P40T-E | Human | Esophagus | ESCC | 8.40e-10 | 2.56e-01 | 0.109 |
| 372 | ARCN1 | P42T-E | Human | Esophagus | ESCC | 1.39e-12 | 3.24e-01 | 0.1175 |
| 372 | ARCN1 | P44T-E | Human | Esophagus | ESCC | 1.41e-06 | 2.67e-01 | 0.1096 |
| 372 | ARCN1 | P47T-E | Human | Esophagus | ESCC | 3.63e-13 | 2.95e-01 | 0.1067 |
| 372 | ARCN1 | P48T-E | Human | Esophagus | ESCC | 3.03e-10 | 6.53e-02 | 0.0959 |
| 372 | ARCN1 | P49T-E | Human | Esophagus | ESCC | 3.12e-15 | 1.39e+00 | 0.1768 |
| 372 | ARCN1 | P52T-E | Human | Esophagus | ESCC | 1.11e-06 | 1.72e-01 | 0.1555 |
| 372 | ARCN1 | P54T-E | Human | Esophagus | ESCC | 7.72e-12 | 2.24e-01 | 0.0975 |
| 372 | ARCN1 | P56T-E | Human | Esophagus | ESCC | 8.94e-03 | 6.37e-01 | 0.1613 |
| 372 | ARCN1 | P57T-E | Human | Esophagus | ESCC | 2.46e-19 | 2.79e-01 | 0.0926 |
| 372 | ARCN1 | P61T-E | Human | Esophagus | ESCC | 8.11e-14 | 1.34e-01 | 0.099 |
| 372 | ARCN1 | P62T-E | Human | Esophagus | ESCC | 4.30e-37 | 7.12e-01 | 0.1302 |
| 372 | ARCN1 | P65T-E | Human | Esophagus | ESCC | 6.76e-12 | 8.89e-02 | 0.0978 |
| 372 | ARCN1 | P74T-E | Human | Esophagus | ESCC | 3.83e-47 | 1.33e+00 | 0.1479 |
| 372 | ARCN1 | P75T-E | Human | Esophagus | ESCC | 1.15e-33 | 7.65e-01 | 0.1125 |
| Page: 1 2 3 4 5 6 |
| Tissue | Expression Dynamics | Abbreviation |
| Colorectum (GSE201348) |  | FAP: Familial adenomatous polyposis |
| CRC: Colorectal cancer | ||
| Colorectum (HTA11) |  | AD: Adenomas |
| SER: Sessile serrated lesions | ||
| MSI-H: Microsatellite-high colorectal cancer | ||
| MSS: Microsatellite stable colorectal cancer | ||
| Esophagus | 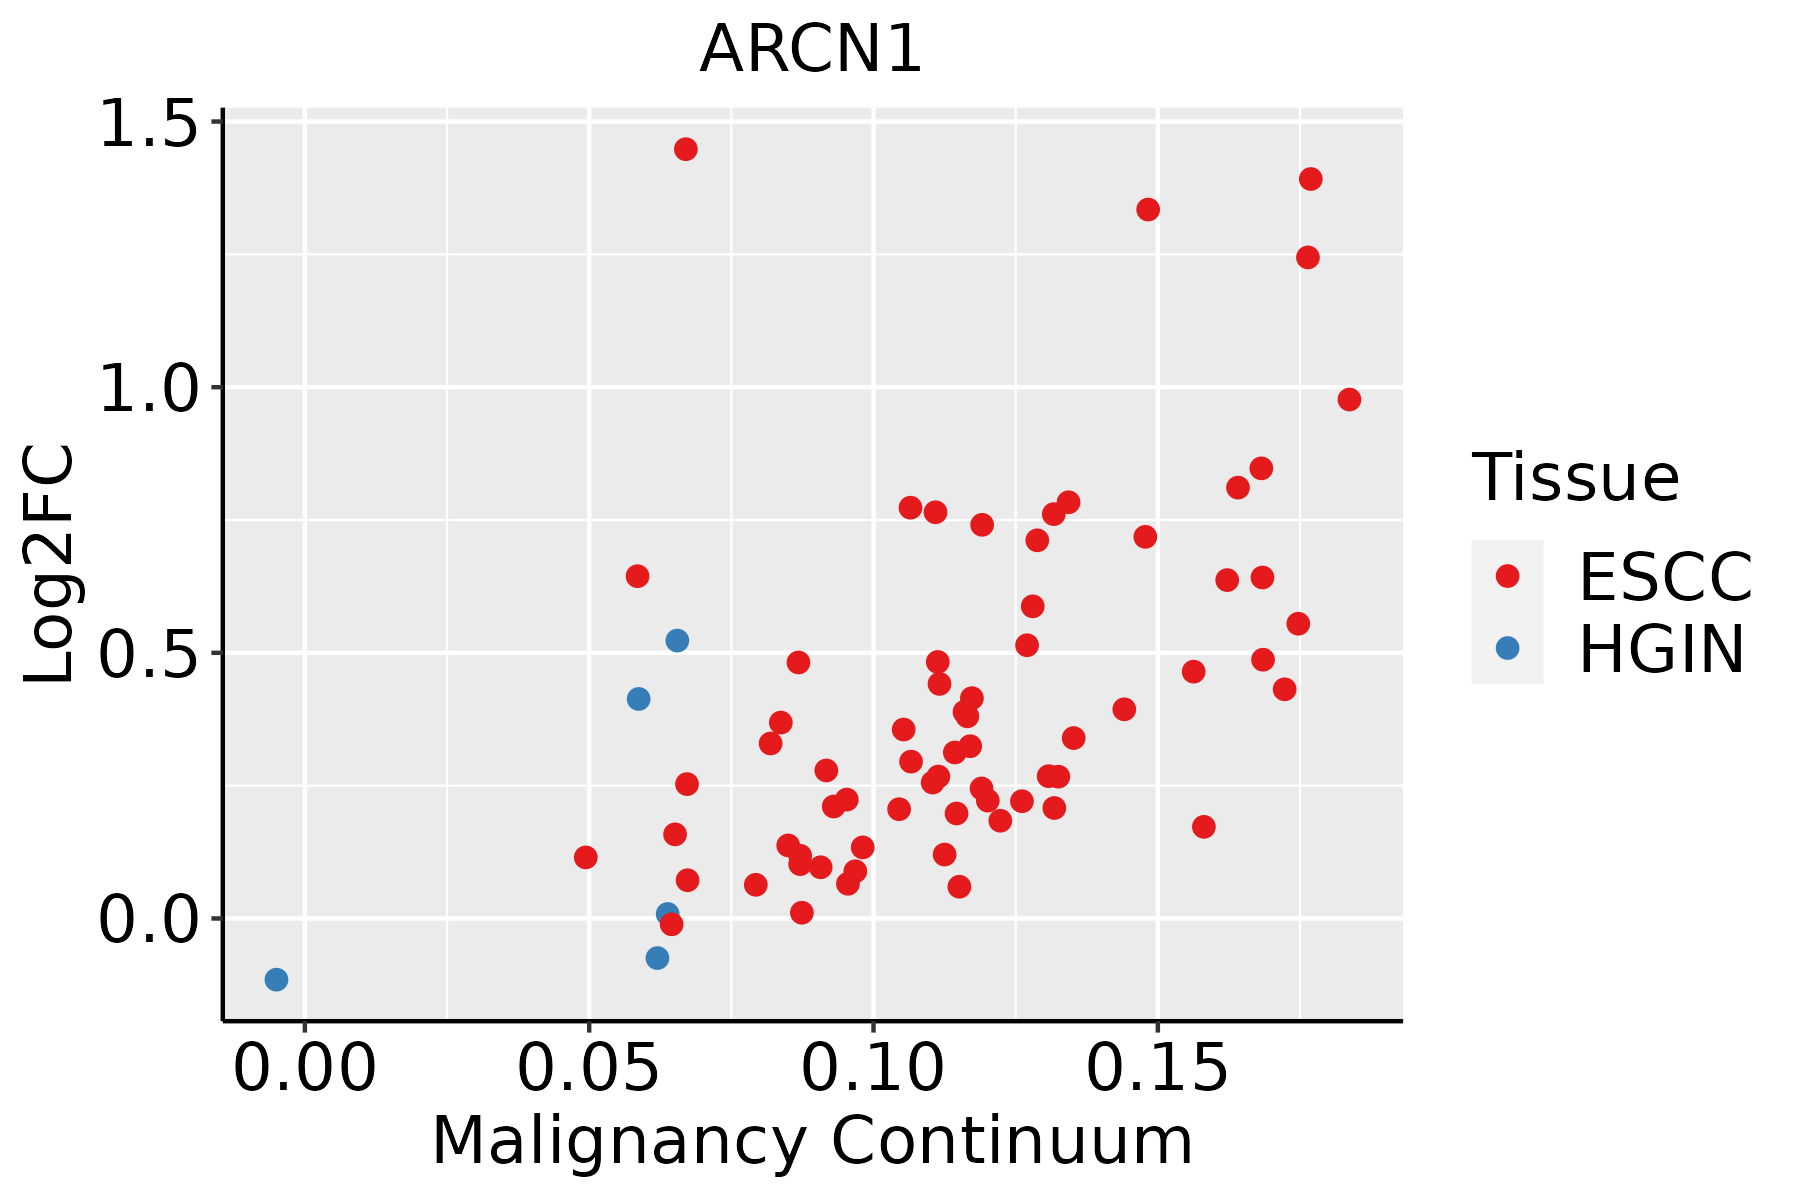 | ESCC: Esophageal squamous cell carcinoma |
| HGIN: High-grade intraepithelial neoplasias | ||
| LGIN: Low-grade intraepithelial neoplasias | ||
| Liver | 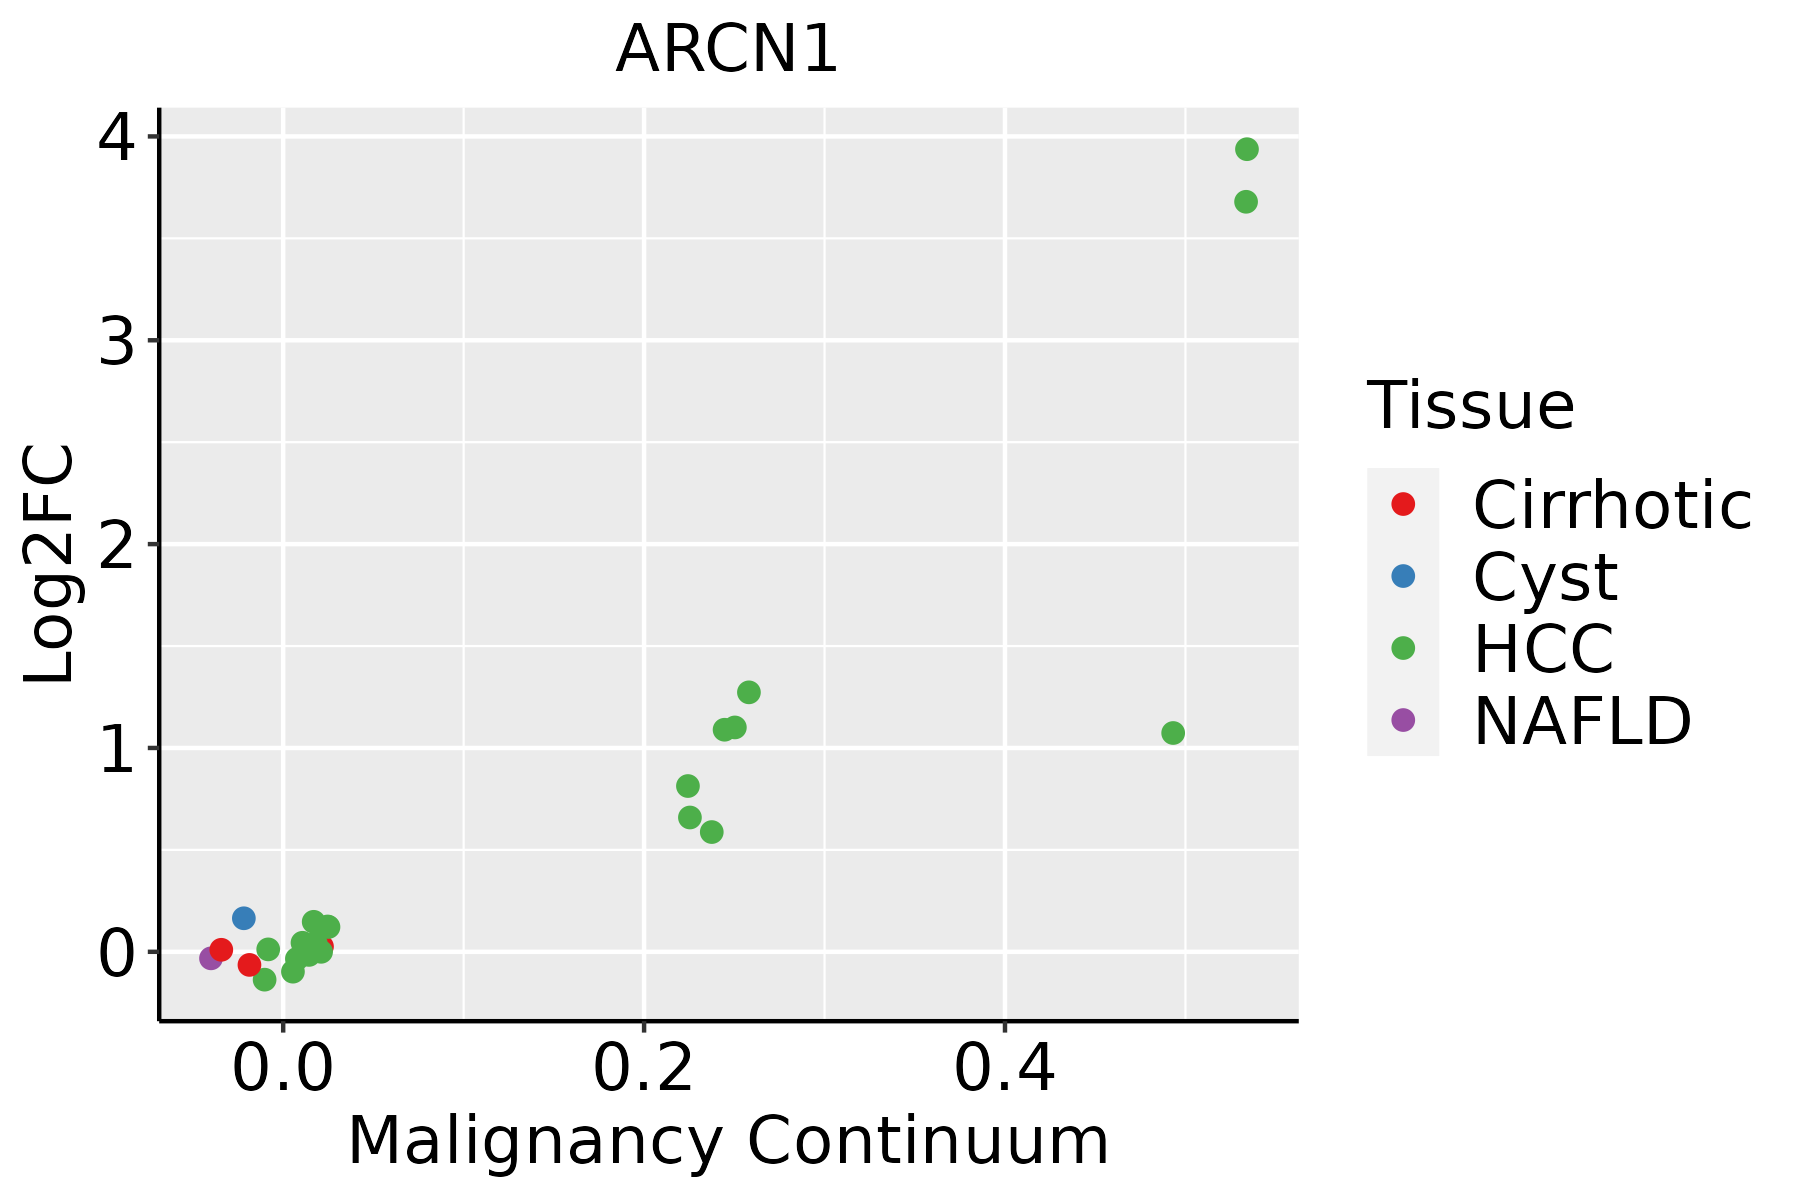 | HCC: Hepatocellular carcinoma |
| NAFLD: Non-alcoholic fatty liver disease | ||
| Oral Cavity | 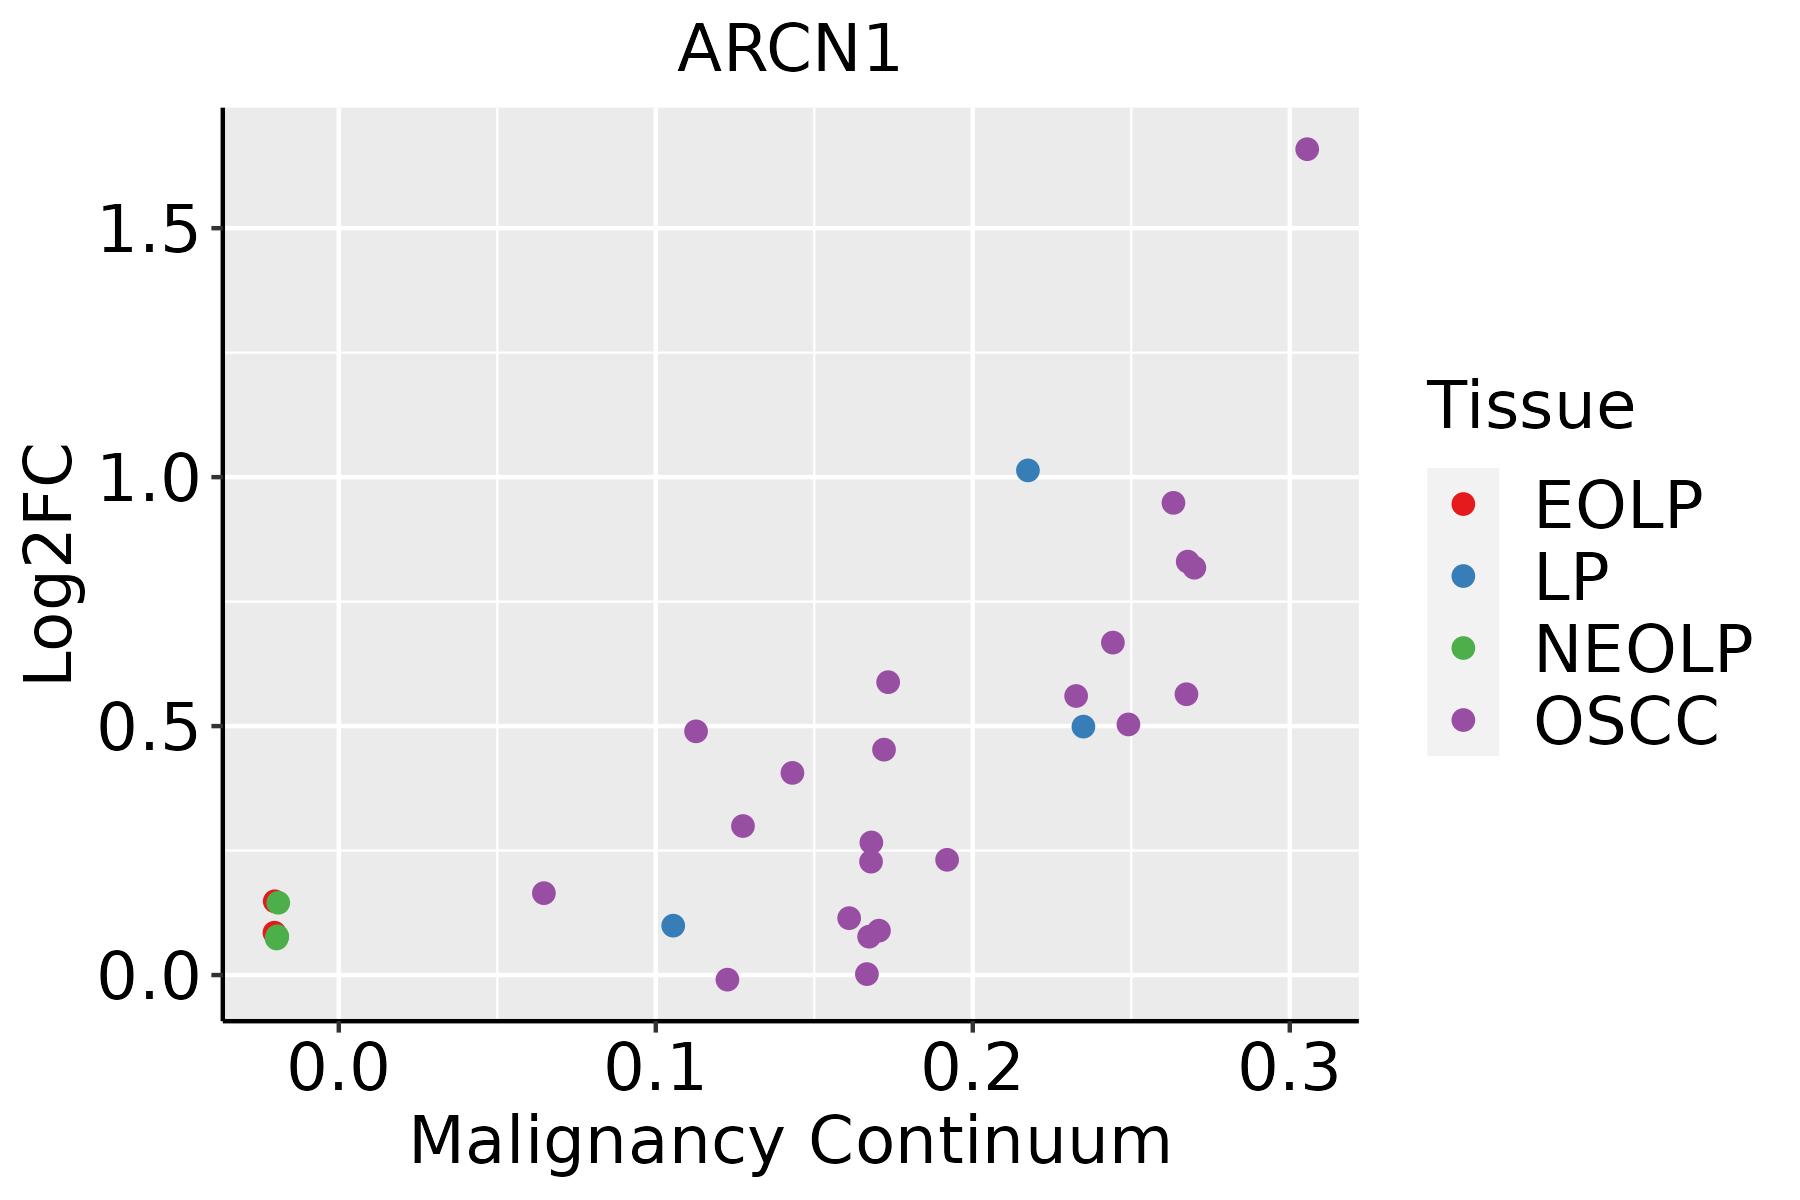 | EOLP: Erosive Oral lichen planus |
| LP: leukoplakia | ||
| NEOLP: Non-erosive oral lichen planus | ||
| OSCC: Oral squamous cell carcinoma | ||
| Prostate | 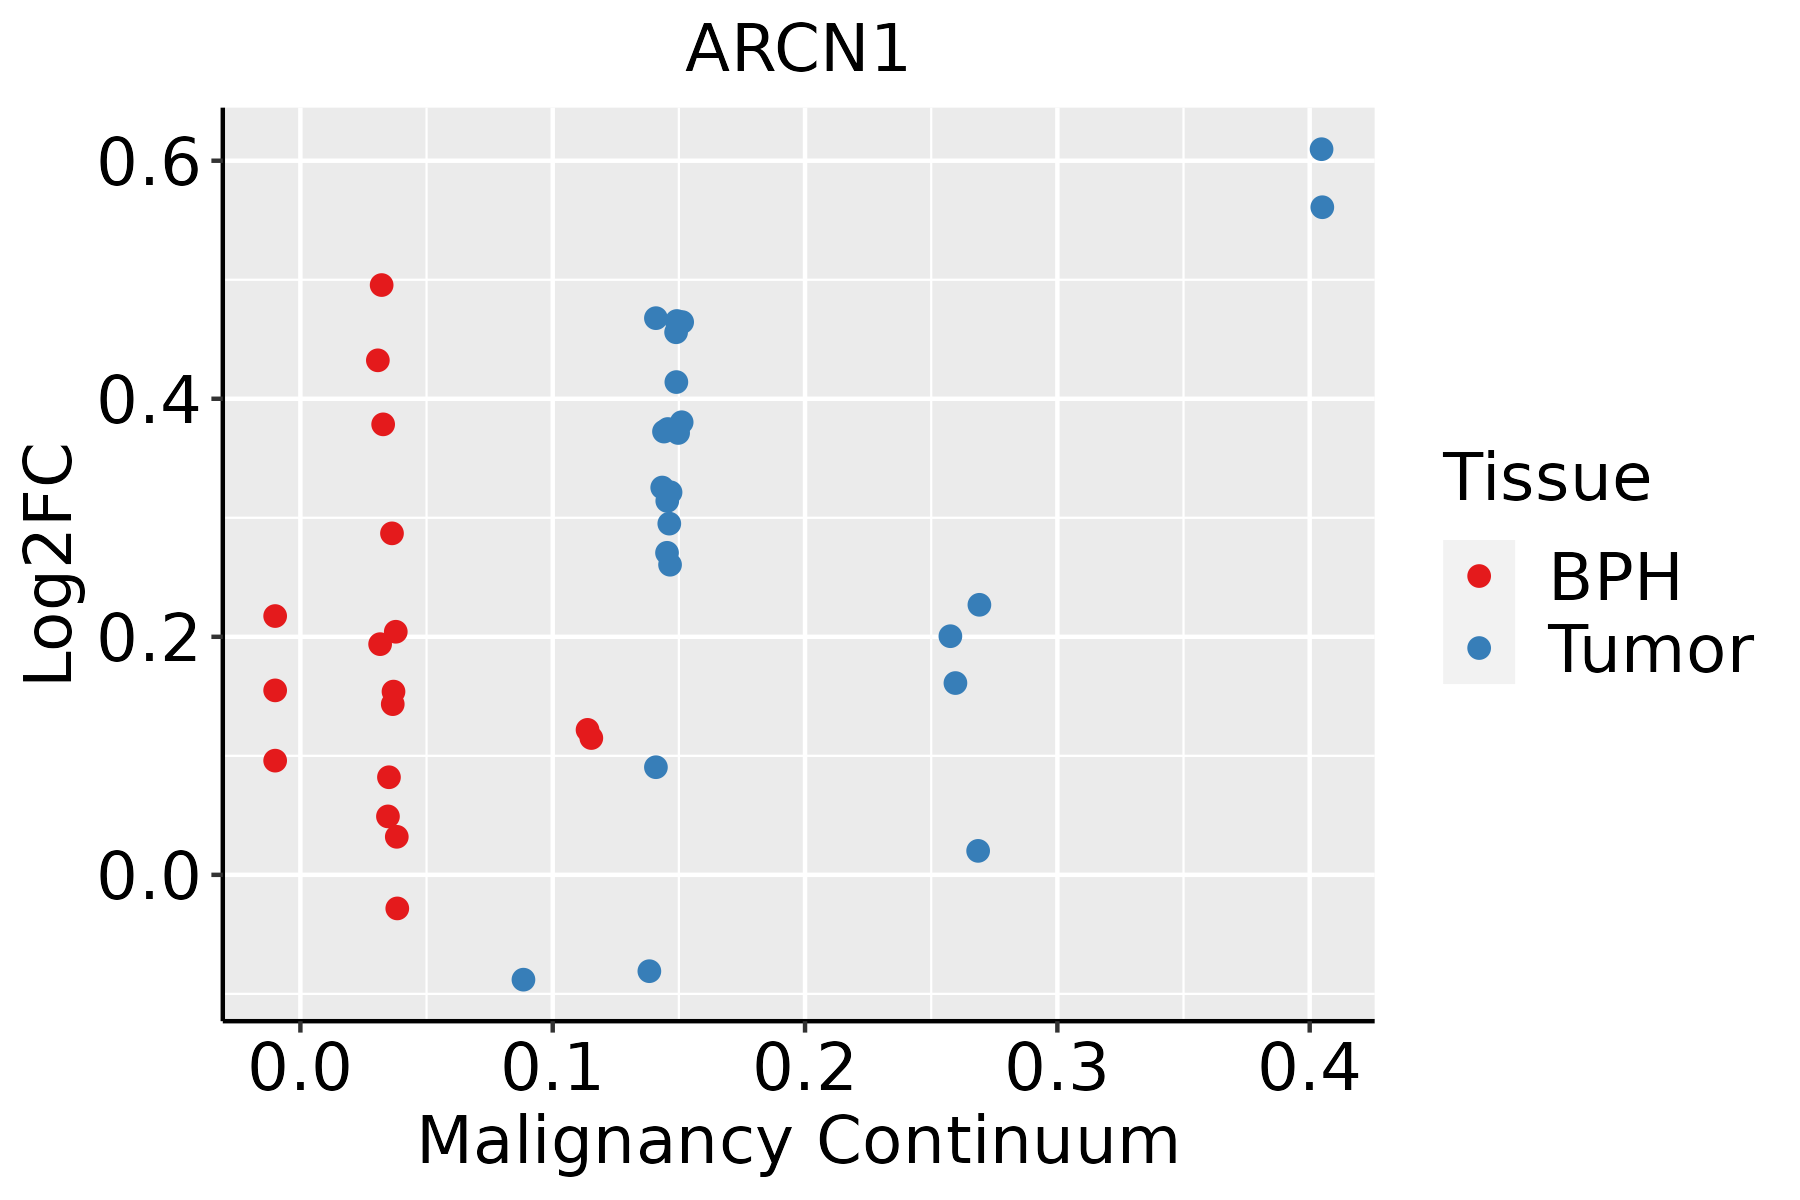 | BPH: Benign Prostatic Hyperplasia |
| Skin |  | AK: Actinic keratosis |
| cSCC: Cutaneous squamous cell carcinoma | ||
| SCCIS:squamous cell carcinoma in situ | ||
| Thyroid |  | ATC: Anaplastic thyroid cancer |
| HT: Hashimoto's thyroiditis | ||
| PTC: Papillary thyroid cancer |
| ∗log2FC in expression of this searched gene in stem-like cells from each diseased tissue sample relative to stem-like cells in normal samples in each tissue plotted against the malignancy continuum. Samples are colored based on if they are from different disease stage. |
Top |
Malignant transformation related pathway analysis |
| Find out the enriched GO biological processes and KEGG pathways involved in transition from healthy to precancer to cancer |
| Tissue | Disease Stage | Enriched GO biological Processes |
| Colorectum | AD |  |
| Colorectum | SER |  |
| Colorectum | MSS |  |
| Colorectum | MSI-H |  |
| Colorectum | FAP |  |
| ∗Top 15 enriched GO BP terms are showed in the bar plot of each disease state in each tissue. Each row represents a significant GO biological process which is colored according to the -log10(p.adjust). |
| Page: 1 2 3 4 5 6 7 8 9 |
| GO ID | Tissue | Disease Stage | Description | Gene Ratio | Bg Ratio | pvalue | p.adjust | Count |
| GO:0048193 | Colorectum | AD | Golgi vesicle transport | 109/3918 | 296/18723 | 1.80e-10 | 1.68e-08 | 109 |
| GO:0006890 | Colorectum | AD | retrograde vesicle-mediated transport, Golgi to endoplasmic reticulum | 27/3918 | 52/18723 | 7.67e-07 | 2.70e-05 | 27 |
| GO:0006888 | Colorectum | AD | endoplasmic reticulum to Golgi vesicle-mediated transport | 44/3918 | 130/18723 | 4.13e-04 | 4.68e-03 | 44 |
| GO:00481931 | Colorectum | SER | Golgi vesicle transport | 79/2897 | 296/18723 | 4.20e-07 | 2.15e-05 | 79 |
| GO:00068901 | Colorectum | SER | retrograde vesicle-mediated transport, Golgi to endoplasmic reticulum | 20/2897 | 52/18723 | 4.80e-05 | 1.18e-03 | 20 |
| GO:00068881 | Colorectum | SER | endoplasmic reticulum to Golgi vesicle-mediated transport | 34/2897 | 130/18723 | 1.13e-03 | 1.29e-02 | 34 |
| GO:00481932 | Colorectum | MSS | Golgi vesicle transport | 101/3467 | 296/18723 | 9.09e-11 | 9.77e-09 | 101 |
| GO:00068902 | Colorectum | MSS | retrograde vesicle-mediated transport, Golgi to endoplasmic reticulum | 26/3467 | 52/18723 | 2.66e-07 | 1.10e-05 | 26 |
| GO:00068882 | Colorectum | MSS | endoplasmic reticulum to Golgi vesicle-mediated transport | 44/3467 | 130/18723 | 2.17e-05 | 4.60e-04 | 44 |
| GO:0051645 | Colorectum | MSS | Golgi localization | 7/3467 | 14/18723 | 7.51e-03 | 4.72e-02 | 7 |
| GO:00068903 | Colorectum | MSI-H | retrograde vesicle-mediated transport, Golgi to endoplasmic reticulum | 13/1319 | 52/18723 | 4.72e-05 | 1.69e-03 | 13 |
| GO:00068883 | Colorectum | MSI-H | endoplasmic reticulum to Golgi vesicle-mediated transport | 22/1319 | 130/18723 | 1.05e-04 | 3.24e-03 | 22 |
| GO:00481933 | Colorectum | MSI-H | Golgi vesicle transport | 39/1319 | 296/18723 | 1.17e-04 | 3.51e-03 | 39 |
| GO:0008344 | Colorectum | MSI-H | adult locomotory behavior | 13/1319 | 71/18723 | 1.24e-03 | 2.00e-02 | 13 |
| GO:00481934 | Colorectum | FAP | Golgi vesicle transport | 77/2622 | 296/18723 | 2.86e-08 | 2.62e-06 | 77 |
| GO:00068904 | Colorectum | FAP | retrograde vesicle-mediated transport, Golgi to endoplasmic reticulum | 18/2622 | 52/18723 | 1.48e-04 | 2.29e-03 | 18 |
| GO:00516451 | Colorectum | FAP | Golgi localization | 7/2622 | 14/18723 | 1.45e-03 | 1.31e-02 | 7 |
| GO:0021700 | Colorectum | FAP | developmental maturation | 57/2622 | 280/18723 | 2.08e-03 | 1.72e-02 | 57 |
| GO:00068884 | Colorectum | FAP | endoplasmic reticulum to Golgi vesicle-mediated transport | 30/2622 | 130/18723 | 3.51e-03 | 2.53e-02 | 30 |
| GO:004819317 | Esophagus | HGIN | Golgi vesicle transport | 83/2587 | 296/18723 | 8.59e-11 | 8.89e-09 | 83 |
| Page: 1 2 3 |
| Pathway ID | Tissue | Disease Stage | Description | Gene Ratio | Bg Ratio | pvalue | p.adjust | qvalue | Count |
| Page: 1 |
Top |
Cell-cell communication analysis |
| Identification of potential cell-cell interactions between two cell types and their ligand-receptor pairs for different disease states |
| Ligand | Receptor | LRpair | Pathway | Tissue | Disease Stage |
| Page: 1 |
Top |
Single-cell gene regulatory network inference analysis |
| Find out the significant the regulons (TFs) and the target genes of each regulon across cell types for different disease states |
| TF | Cell Type | Tissue | Disease Stage | Target Gene | RSS | Regulon Activity |
| ∗The dot plots of a searched regulon are shown for all cell subpopulations in each disease state of each tissue based on the regulon specific score inferred using pySCENIC and by calculating the average expression. |
| Page: 1 |
Top |
Somatic mutation of malignant transformation related genes |
| Annotation of somatic variants for genes involved in malignant transformation |
| Hugo Symbol | Variant Class | Variant Classification | dbSNP RS | HGVSc | HGVSp | HGVSp Short | SWISSPROT | BIOTYPE | SIFT | PolyPhen | Tumor Sample Barcode | Tissue | Histology | Sex | Age | Stage | Therapy Types | Drugs | Outcome |
| ARCN1 | SNV | Missense_Mutation | novel | c.260C>T | p.Ser87Leu | p.S87L | P48444 | protein_coding | deleterious(0) | possibly_damaging(0.742) | TCGA-B6-A0I2-01 | Breast | breast invasive carcinoma | Female | <65 | I/II | Unknown | Unknown | SD |
| ARCN1 | SNV | Missense_Mutation | c.835N>A | p.Glu279Lys | p.E279K | P48444 | protein_coding | deleterious(0) | possibly_damaging(0.607) | TCGA-EA-A1QS-01 | Cervix | cervical & endocervical cancer | Female | <65 | I/II | Unknown | Unknown | SD | |
| ARCN1 | SNV | Missense_Mutation | c.843N>C | p.Lys281Asn | p.K281N | P48444 | protein_coding | deleterious(0) | probably_damaging(0.936) | TCGA-IR-A3LK-01 | Cervix | cervical & endocervical cancer | Female | >=65 | I/II | Chemotherapy | cisplatin | PD | |
| ARCN1 | SNV | Missense_Mutation | rs367554879 | c.77G>A | p.Arg26Gln | p.R26Q | P48444 | protein_coding | deleterious(0.01) | probably_damaging(0.991) | TCGA-VS-A94Z-01 | Cervix | cervical & endocervical cancer | Female | <65 | I/II | Chemotherapy | cisplatin | CR |
| ARCN1 | SNV | Missense_Mutation | novel | c.733G>C | p.Glu245Gln | p.E245Q | P48444 | protein_coding | tolerated(0.07) | benign(0.386) | TCGA-VS-A9UR-01 | Cervix | cervical & endocervical cancer | Female | <65 | I/II | Chemotherapy | cisplatin | PD |
| ARCN1 | insertion | In_Frame_Ins | novel | c.1106_1107insTGCTCA | p.Thr369_Glu370insAlaGln | p.T369_E370insAQ | P48444 | protein_coding | TCGA-DS-A1OC-01 | Cervix | cervical & endocervical cancer | Female | <65 | I/II | Chemotherapy | gemcitabine | SD | ||
| ARCN1 | SNV | Missense_Mutation | novel | c.220N>G | p.Ser74Gly | p.S74G | P48444 | protein_coding | deleterious(0) | probably_damaging(0.998) | TCGA-A6-2672-01 | Colorectum | colon adenocarcinoma | Female | >=65 | III/IV | Unknown | Unknown | SD |
| ARCN1 | SNV | Missense_Mutation | c.1198G>T | p.Asp400Tyr | p.D400Y | P48444 | protein_coding | deleterious(0.01) | benign(0.299) | TCGA-AA-3977-01 | Colorectum | colon adenocarcinoma | Male | >=65 | I/II | Unknown | Unknown | SD | |
| ARCN1 | SNV | Missense_Mutation | rs782690322 | c.479N>A | p.Arg160His | p.R160H | P48444 | protein_coding | deleterious(0.01) | benign(0.35) | TCGA-D5-6540-01 | Colorectum | colon adenocarcinoma | Male | >=65 | I/II | Unknown | Unknown | SD |
| ARCN1 | SNV | Missense_Mutation | novel | c.1309N>G | p.Thr437Ala | p.T437A | P48444 | protein_coding | tolerated(0.39) | benign(0.001) | TCGA-NH-A5IV-01 | Colorectum | colon adenocarcinoma | Female | >=65 | I/II | Unknown | Unknown | SD |
| Page: 1 2 3 4 |
Top |
Related drugs of malignant transformation related genes |
| Identification of chemicals and drugs interact with genes involved in malignant transfromation |
| (DGIdb 4.0) |
| Entrez ID | Symbol | Category | Interaction Types | Drug Claim Name | Drug Name | PMIDs |
| Page: 1 |

Copyright 2023-Present -The University of Texas Health Science Center at Houston |