
|
|||||
|
 | |
| |
| |
| |
| |
| |
|
Gene: APOOL |
Gene summary for APOOL |
| Gene information | Species | Human | Gene symbol | APOOL | Gene ID | 139322 |
| Gene name | apolipoprotein O like | |
| Gene Alias | CXorf33 | |
| Cytomap | Xq21.1 | |
| Gene Type | protein-coding | GO ID | GO:0006996 | UniProtAcc | Q6UXV4 |
Top |
Malignant transformation analysis |
| Identification of the aberrant gene expression in precancerous and cancerous lesions by comparing the gene expression of stem-like cells in diseased tissues with normal stem cells |
| Entrez ID | Symbol | Replicates | Species | Organ | Tissue | Adj P-value | Log2FC | Malignancy |
| 139322 | APOOL | P76T-E | Human | Esophagus | ESCC | 4.49e-08 | 1.76e-01 | 0.1207 |
| 139322 | APOOL | P79T-E | Human | Esophagus | ESCC | 5.02e-14 | 2.70e-01 | 0.1154 |
| 139322 | APOOL | P80T-E | Human | Esophagus | ESCC | 2.47e-23 | 4.61e-01 | 0.155 |
| 139322 | APOOL | P82T-E | Human | Esophagus | ESCC | 1.12e-04 | 3.14e-01 | 0.1072 |
| 139322 | APOOL | P83T-E | Human | Esophagus | ESCC | 5.27e-22 | 4.75e-01 | 0.1738 |
| 139322 | APOOL | P84T-E | Human | Esophagus | ESCC | 7.27e-03 | 1.61e-01 | 0.0933 |
| 139322 | APOOL | P89T-E | Human | Esophagus | ESCC | 3.92e-11 | 4.64e-01 | 0.1752 |
| 139322 | APOOL | P107T-E | Human | Esophagus | ESCC | 2.46e-28 | 5.73e-01 | 0.171 |
| 139322 | APOOL | P126T-E | Human | Esophagus | ESCC | 1.33e-03 | 3.57e-01 | 0.1125 |
| 139322 | APOOL | P127T-E | Human | Esophagus | ESCC | 4.99e-09 | 1.09e-01 | 0.0826 |
| 139322 | APOOL | P128T-E | Human | Esophagus | ESCC | 1.38e-07 | 2.63e-01 | 0.1241 |
| 139322 | APOOL | P130T-E | Human | Esophagus | ESCC | 2.30e-13 | 2.04e-01 | 0.1676 |
| 139322 | APOOL | HCC1_Meng | Human | Liver | HCC | 1.10e-53 | 3.22e-02 | 0.0246 |
| 139322 | APOOL | HCC2_Meng | Human | Liver | HCC | 9.05e-25 | 8.88e-02 | 0.0107 |
| 139322 | APOOL | HCC1 | Human | Liver | HCC | 2.07e-08 | 3.08e+00 | 0.5336 |
| 139322 | APOOL | HCC2 | Human | Liver | HCC | 6.20e-26 | 4.00e+00 | 0.5341 |
| 139322 | APOOL | HCC5 | Human | Liver | HCC | 3.58e-04 | 1.05e+00 | 0.4932 |
| 139322 | APOOL | S014 | Human | Liver | HCC | 3.83e-03 | 2.20e-01 | 0.2254 |
| 139322 | APOOL | S015 | Human | Liver | HCC | 8.21e-06 | 4.07e-01 | 0.2375 |
| 139322 | APOOL | S016 | Human | Liver | HCC | 2.63e-05 | 2.53e-01 | 0.2243 |
| Page: 1 2 3 4 |
| Tissue | Expression Dynamics | Abbreviation |
| Esophagus | 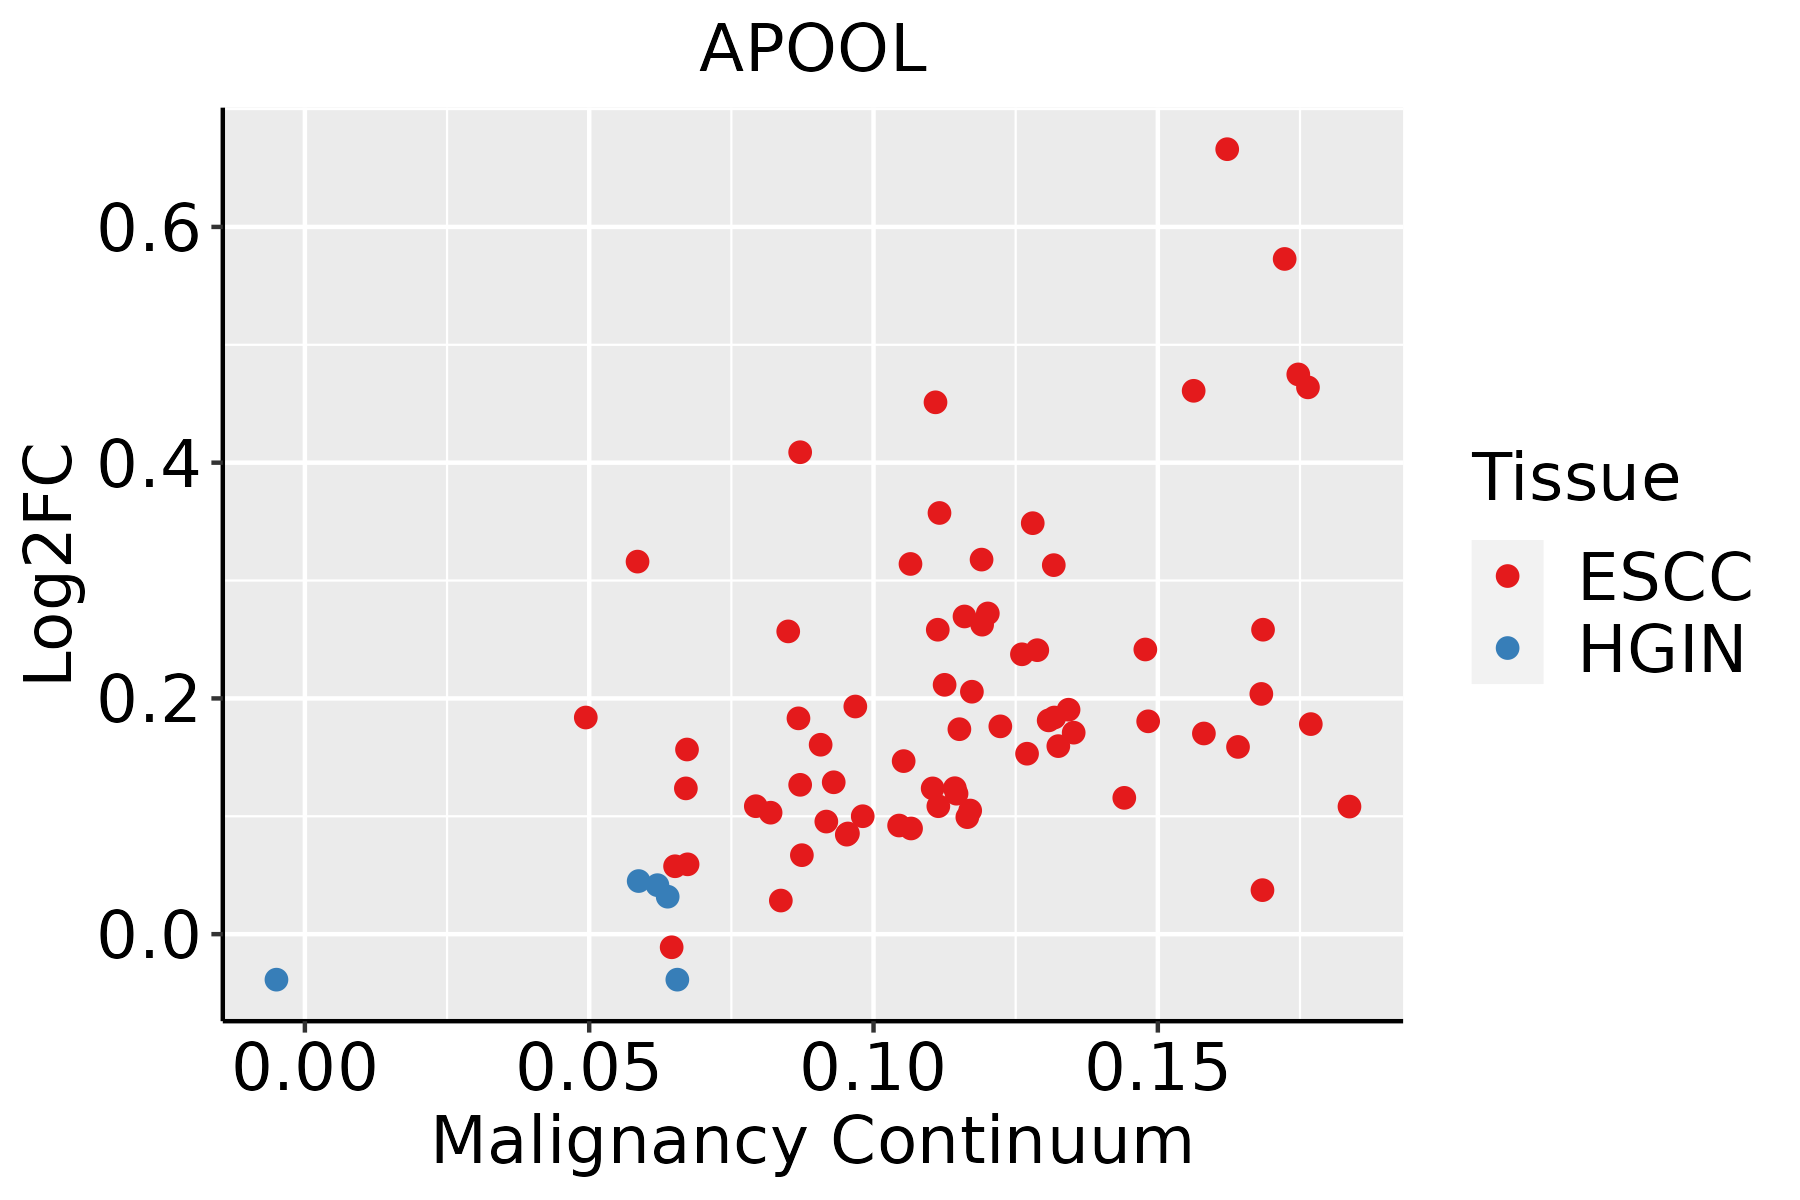 | ESCC: Esophageal squamous cell carcinoma |
| HGIN: High-grade intraepithelial neoplasias | ||
| LGIN: Low-grade intraepithelial neoplasias | ||
| Liver | 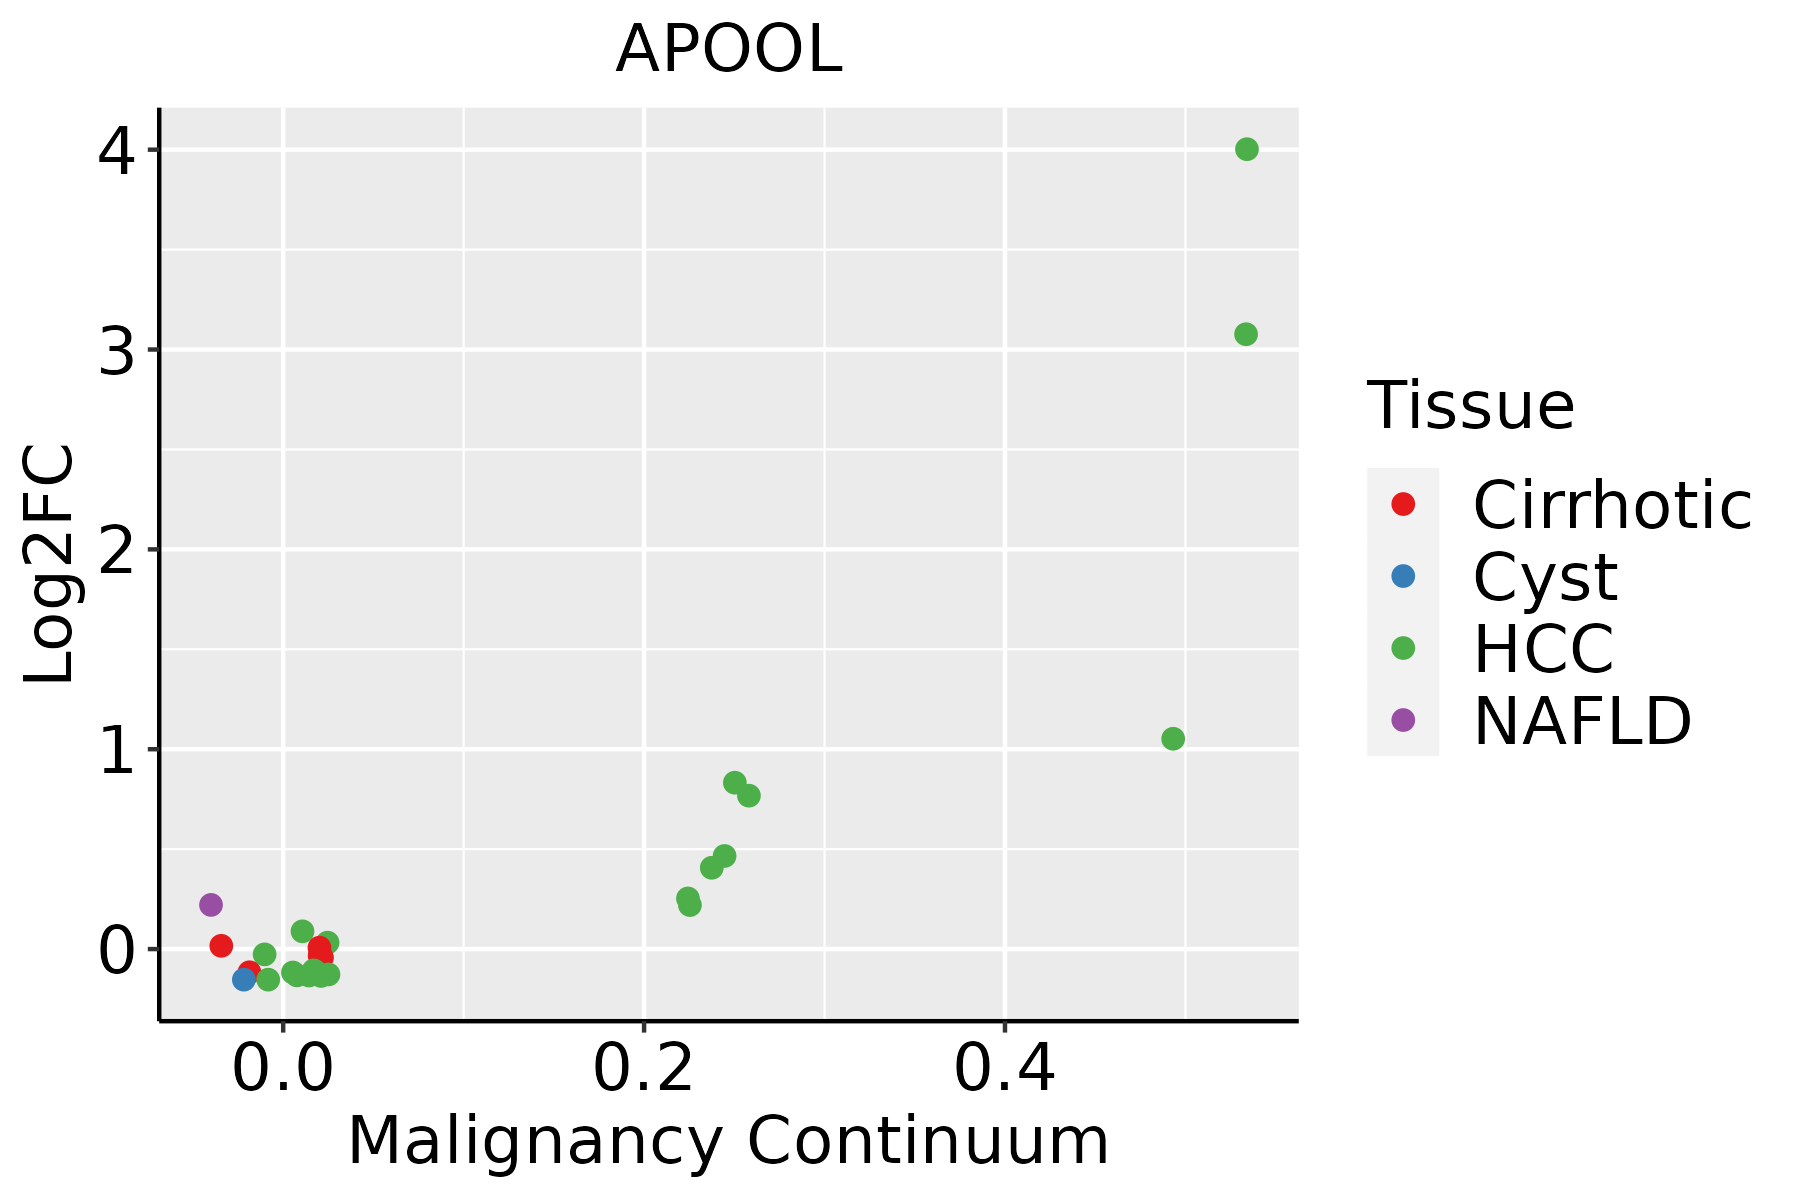 | HCC: Hepatocellular carcinoma |
| NAFLD: Non-alcoholic fatty liver disease | ||
| Oral Cavity |  | EOLP: Erosive Oral lichen planus |
| LP: leukoplakia | ||
| NEOLP: Non-erosive oral lichen planus | ||
| OSCC: Oral squamous cell carcinoma |
| ∗log2FC in expression of this searched gene in stem-like cells from each diseased tissue sample relative to stem-like cells in normal samples in each tissue plotted against the malignancy continuum. Samples are colored based on if they are from different disease stage. |
Top |
Malignant transformation related pathway analysis |
| Find out the enriched GO biological processes and KEGG pathways involved in transition from healthy to precancer to cancer |
| Tissue | Disease Stage | Enriched GO biological Processes |
| Colorectum | AD |  |
| Colorectum | SER |  |
| Colorectum | MSS |  |
| Colorectum | MSI-H |  |
| Colorectum | FAP |  |
| ∗Top 15 enriched GO BP terms are showed in the bar plot of each disease state in each tissue. Each row represents a significant GO biological process which is colored according to the -log10(p.adjust). |
| Page: 1 2 3 4 5 6 7 8 9 |
| GO ID | Tissue | Disease Stage | Description | Gene Ratio | Bg Ratio | pvalue | p.adjust | Count |
| GO:000700619 | Esophagus | ESCC | mitochondrial membrane organization | 93/8552 | 116/18723 | 2.16e-14 | 1.11e-12 | 93 |
| GO:000700713 | Esophagus | ESCC | inner mitochondrial membrane organization | 31/8552 | 38/18723 | 5.93e-06 | 6.10e-05 | 31 |
| GO:00424072 | Esophagus | ESCC | cristae formation | 13/8552 | 16/18723 | 4.05e-03 | 1.62e-02 | 13 |
| GO:000700612 | Liver | HCC | mitochondrial membrane organization | 80/7958 | 116/18723 | 7.09e-09 | 1.81e-07 | 80 |
| GO:000700711 | Liver | HCC | inner mitochondrial membrane organization | 28/7958 | 38/18723 | 9.60e-05 | 8.34e-04 | 28 |
| GO:0042407 | Liver | HCC | cristae formation | 12/7958 | 16/18723 | 8.74e-03 | 3.40e-02 | 12 |
| GO:000700610 | Oral cavity | OSCC | mitochondrial membrane organization | 85/7305 | 116/18723 | 6.29e-14 | 3.40e-12 | 85 |
| GO:00070075 | Oral cavity | OSCC | inner mitochondrial membrane organization | 27/7305 | 38/18723 | 6.23e-05 | 5.08e-04 | 27 |
| GO:00424071 | Oral cavity | OSCC | cristae formation | 12/7305 | 16/18723 | 3.83e-03 | 1.57e-02 | 12 |
| Page: 1 |
| Pathway ID | Tissue | Disease Stage | Description | Gene Ratio | Bg Ratio | pvalue | p.adjust | qvalue | Count |
| Page: 1 |
Top |
Cell-cell communication analysis |
| Identification of potential cell-cell interactions between two cell types and their ligand-receptor pairs for different disease states |
| Ligand | Receptor | LRpair | Pathway | Tissue | Disease Stage |
| Page: 1 |
Top |
Single-cell gene regulatory network inference analysis |
| Find out the significant the regulons (TFs) and the target genes of each regulon across cell types for different disease states |
| TF | Cell Type | Tissue | Disease Stage | Target Gene | RSS | Regulon Activity |
| ∗The dot plots of a searched regulon are shown for all cell subpopulations in each disease state of each tissue based on the regulon specific score inferred using pySCENIC and by calculating the average expression. |
| Page: 1 |
Top |
Somatic mutation of malignant transformation related genes |
| Annotation of somatic variants for genes involved in malignant transformation |
| Hugo Symbol | Variant Class | Variant Classification | dbSNP RS | HGVSc | HGVSp | HGVSp Short | SWISSPROT | BIOTYPE | SIFT | PolyPhen | Tumor Sample Barcode | Tissue | Histology | Sex | Age | Stage | Therapy Types | Drugs | Outcome |
| APOOL | SNV | Missense_Mutation | novel | c.76G>C | p.Ala26Pro | p.A26P | Q6UXV4 | protein_coding | deleterious(0) | possibly_damaging(0.725) | TCGA-A2-A1G6-01 | Breast | breast invasive carcinoma | Female | <65 | III/IV | Chemotherapy | adriamycin | SD |
| APOOL | SNV | Missense_Mutation | novel | c.293A>G | p.Lys98Arg | p.K98R | Q6UXV4 | protein_coding | deleterious(0.03) | probably_damaging(0.999) | TCGA-AN-A046-01 | Breast | breast invasive carcinoma | Female | >=65 | I/II | Unknown | Unknown | SD |
| APOOL | SNV | Missense_Mutation | c.608C>A | p.Ser203Tyr | p.S203Y | Q6UXV4 | protein_coding | deleterious(0.04) | benign(0.021) | TCGA-E2-A15C-01 | Breast | breast invasive carcinoma | Female | <65 | I/II | Hormone Therapy | arimidex | SD | |
| APOOL | SNV | Missense_Mutation | c.524N>A | p.Ile175Asn | p.I175N | Q6UXV4 | protein_coding | deleterious(0.05) | benign(0.255) | TCGA-E2-A1LS-01 | Breast | breast invasive carcinoma | Female | <65 | I/II | Unspecific | Cyclophosphamide | SD | |
| APOOL | SNV | Missense_Mutation | novel | c.790N>G | p.Tyr264Asp | p.Y264D | Q6UXV4 | protein_coding | deleterious(0.01) | benign(0.24) | TCGA-2W-A8YY-01 | Cervix | cervical & endocervical cancer | Female | <65 | I/II | Chemotherapy | cisplatin | CR |
| APOOL | SNV | Missense_Mutation | c.13N>G | p.Arg5Gly | p.R5G | Q6UXV4 | protein_coding | deleterious(0.01) | benign(0.037) | TCGA-AZ-4615-01 | Colorectum | colon adenocarcinoma | Male | >=65 | III/IV | Chemotherapy | xeloda | PD | |
| APOOL | SNV | Missense_Mutation | novel | c.56N>G | p.Ala19Gly | p.A19G | Q6UXV4 | protein_coding | deleterious(0) | possibly_damaging(0.628) | TCGA-AJ-A3TW-01 | Endometrium | uterine corpus endometrioid carcinoma | Female | >=65 | I/II | Unknown | Unknown | SD |
| APOOL | SNV | Missense_Mutation | c.800N>T | p.Arg267Ile | p.R267I | Q6UXV4 | protein_coding | deleterious(0) | possibly_damaging(0.669) | TCGA-AP-A0LM-01 | Endometrium | uterine corpus endometrioid carcinoma | Female | <65 | III/IV | Chemotherapy | cisplatin | SD | |
| APOOL | SNV | Missense_Mutation | novel | c.8N>T | p.Ala3Val | p.A3V | Q6UXV4 | protein_coding | deleterious(0.01) | benign(0.009) | TCGA-AP-A1DH-01 | Endometrium | uterine corpus endometrioid carcinoma | Female | <65 | I/II | Unknown | Unknown | SD |
| APOOL | SNV | Missense_Mutation | c.124C>T | p.Pro42Ser | p.P42S | Q6UXV4 | protein_coding | tolerated(0.27) | possibly_damaging(0.758) | TCGA-AP-A1DK-01 | Endometrium | uterine corpus endometrioid carcinoma | Female | <65 | I/II | Unknown | Unknown | SD |
| Page: 1 2 3 |
Top |
Related drugs of malignant transformation related genes |
| Identification of chemicals and drugs interact with genes involved in malignant transfromation |
| (DGIdb 4.0) |
| Entrez ID | Symbol | Category | Interaction Types | Drug Claim Name | Drug Name | PMIDs |
| Page: 1 |

Copyright 2023-Present -The University of Texas Health Science Center at Houston |