
|
|||||
|
 | |
| |
| |
| |
| |
| |
|
Gene: AP3M2 |
Gene summary for AP3M2 |
| Gene information | Species | Human | Gene symbol | AP3M2 | Gene ID | 10947 |
| Gene name | adaptor related protein complex 3 subunit mu 2 | |
| Gene Alias | AP47B | |
| Cytomap | 8p11.21 | |
| Gene Type | protein-coding | GO ID | GO:0006810 | UniProtAcc | P53677 |
Top |
Malignant transformation analysis |
| Identification of the aberrant gene expression in precancerous and cancerous lesions by comparing the gene expression of stem-like cells in diseased tissues with normal stem cells |
| Entrez ID | Symbol | Replicates | Species | Organ | Tissue | Adj P-value | Log2FC | Malignancy |
| 10947 | AP3M2 | P75T-E | Human | Esophagus | ESCC | 6.62e-20 | 3.98e-01 | 0.1125 |
| 10947 | AP3M2 | P76T-E | Human | Esophagus | ESCC | 1.88e-11 | 2.40e-01 | 0.1207 |
| 10947 | AP3M2 | P79T-E | Human | Esophagus | ESCC | 3.19e-23 | 3.91e-01 | 0.1154 |
| 10947 | AP3M2 | P80T-E | Human | Esophagus | ESCC | 5.51e-06 | 2.67e-01 | 0.155 |
| 10947 | AP3M2 | P83T-E | Human | Esophagus | ESCC | 1.34e-15 | 4.83e-01 | 0.1738 |
| 10947 | AP3M2 | P84T-E | Human | Esophagus | ESCC | 1.89e-02 | 2.53e-01 | 0.0933 |
| 10947 | AP3M2 | P89T-E | Human | Esophagus | ESCC | 1.51e-07 | 4.22e-01 | 0.1752 |
| 10947 | AP3M2 | P107T-E | Human | Esophagus | ESCC | 3.91e-21 | 4.83e-01 | 0.171 |
| 10947 | AP3M2 | P128T-E | Human | Esophagus | ESCC | 9.64e-05 | 1.78e-01 | 0.1241 |
| 10947 | AP3M2 | P130T-E | Human | Esophagus | ESCC | 4.17e-05 | 1.07e-01 | 0.1676 |
| 10947 | AP3M2 | HCC1_Meng | Human | Liver | HCC | 4.44e-11 | 5.45e-03 | 0.0246 |
| 10947 | AP3M2 | HCC2_Meng | Human | Liver | HCC | 1.50e-21 | 1.99e-01 | 0.0107 |
| 10947 | AP3M2 | HCC1 | Human | Liver | HCC | 4.89e-04 | 3.19e+00 | 0.5336 |
| 10947 | AP3M2 | HCC2 | Human | Liver | HCC | 4.75e-07 | 3.12e+00 | 0.5341 |
| 10947 | AP3M2 | S015 | Human | Liver | HCC | 4.45e-04 | 2.07e-01 | 0.2375 |
| Page: 1 2 3 |
| Tissue | Expression Dynamics | Abbreviation |
| Esophagus | 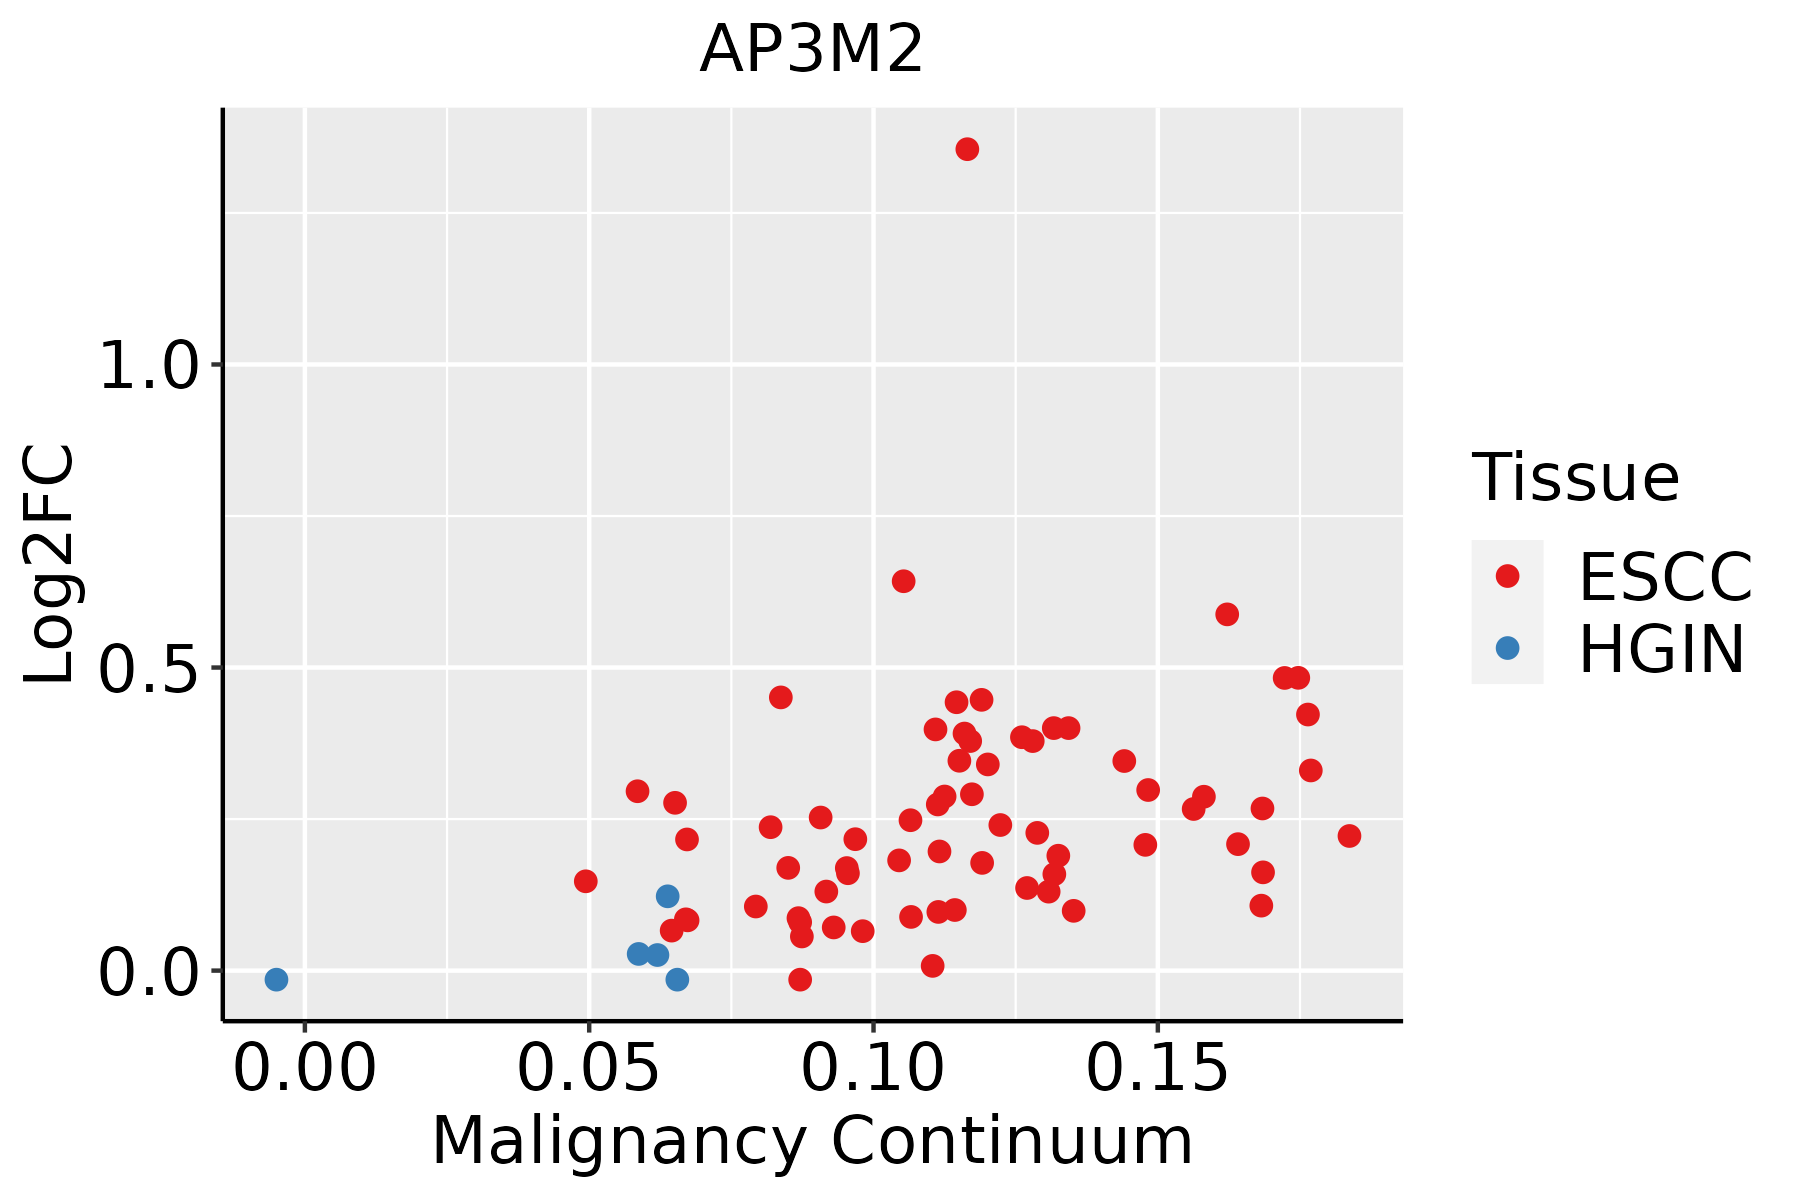 | ESCC: Esophageal squamous cell carcinoma |
| HGIN: High-grade intraepithelial neoplasias | ||
| LGIN: Low-grade intraepithelial neoplasias | ||
| Liver | 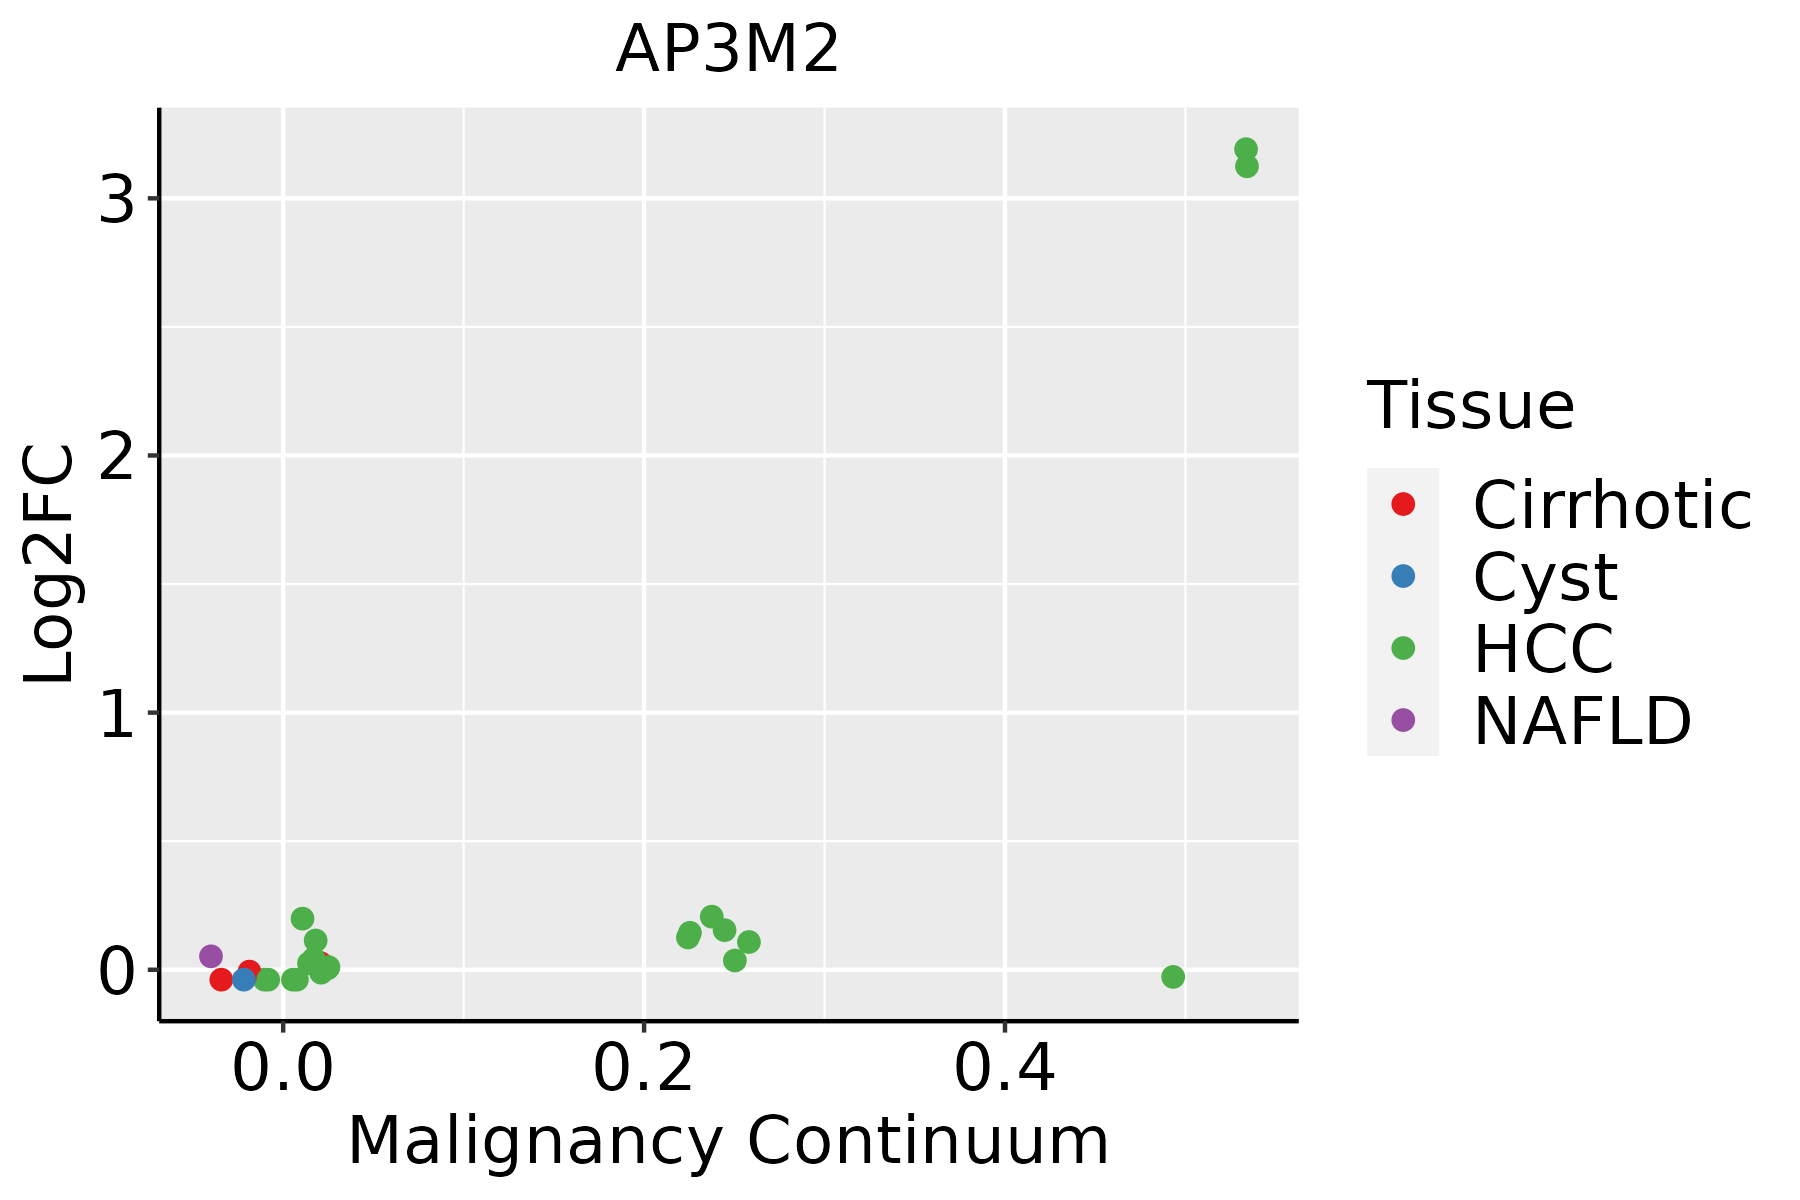 | HCC: Hepatocellular carcinoma |
| NAFLD: Non-alcoholic fatty liver disease |
| ∗log2FC in expression of this searched gene in stem-like cells from each diseased tissue sample relative to stem-like cells in normal samples in each tissue plotted against the malignancy continuum. Samples are colored based on if they are from different disease stage. |
Top |
Malignant transformation related pathway analysis |
| Find out the enriched GO biological processes and KEGG pathways involved in transition from healthy to precancer to cancer |
| Tissue | Disease Stage | Enriched GO biological Processes |
| Colorectum | AD |  |
| Colorectum | SER |  |
| Colorectum | MSS |  |
| Colorectum | MSI-H |  |
| Colorectum | FAP |  |
| ∗Top 15 enriched GO BP terms are showed in the bar plot of each disease state in each tissue. Each row represents a significant GO biological process which is colored according to the -log10(p.adjust). |
| Page: 1 2 3 4 5 6 7 8 9 |
| GO ID | Tissue | Disease Stage | Description | Gene Ratio | Bg Ratio | pvalue | p.adjust | Count |
| GO:005165617 | Esophagus | ESCC | establishment of organelle localization | 273/8552 | 390/18723 | 9.13e-23 | 1.81e-20 | 273 |
| GO:005165016 | Esophagus | ESCC | establishment of vesicle localization | 114/8552 | 161/18723 | 8.20e-11 | 2.53e-09 | 114 |
| GO:003070518 | Esophagus | ESCC | cytoskeleton-dependent intracellular transport | 133/8552 | 195/18723 | 1.48e-10 | 4.27e-09 | 133 |
| GO:001097013 | Esophagus | ESCC | transport along microtubule | 107/8552 | 155/18723 | 3.17e-09 | 6.80e-08 | 107 |
| GO:005164815 | Esophagus | ESCC | vesicle localization | 119/8552 | 177/18723 | 5.16e-09 | 1.08e-07 | 119 |
| GO:00723846 | Esophagus | ESCC | organelle transport along microtubule | 65/8552 | 85/18723 | 6.61e-09 | 1.35e-07 | 65 |
| GO:000808810 | Esophagus | ESCC | axo-dendritic transport | 58/8552 | 75/18723 | 2.09e-08 | 4.02e-07 | 58 |
| GO:00989304 | Esophagus | ESCC | axonal transport | 49/8552 | 64/18723 | 4.54e-07 | 6.15e-06 | 49 |
| GO:00474962 | Esophagus | ESCC | vesicle transport along microtubule | 36/8552 | 47/18723 | 1.53e-05 | 1.38e-04 | 36 |
| GO:00991114 | Esophagus | ESCC | microtubule-based transport | 115/8552 | 190/18723 | 2.54e-05 | 2.15e-04 | 115 |
| GO:00080892 | Esophagus | ESCC | anterograde axonal transport | 37/8552 | 50/18723 | 4.42e-05 | 3.51e-04 | 37 |
| GO:00995185 | Esophagus | ESCC | vesicle cytoskeletal trafficking | 50/8552 | 73/18723 | 6.75e-05 | 5.12e-04 | 50 |
| GO:00484901 | Esophagus | ESCC | anterograde synaptic vesicle transport | 15/8552 | 19/18723 | 3.29e-03 | 1.35e-02 | 15 |
| GO:00995141 | Esophagus | ESCC | synaptic vesicle cytoskeletal transport | 15/8552 | 19/18723 | 3.29e-03 | 1.35e-02 | 15 |
| GO:00995171 | Esophagus | ESCC | synaptic vesicle transport along microtubule | 15/8552 | 19/18723 | 3.29e-03 | 1.35e-02 | 15 |
| GO:00484892 | Esophagus | ESCC | synaptic vesicle transport | 28/8552 | 42/18723 | 4.90e-03 | 1.89e-02 | 28 |
| GO:005165621 | Liver | HCC | establishment of organelle localization | 226/7958 | 390/18723 | 4.15e-10 | 1.34e-08 | 226 |
| GO:005165021 | Liver | HCC | establishment of vesicle localization | 103/7958 | 161/18723 | 2.94e-08 | 6.69e-07 | 103 |
| GO:005164821 | Liver | HCC | vesicle localization | 107/7958 | 177/18723 | 1.05e-06 | 1.57e-05 | 107 |
| GO:00080882 | Liver | HCC | axo-dendritic transport | 52/7958 | 75/18723 | 2.34e-06 | 3.14e-05 | 52 |
| Page: 1 2 |
| Pathway ID | Tissue | Disease Stage | Description | Gene Ratio | Bg Ratio | pvalue | p.adjust | qvalue | Count |
| hsa0414222 | Esophagus | ESCC | Lysosome | 102/4205 | 132/8465 | 5.11e-11 | 7.13e-10 | 3.65e-10 | 102 |
| hsa0414232 | Esophagus | ESCC | Lysosome | 102/4205 | 132/8465 | 5.11e-11 | 7.13e-10 | 3.65e-10 | 102 |
| hsa041422 | Liver | HCC | Lysosome | 100/4020 | 132/8465 | 2.32e-11 | 4.31e-10 | 2.40e-10 | 100 |
| hsa041423 | Liver | HCC | Lysosome | 100/4020 | 132/8465 | 2.32e-11 | 4.31e-10 | 2.40e-10 | 100 |
| Page: 1 |
Top |
Cell-cell communication analysis |
| Identification of potential cell-cell interactions between two cell types and their ligand-receptor pairs for different disease states |
| Ligand | Receptor | LRpair | Pathway | Tissue | Disease Stage |
| Page: 1 |
Top |
Single-cell gene regulatory network inference analysis |
| Find out the significant the regulons (TFs) and the target genes of each regulon across cell types for different disease states |
| TF | Cell Type | Tissue | Disease Stage | Target Gene | RSS | Regulon Activity |
| ∗The dot plots of a searched regulon are shown for all cell subpopulations in each disease state of each tissue based on the regulon specific score inferred using pySCENIC and by calculating the average expression. |
| Page: 1 |
Top |
Somatic mutation of malignant transformation related genes |
| Annotation of somatic variants for genes involved in malignant transformation |
| Hugo Symbol | Variant Class | Variant Classification | dbSNP RS | HGVSc | HGVSp | HGVSp Short | SWISSPROT | BIOTYPE | SIFT | PolyPhen | Tumor Sample Barcode | Tissue | Histology | Sex | Age | Stage | Therapy Types | Drugs | Outcome |
| AP3M2 | SNV | Missense_Mutation | c.73A>G | p.Ser25Gly | p.S25G | P53677 | protein_coding | tolerated(0.33) | benign(0.049) | TCGA-A8-A07L-01 | Breast | breast invasive carcinoma | Female | <65 | III/IV | Chemotherapy | CR | ||
| AP3M2 | SNV | Missense_Mutation | novel | c.1184N>G | p.Tyr395Cys | p.Y395C | P53677 | protein_coding | deleterious(0.01) | probably_damaging(0.992) | TCGA-D8-A73X-01 | Breast | breast invasive carcinoma | Female | <65 | I/II | Hormone Therapy | tamoxiphen | SD |
| AP3M2 | insertion | Nonsense_Mutation | novel | c.265_266insTTTGATGCTCAATCCCACTTCCATGTATGAAAAAATACGGTC | p.Thr89delinsIleTerCysSerIleProLeuProCysMetLysLysTyrGlyPro | p.T89delinsI*CSIPLPCMKKYGP | P53677 | protein_coding | TCGA-A8-A07R-01 | Breast | breast invasive carcinoma | Female | >=65 | III/IV | Ancillary | zoledronic | SD | ||
| AP3M2 | insertion | Frame_Shift_Ins | novel | c.255_256insTCTGCCCGCGGAGGCCTCCCTAAGTACTGGGATCACAGGC | p.Val86SerfsTer39 | p.V86Sfs*39 | P53677 | protein_coding | TCGA-A8-A08H-01 | Breast | breast invasive carcinoma | Female | >=65 | I/II | Unknown | Unknown | SD | ||
| AP3M2 | insertion | Frame_Shift_Ins | novel | c.174_175insCTCGCTG | p.Val59LeufsTer25 | p.V59Lfs*25 | P53677 | protein_coding | TCGA-E9-A1NC-01 | Breast | breast invasive carcinoma | Female | <65 | I/II | Chemotherapy | doxorubicin | CR | ||
| AP3M2 | insertion | Nonsense_Mutation | novel | c.176_177insCCCATAGTGGCTATCGTATTAAGCTGCGCA | p.Val59_Tyr60insProTerTrpLeuSerTyrTerAlaAlaHis | p.V59_Y60insP*WLSY*AAH | P53677 | protein_coding | TCGA-E9-A1NC-01 | Breast | breast invasive carcinoma | Female | <65 | I/II | Chemotherapy | doxorubicin | CR | ||
| AP3M2 | SNV | Missense_Mutation | rs151272027 | c.722G>A | p.Arg241His | p.R241H | P53677 | protein_coding | deleterious(0) | probably_damaging(0.949) | TCGA-A6-2686-01 | Colorectum | colon adenocarcinoma | Female | >=65 | I/II | Unknown | Unknown | SD |
| AP3M2 | SNV | Missense_Mutation | rs151272027 | c.722N>A | p.Arg241His | p.R241H | P53677 | protein_coding | deleterious(0) | probably_damaging(0.949) | TCGA-A6-5665-01 | Colorectum | colon adenocarcinoma | Female | >=65 | I/II | Unknown | Unknown | PD |
| AP3M2 | SNV | Missense_Mutation | c.32C>T | p.Ser11Phe | p.S11F | P53677 | protein_coding | deleterious(0) | possibly_damaging(0.707) | TCGA-AA-3712-01 | Colorectum | colon adenocarcinoma | Male | >=65 | III/IV | Unknown | Unknown | SD | |
| AP3M2 | SNV | Missense_Mutation | novel | c.712N>T | p.Arg238Cys | p.R238C | P53677 | protein_coding | deleterious(0) | probably_damaging(1) | TCGA-AA-3984-01 | Colorectum | colon adenocarcinoma | Female | <65 | I/II | Unknown | Unknown | SD |
| Page: 1 2 3 4 5 6 |
Top |
Related drugs of malignant transformation related genes |
| Identification of chemicals and drugs interact with genes involved in malignant transfromation |
| (DGIdb 4.0) |
| Entrez ID | Symbol | Category | Interaction Types | Drug Claim Name | Drug Name | PMIDs |
| Page: 1 |

Copyright 2023-Present -The University of Texas Health Science Center at Houston |