
|
|||||
|
 | |
| |
| |
| |
| |
| |
|
Gene: ANKRD26 |
Gene summary for ANKRD26 |
| Gene information | Species | Human | Gene symbol | ANKRD26 | Gene ID | 22852 |
| Gene name | ankyrin repeat domain 26 | |
| Gene Alias | THC2 | |
| Cytomap | 10p12.1 | |
| Gene Type | protein-coding | GO ID | GO:0008150 | UniProtAcc | Q9UPS8 |
Top |
Malignant transformation analysis |
| Identification of the aberrant gene expression in precancerous and cancerous lesions by comparing the gene expression of stem-like cells in diseased tissues with normal stem cells |
| Entrez ID | Symbol | Replicates | Species | Organ | Tissue | Adj P-value | Log2FC | Malignancy |
| 22852 | ANKRD26 | P65T-E | Human | Esophagus | ESCC | 2.80e-12 | 1.59e-01 | 0.0978 |
| 22852 | ANKRD26 | P74T-E | Human | Esophagus | ESCC | 8.66e-16 | 5.53e-01 | 0.1479 |
| 22852 | ANKRD26 | P75T-E | Human | Esophagus | ESCC | 2.11e-17 | 2.20e-01 | 0.1125 |
| 22852 | ANKRD26 | P76T-E | Human | Esophagus | ESCC | 1.44e-03 | 1.41e-01 | 0.1207 |
| 22852 | ANKRD26 | P79T-E | Human | Esophagus | ESCC | 3.95e-14 | 3.43e-01 | 0.1154 |
| 22852 | ANKRD26 | P80T-E | Human | Esophagus | ESCC | 2.25e-11 | 4.28e-01 | 0.155 |
| 22852 | ANKRD26 | P82T-E | Human | Esophagus | ESCC | 4.73e-04 | 3.16e-01 | 0.1072 |
| 22852 | ANKRD26 | P83T-E | Human | Esophagus | ESCC | 7.38e-24 | 5.99e-01 | 0.1738 |
| 22852 | ANKRD26 | P91T-E | Human | Esophagus | ESCC | 1.59e-12 | 8.39e-01 | 0.1828 |
| 22852 | ANKRD26 | P104T-E | Human | Esophagus | ESCC | 5.73e-05 | 1.90e-01 | 0.0931 |
| 22852 | ANKRD26 | P107T-E | Human | Esophagus | ESCC | 4.64e-06 | 1.62e-01 | 0.171 |
| 22852 | ANKRD26 | P127T-E | Human | Esophagus | ESCC | 6.58e-11 | 1.19e-01 | 0.0826 |
| 22852 | ANKRD26 | P128T-E | Human | Esophagus | ESCC | 1.70e-14 | 6.14e-01 | 0.1241 |
| 22852 | ANKRD26 | P130T-E | Human | Esophagus | ESCC | 5.58e-46 | 8.78e-01 | 0.1676 |
| 22852 | ANKRD26 | NAFLD1 | Human | Liver | NAFLD | 8.32e-09 | 7.77e-01 | -0.04 |
| 22852 | ANKRD26 | HCC1_Meng | Human | Liver | HCC | 9.57e-50 | 5.98e-03 | 0.0246 |
| 22852 | ANKRD26 | HCC2_Meng | Human | Liver | HCC | 1.12e-19 | 7.99e-02 | 0.0107 |
| 22852 | ANKRD26 | HCC1 | Human | Liver | HCC | 8.44e-10 | 4.08e+00 | 0.5336 |
| 22852 | ANKRD26 | HCC2 | Human | Liver | HCC | 1.19e-20 | 3.42e+00 | 0.5341 |
| 22852 | ANKRD26 | S014 | Human | Liver | HCC | 5.56e-09 | 3.74e-01 | 0.2254 |
| Page: 1 2 3 4 |
| Tissue | Expression Dynamics | Abbreviation |
| Esophagus | 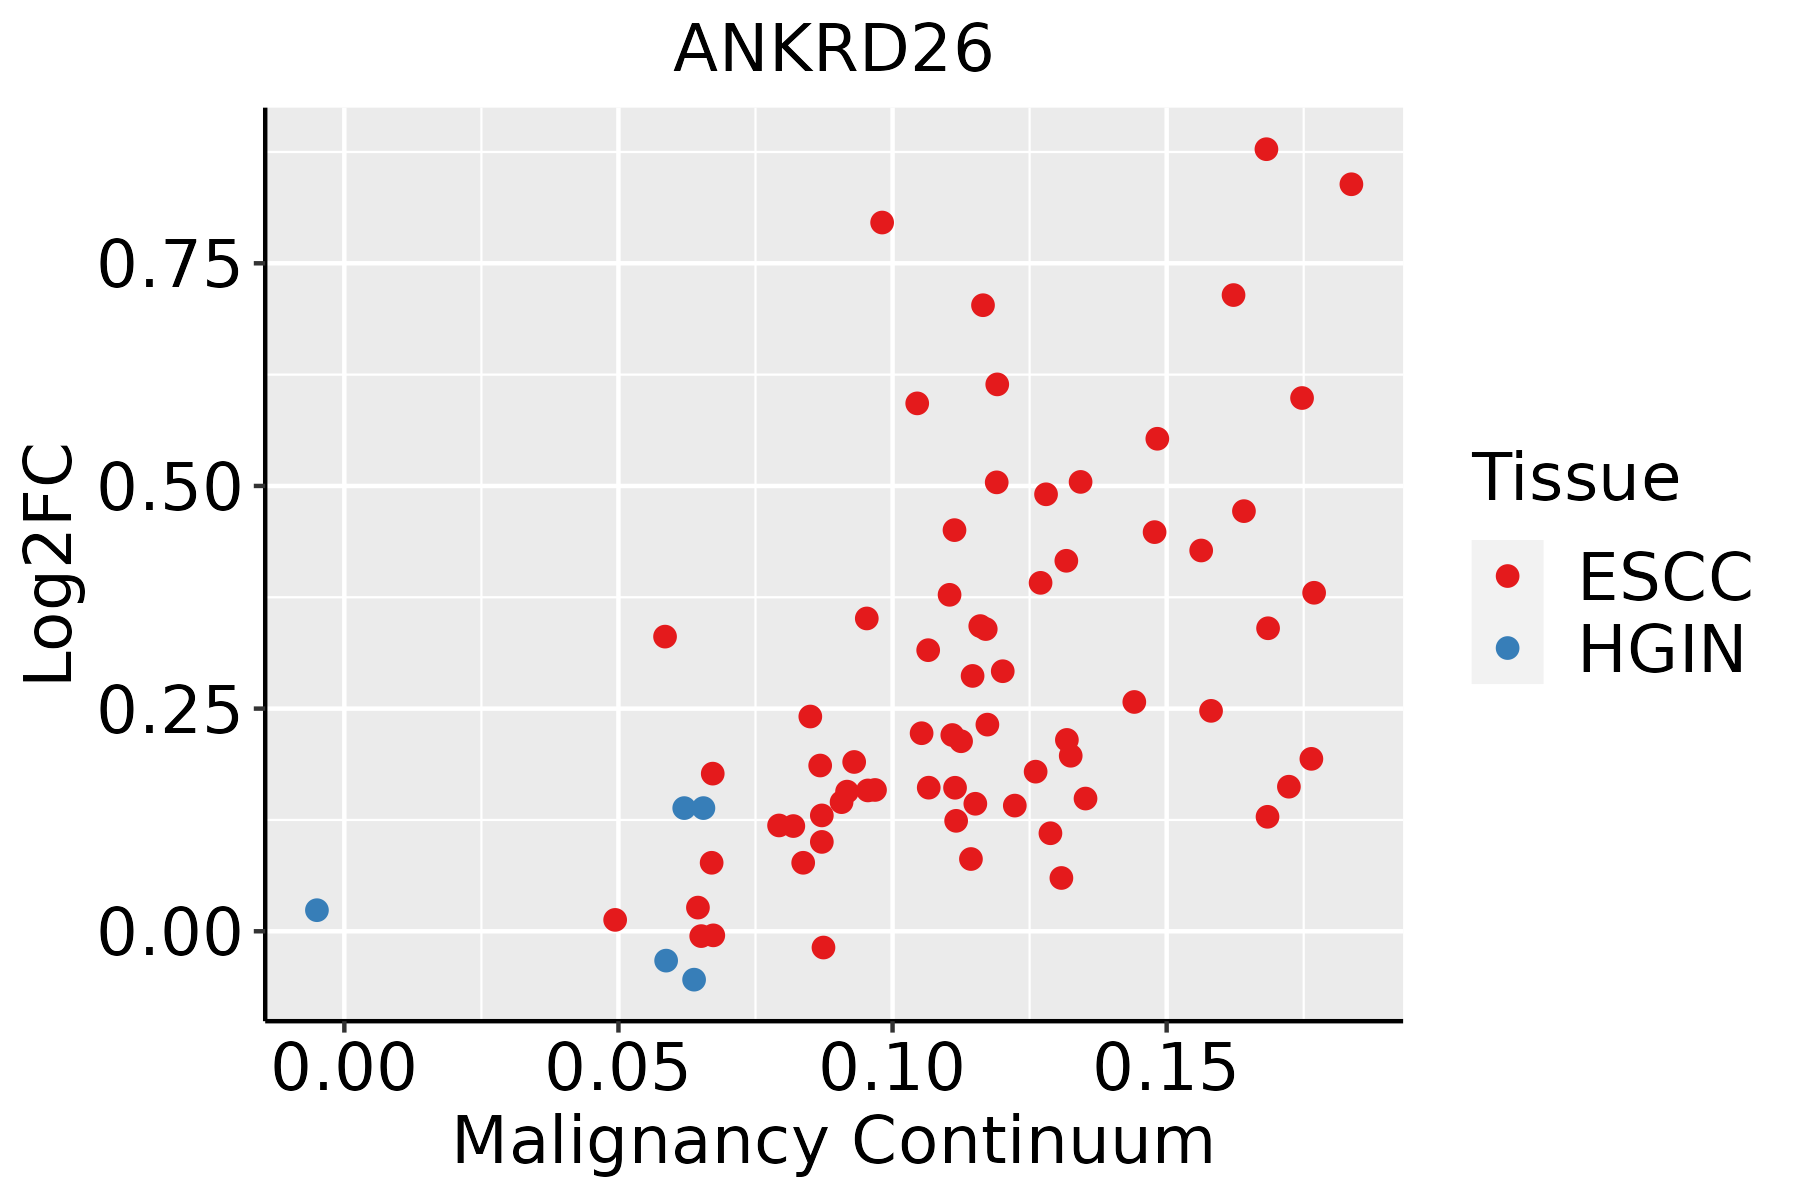 | ESCC: Esophageal squamous cell carcinoma |
| HGIN: High-grade intraepithelial neoplasias | ||
| LGIN: Low-grade intraepithelial neoplasias | ||
| Liver |  | HCC: Hepatocellular carcinoma |
| NAFLD: Non-alcoholic fatty liver disease | ||
| Thyroid | 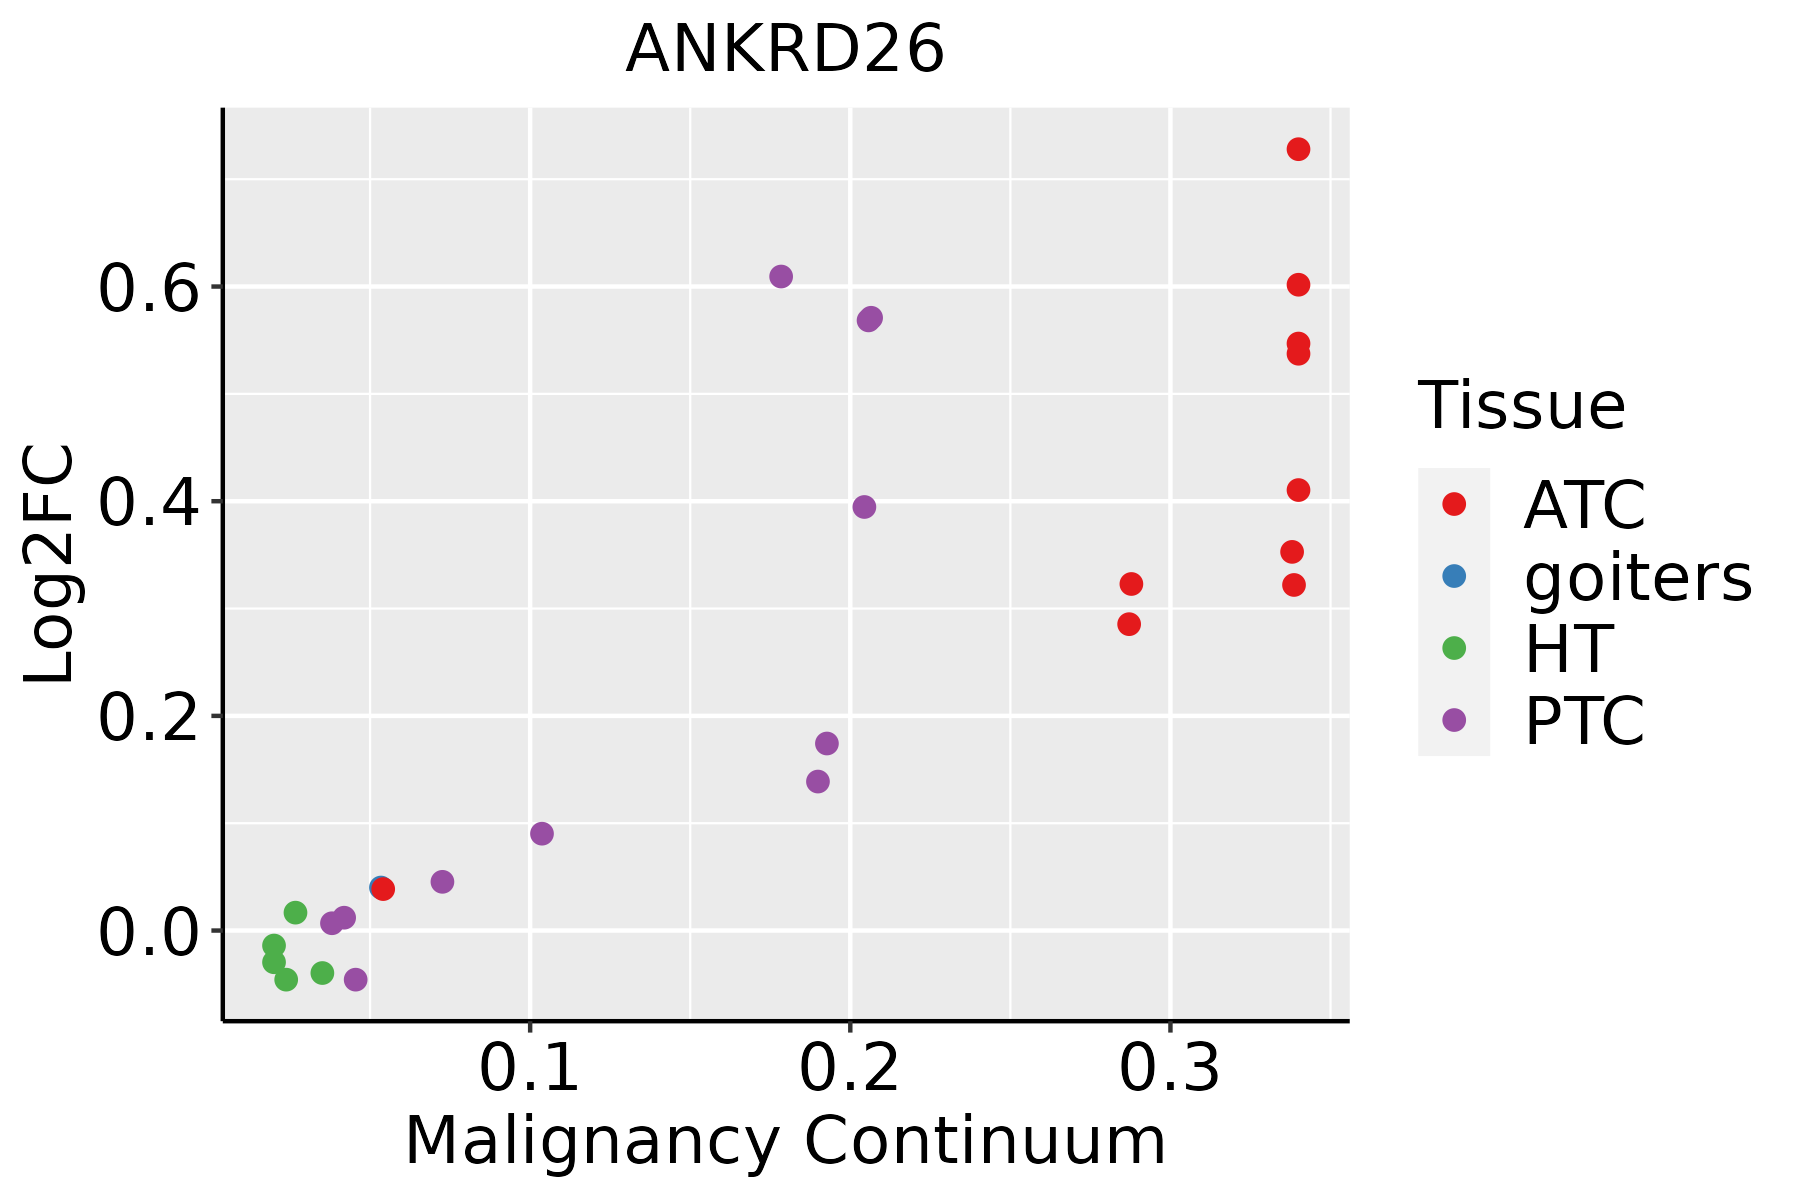 | ATC: Anaplastic thyroid cancer |
| HT: Hashimoto's thyroiditis | ||
| PTC: Papillary thyroid cancer |
| ∗log2FC in expression of this searched gene in stem-like cells from each diseased tissue sample relative to stem-like cells in normal samples in each tissue plotted against the malignancy continuum. Samples are colored based on if they are from different disease stage. |
Top |
Malignant transformation related pathway analysis |
| Find out the enriched GO biological processes and KEGG pathways involved in transition from healthy to precancer to cancer |
| Tissue | Disease Stage | Enriched GO biological Processes |
| Colorectum | AD |  |
| Colorectum | SER |  |
| Colorectum | MSS |  |
| Colorectum | MSI-H |  |
| Colorectum | FAP |  |
| ∗Top 15 enriched GO BP terms are showed in the bar plot of each disease state in each tissue. Each row represents a significant GO biological process which is colored according to the -log10(p.adjust). |
| Page: 1 2 3 4 5 6 7 8 9 |
| GO ID | Tissue | Disease Stage | Description | Gene Ratio | Bg Ratio | pvalue | p.adjust | Count |
| GO:00454449 | Esophagus | ESCC | fat cell differentiation | 135/8552 | 229/18723 | 3.38e-05 | 2.78e-04 | 135 |
| GO:00455984 | Esophagus | ESCC | regulation of fat cell differentiation | 79/8552 | 139/18723 | 5.23e-03 | 1.97e-02 | 79 |
| GO:00454441 | Liver | HCC | fat cell differentiation | 120/7958 | 229/18723 | 1.52e-03 | 8.05e-03 | 120 |
| GO:004544418 | Thyroid | PTC | fat cell differentiation | 102/5968 | 229/18723 | 3.66e-05 | 3.40e-04 | 102 |
| GO:004559814 | Thyroid | PTC | regulation of fat cell differentiation | 59/5968 | 139/18723 | 5.50e-03 | 2.50e-02 | 59 |
| GO:004544423 | Thyroid | ATC | fat cell differentiation | 105/6293 | 229/18723 | 7.42e-05 | 5.62e-04 | 105 |
| GO:004559822 | Thyroid | ATC | regulation of fat cell differentiation | 61/6293 | 139/18723 | 7.28e-03 | 2.86e-02 | 61 |
| GO:0045599 | Thyroid | ATC | negative regulation of fat cell differentiation | 28/6293 | 56/18723 | 8.12e-03 | 3.13e-02 | 28 |
| Page: 1 |
| Pathway ID | Tissue | Disease Stage | Description | Gene Ratio | Bg Ratio | pvalue | p.adjust | qvalue | Count |
| Page: 1 |
Top |
Cell-cell communication analysis |
| Identification of potential cell-cell interactions between two cell types and their ligand-receptor pairs for different disease states |
| Ligand | Receptor | LRpair | Pathway | Tissue | Disease Stage |
| Page: 1 |
Top |
Single-cell gene regulatory network inference analysis |
| Find out the significant the regulons (TFs) and the target genes of each regulon across cell types for different disease states |
| TF | Cell Type | Tissue | Disease Stage | Target Gene | RSS | Regulon Activity |
| ∗The dot plots of a searched regulon are shown for all cell subpopulations in each disease state of each tissue based on the regulon specific score inferred using pySCENIC and by calculating the average expression. |
| Page: 1 |
Top |
Somatic mutation of malignant transformation related genes |
| Annotation of somatic variants for genes involved in malignant transformation |
| Hugo Symbol | Variant Class | Variant Classification | dbSNP RS | HGVSc | HGVSp | HGVSp Short | SWISSPROT | BIOTYPE | SIFT | PolyPhen | Tumor Sample Barcode | Tissue | Histology | Sex | Age | Stage | Therapy Types | Drugs | Outcome |
| ANKRD26 | SNV | Missense_Mutation | novel | c.3208N>A | p.Glu1070Lys | p.E1070K | Q9UPS8 | protein_coding | deleterious(0.02) | possibly_damaging(0.636) | TCGA-3C-AALI-01 | Breast | breast invasive carcinoma | Female | <65 | I/II | Unspecific | Poly E | Complete Response |
| ANKRD26 | SNV | Missense_Mutation | c.4859N>T | p.Asp1620Val | p.D1620V | Q9UPS8 | protein_coding | tolerated(1) | benign(0) | TCGA-A1-A0SO-01 | Breast | breast invasive carcinoma | Female | >=65 | I/II | Chemotherapy | SD | ||
| ANKRD26 | SNV | Missense_Mutation | c.1591G>C | p.Glu531Gln | p.E531Q | Q9UPS8 | protein_coding | tolerated(0.1) | benign(0.246) | TCGA-A2-A0YK-01 | Breast | breast invasive carcinoma | Female | <65 | I/II | Chemotherapy | cytoxan | SD | |
| ANKRD26 | SNV | Missense_Mutation | rs750045401 | c.2485N>A | p.Val829Met | p.V829M | Q9UPS8 | protein_coding | tolerated(0.68) | benign(0.038) | TCGA-A8-A08T-01 | Breast | breast invasive carcinoma | Female | <65 | III/IV | Unknown | Unknown | PD |
| ANKRD26 | SNV | Missense_Mutation | c.3032N>G | p.Ser1011Cys | p.S1011C | Q9UPS8 | protein_coding | deleterious(0) | benign(0.005) | TCGA-A8-A094-01 | Breast | breast invasive carcinoma | Female | >=65 | I/II | Unknown | Unknown | SD | |
| ANKRD26 | SNV | Missense_Mutation | c.292C>G | p.Leu98Val | p.L98V | Q9UPS8 | protein_coding | tolerated(0.06) | possibly_damaging(0.562) | TCGA-AC-A23H-01 | Breast | breast invasive carcinoma | Female | >=65 | I/II | Unknown | Unknown | PD | |
| ANKRD26 | SNV | Missense_Mutation | c.3900N>T | p.Lys1300Asn | p.K1300N | Q9UPS8 | protein_coding | tolerated(0.15) | possibly_damaging(0.49) | TCGA-AC-A8OP-01 | Breast | breast invasive carcinoma | Female | >=65 | I/II | Unknown | Unknown | SD | |
| ANKRD26 | SNV | Missense_Mutation | novel | c.890N>A | p.Gly297Asp | p.G297D | Q9UPS8 | protein_coding | tolerated(0.24) | benign(0.009) | TCGA-AN-A046-01 | Breast | breast invasive carcinoma | Female | >=65 | I/II | Unknown | Unknown | SD |
| ANKRD26 | SNV | Missense_Mutation | c.3488C>T | p.Thr1163Ile | p.T1163I | Q9UPS8 | protein_coding | tolerated(0.08) | possibly_damaging(0.901) | TCGA-AN-A0AK-01 | Breast | breast invasive carcinoma | Female | >=65 | I/II | Unknown | Unknown | SD | |
| ANKRD26 | SNV | Missense_Mutation | c.4876A>G | p.Ile1626Val | p.I1626V | Q9UPS8 | protein_coding | tolerated(0.57) | benign(0.058) | TCGA-AO-A128-01 | Breast | breast invasive carcinoma | Female | <65 | I/II | Chemotherapy | doxorubicin | SD |
| Page: 1 2 3 4 5 6 7 8 9 10 11 12 13 14 15 16 17 18 19 20 21 22 |
Top |
Related drugs of malignant transformation related genes |
| Identification of chemicals and drugs interact with genes involved in malignant transfromation |
| (DGIdb 4.0) |
| Entrez ID | Symbol | Category | Interaction Types | Drug Claim Name | Drug Name | PMIDs |
| Page: 1 |

Copyright 2023-Present -The University of Texas Health Science Center at Houston |