
|
|||||
|
 | |
| |
| |
| |
| |
| |
|
Gene: ALDH1A1 |
Gene summary for ALDH1A1 |
| Gene information | Species | Human | Gene symbol | ALDH1A1 | Gene ID | 216 |
| Gene name | aldehyde dehydrogenase 1 family member A1 | |
| Gene Alias | ALDC | |
| Cytomap | 9q21.13 | |
| Gene Type | protein-coding | GO ID | GO:0001523 | UniProtAcc | P00352 |
Top |
Malignant transformation analysis |
| Identification of the aberrant gene expression in precancerous and cancerous lesions by comparing the gene expression of stem-like cells in diseased tissues with normal stem cells |
| Entrez ID | Symbol | Replicates | Species | Organ | Tissue | Adj P-value | Log2FC | Malignancy |
| 216 | ALDH1A1 | P4T-E | Human | Esophagus | ESCC | 3.22e-36 | 1.67e+00 | 0.1323 |
| 216 | ALDH1A1 | P5T-E | Human | Esophagus | ESCC | 4.57e-06 | 2.42e-01 | 0.1327 |
| 216 | ALDH1A1 | P8T-E | Human | Esophagus | ESCC | 4.74e-71 | 2.00e+00 | 0.0889 |
| 216 | ALDH1A1 | P9T-E | Human | Esophagus | ESCC | 9.98e-24 | 1.04e+00 | 0.1131 |
| 216 | ALDH1A1 | P10T-E | Human | Esophagus | ESCC | 1.04e-02 | -2.36e-01 | 0.116 |
| 216 | ALDH1A1 | P12T-E | Human | Esophagus | ESCC | 8.86e-75 | 2.36e+00 | 0.1122 |
| 216 | ALDH1A1 | P15T-E | Human | Esophagus | ESCC | 6.80e-23 | 9.84e-01 | 0.1149 |
| 216 | ALDH1A1 | P16T-E | Human | Esophagus | ESCC | 6.35e-07 | 2.58e-01 | 0.1153 |
| 216 | ALDH1A1 | P23T-E | Human | Esophagus | ESCC | 9.88e-17 | 1.00e+00 | 0.108 |
| 216 | ALDH1A1 | P24T-E | Human | Esophagus | ESCC | 9.74e-03 | -6.67e-02 | 0.1287 |
| 216 | ALDH1A1 | P26T-E | Human | Esophagus | ESCC | 6.17e-40 | 1.42e+00 | 0.1276 |
| 216 | ALDH1A1 | P27T-E | Human | Esophagus | ESCC | 6.02e-65 | 2.13e+00 | 0.1055 |
| 216 | ALDH1A1 | P28T-E | Human | Esophagus | ESCC | 9.42e-68 | 2.07e+00 | 0.1149 |
| 216 | ALDH1A1 | P30T-E | Human | Esophagus | ESCC | 1.26e-38 | 3.30e+00 | 0.137 |
| 216 | ALDH1A1 | P39T-E | Human | Esophagus | ESCC | 4.40e-30 | 9.26e-01 | 0.0894 |
| 216 | ALDH1A1 | P48T-E | Human | Esophagus | ESCC | 9.32e-29 | 1.15e+00 | 0.0959 |
| 216 | ALDH1A1 | P52T-E | Human | Esophagus | ESCC | 1.49e-05 | 8.19e-01 | 0.1555 |
| 216 | ALDH1A1 | P54T-E | Human | Esophagus | ESCC | 3.53e-18 | 9.94e-01 | 0.0975 |
| 216 | ALDH1A1 | P57T-E | Human | Esophagus | ESCC | 4.26e-07 | 4.37e-01 | 0.0926 |
| 216 | ALDH1A1 | P61T-E | Human | Esophagus | ESCC | 1.96e-17 | 7.03e-01 | 0.099 |
| Page: 1 2 3 4 5 6 7 8 9 |
| Tissue | Expression Dynamics | Abbreviation |
| Colorectum (GSE201348) |  | FAP: Familial adenomatous polyposis |
| CRC: Colorectal cancer | ||
| Colorectum (HTA11) |  | AD: Adenomas |
| SER: Sessile serrated lesions | ||
| MSI-H: Microsatellite-high colorectal cancer | ||
| MSS: Microsatellite stable colorectal cancer | ||
| Endometrium | 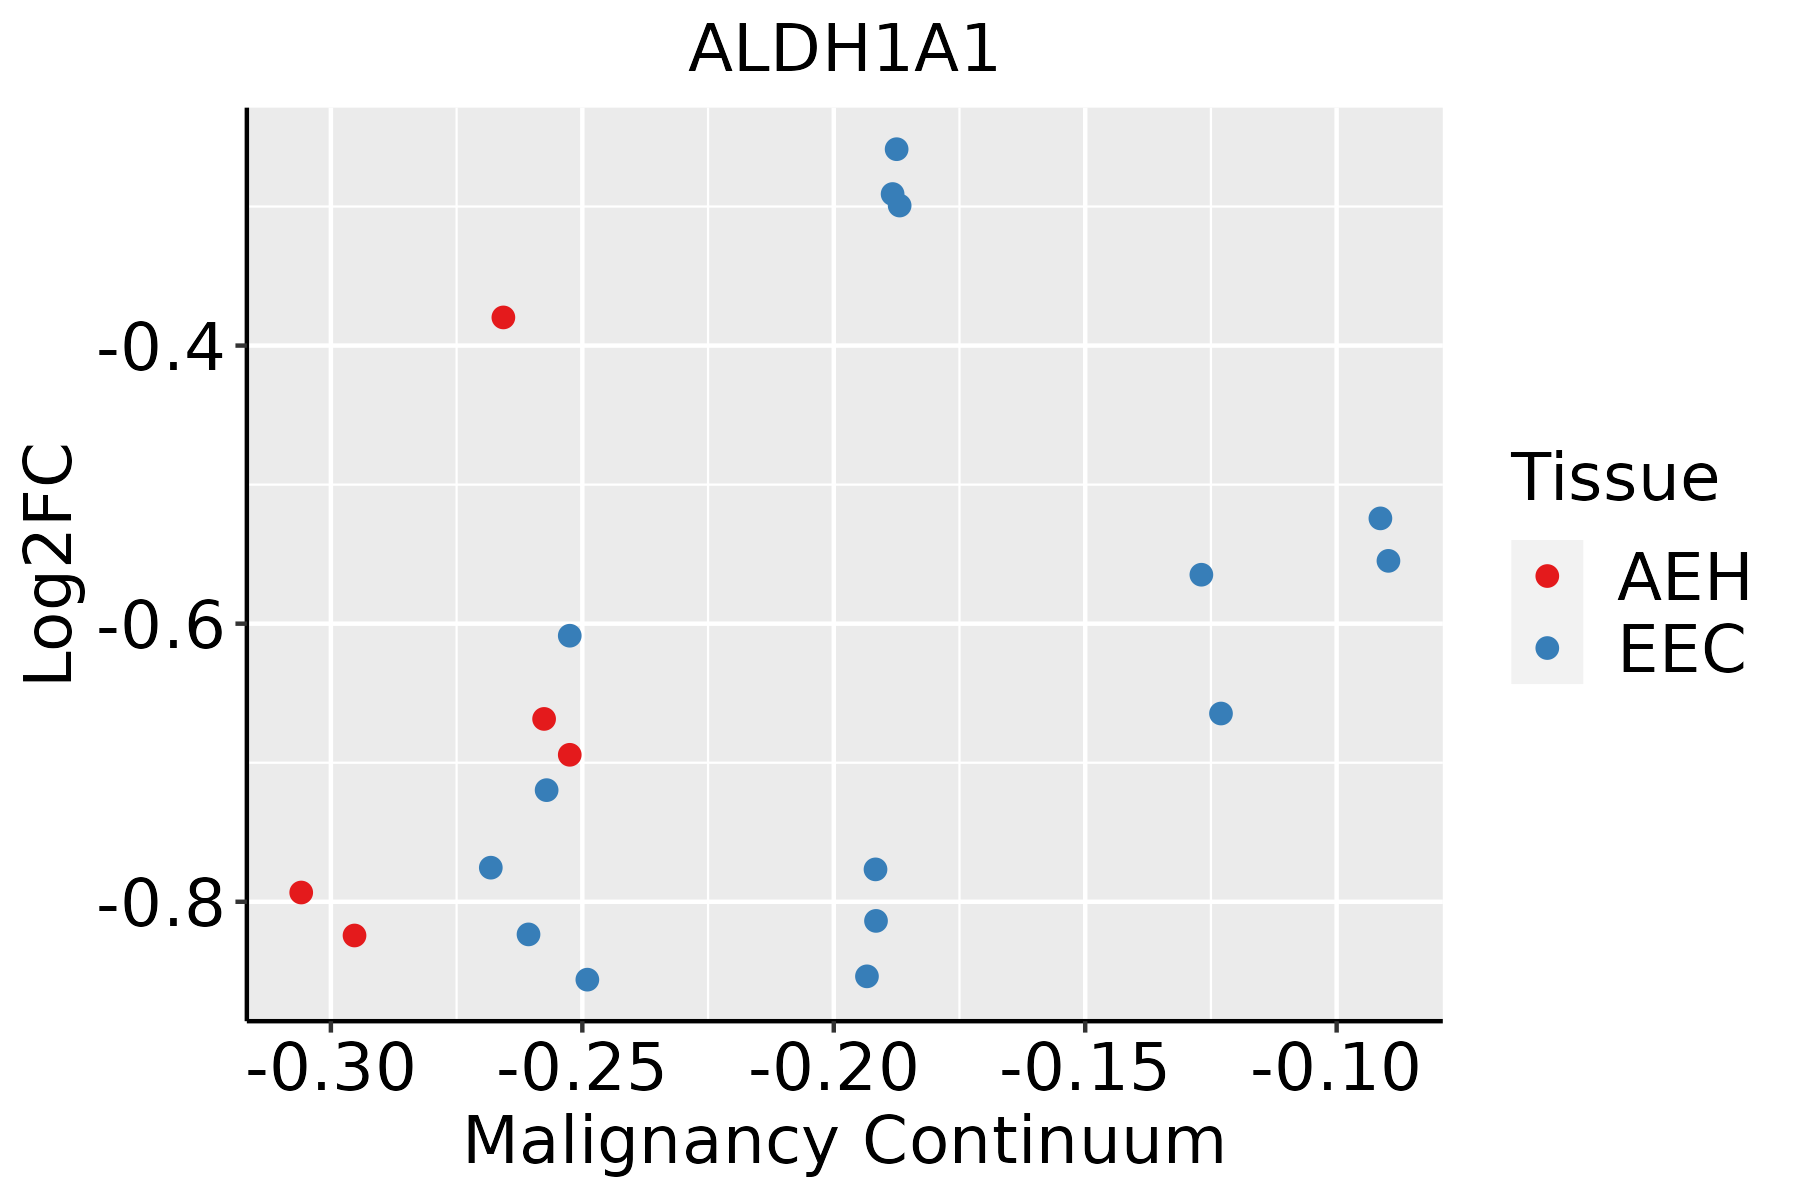 | AEH: Atypical endometrial hyperplasia |
| EEC: Endometrioid Cancer | ||
| Esophagus | 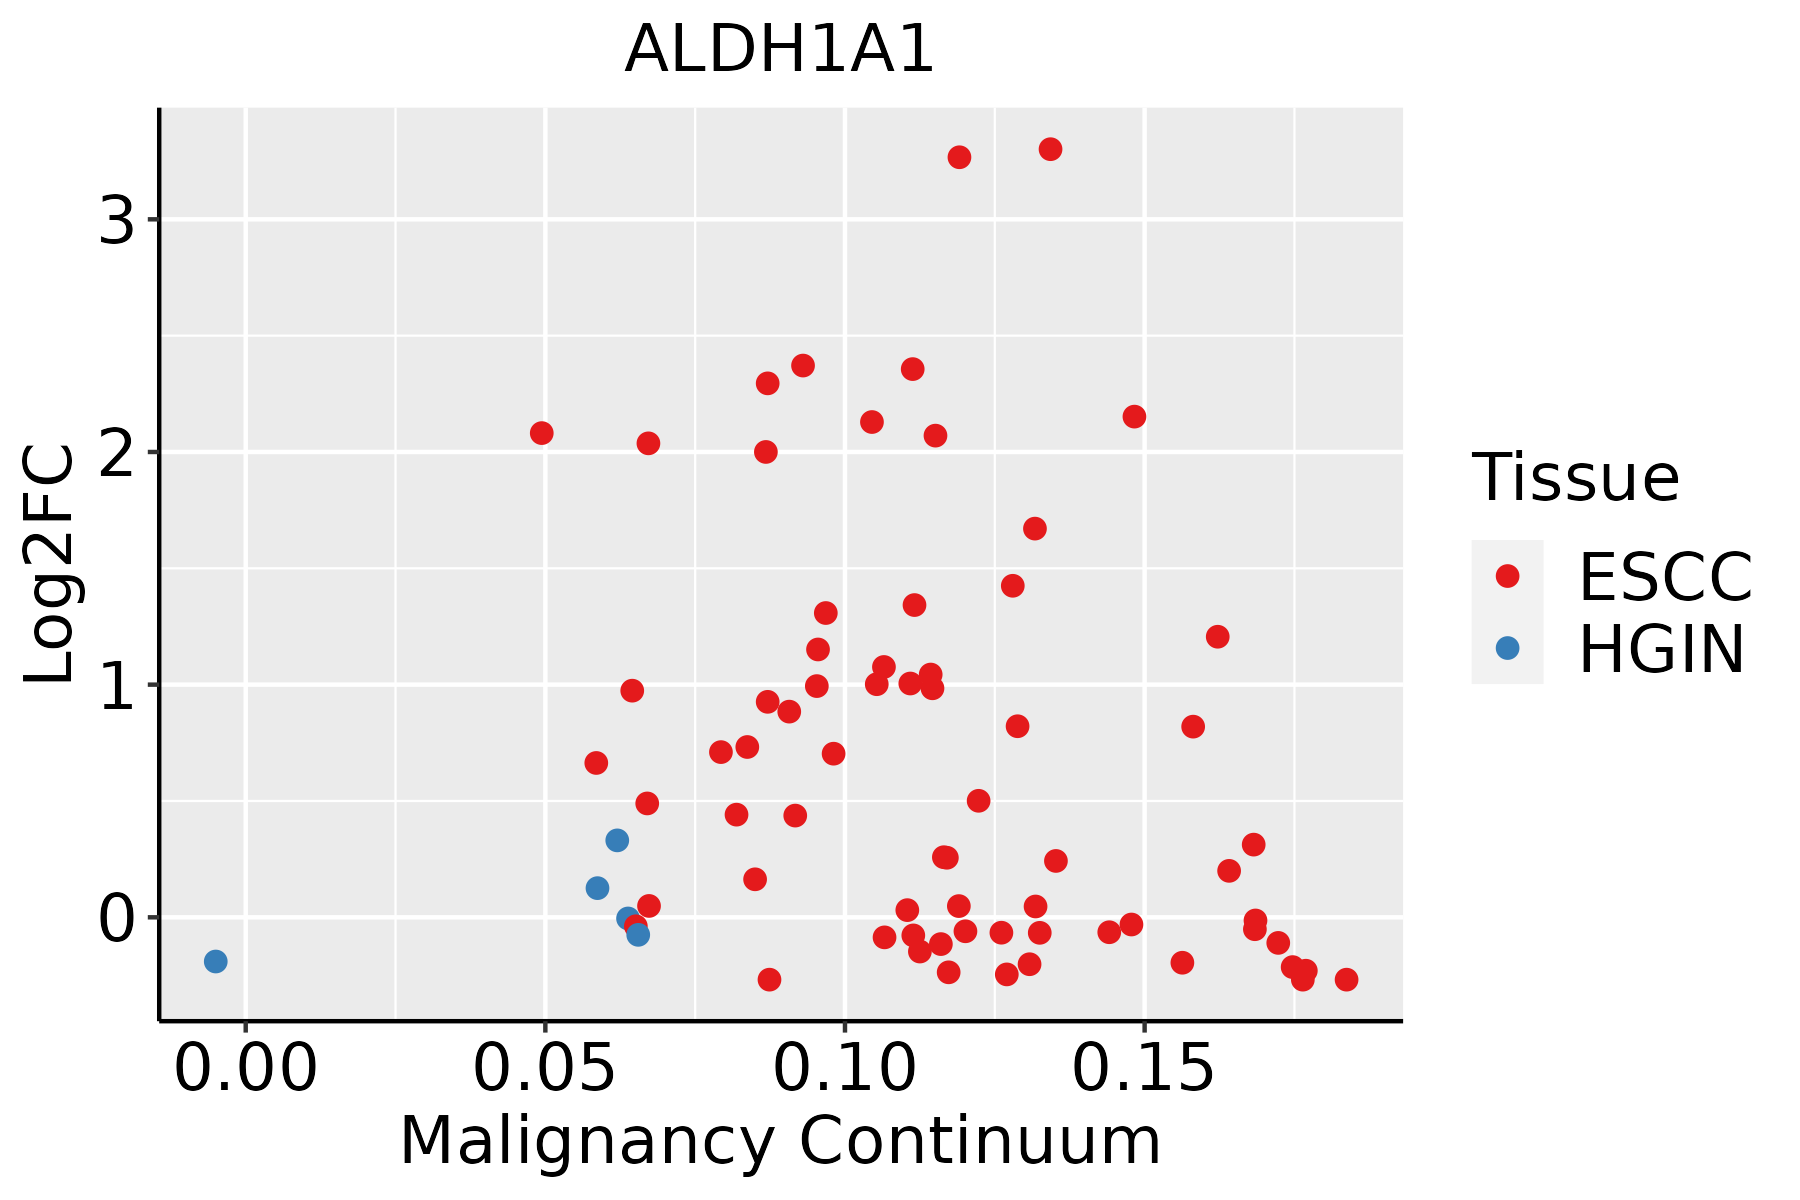 | ESCC: Esophageal squamous cell carcinoma |
| HGIN: High-grade intraepithelial neoplasias | ||
| LGIN: Low-grade intraepithelial neoplasias | ||
| GC | 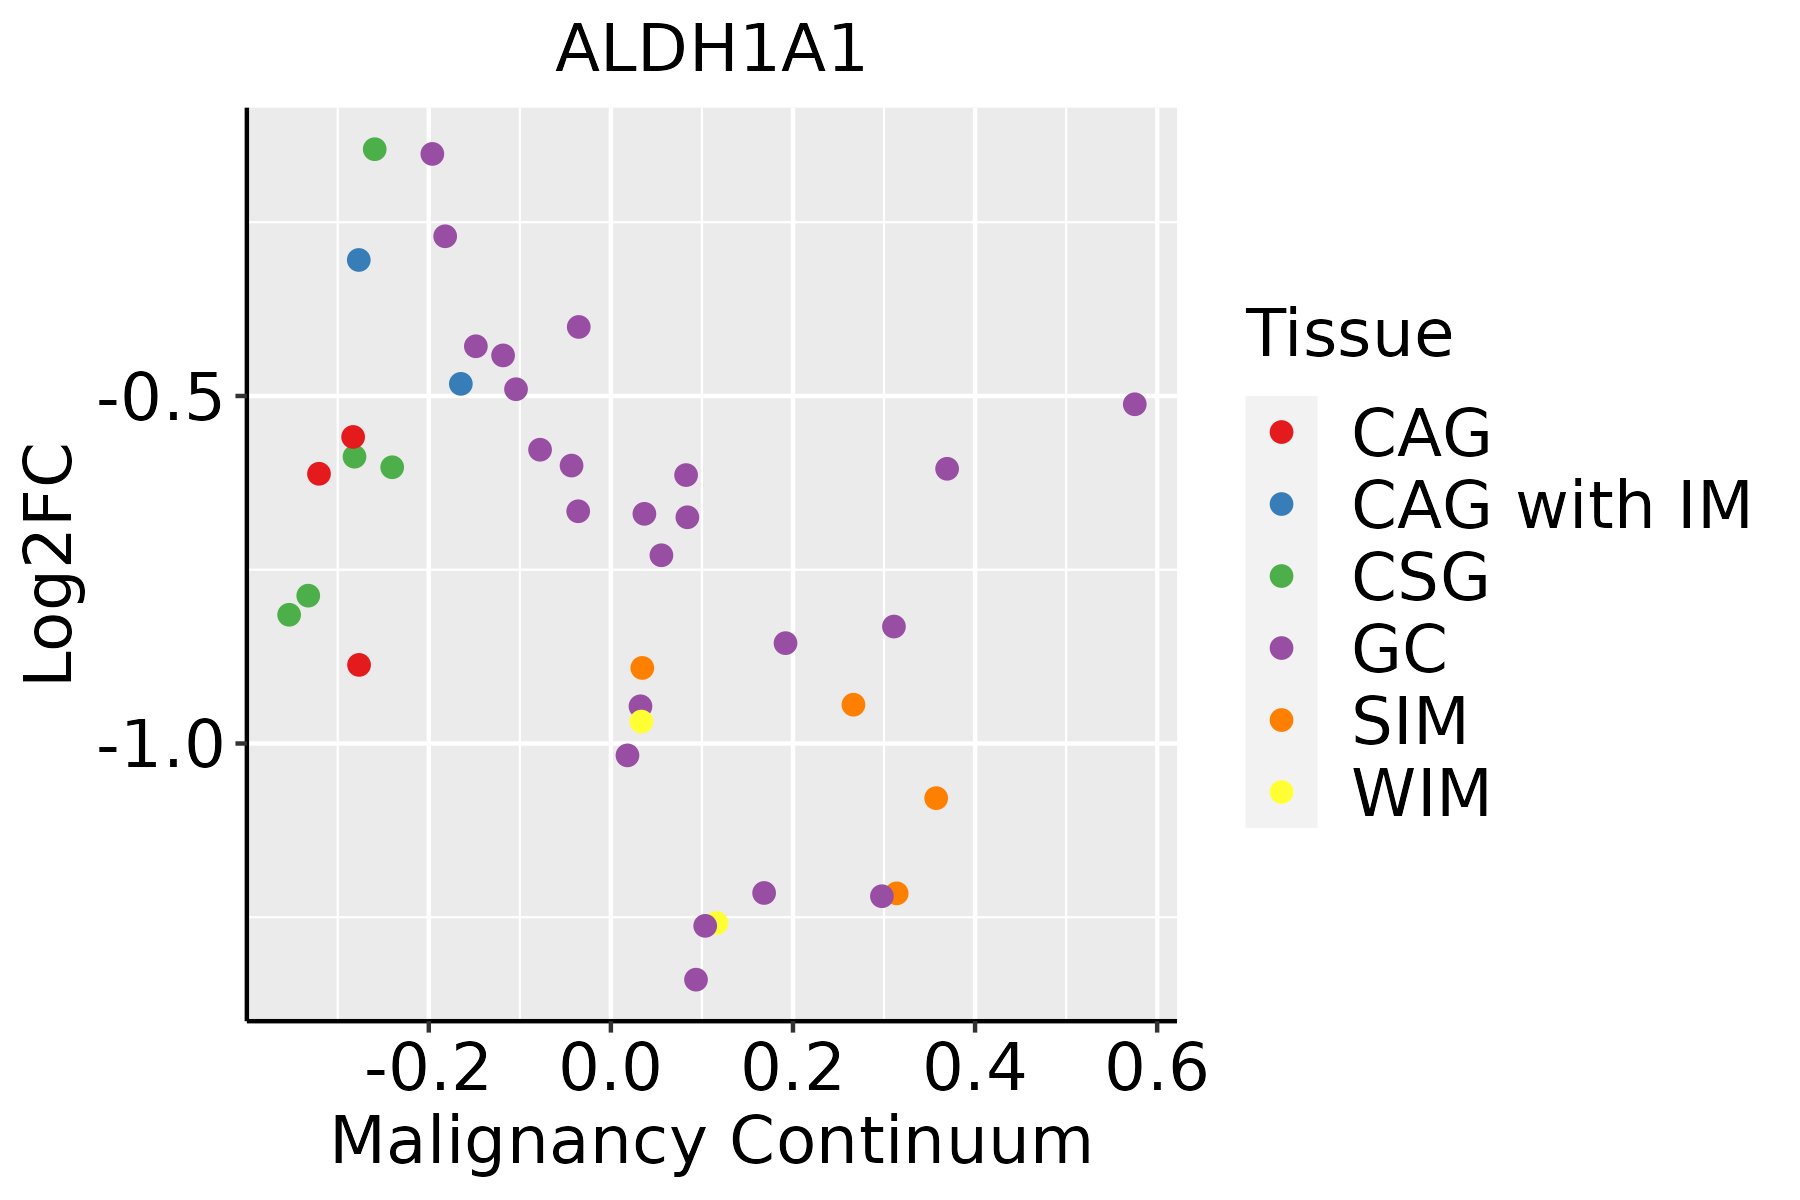 | CAG: Chronic atrophic gastritis |
| CAG with IM: Chronic atrophic gastritis with intestinal metaplasia | ||
| CSG: Chronic superficial gastritis | ||
| GC: Gastric cancer | ||
| SIM: Severe intestinal metaplasia | ||
| WIM: Wild intestinal metaplasia | ||
| Liver | 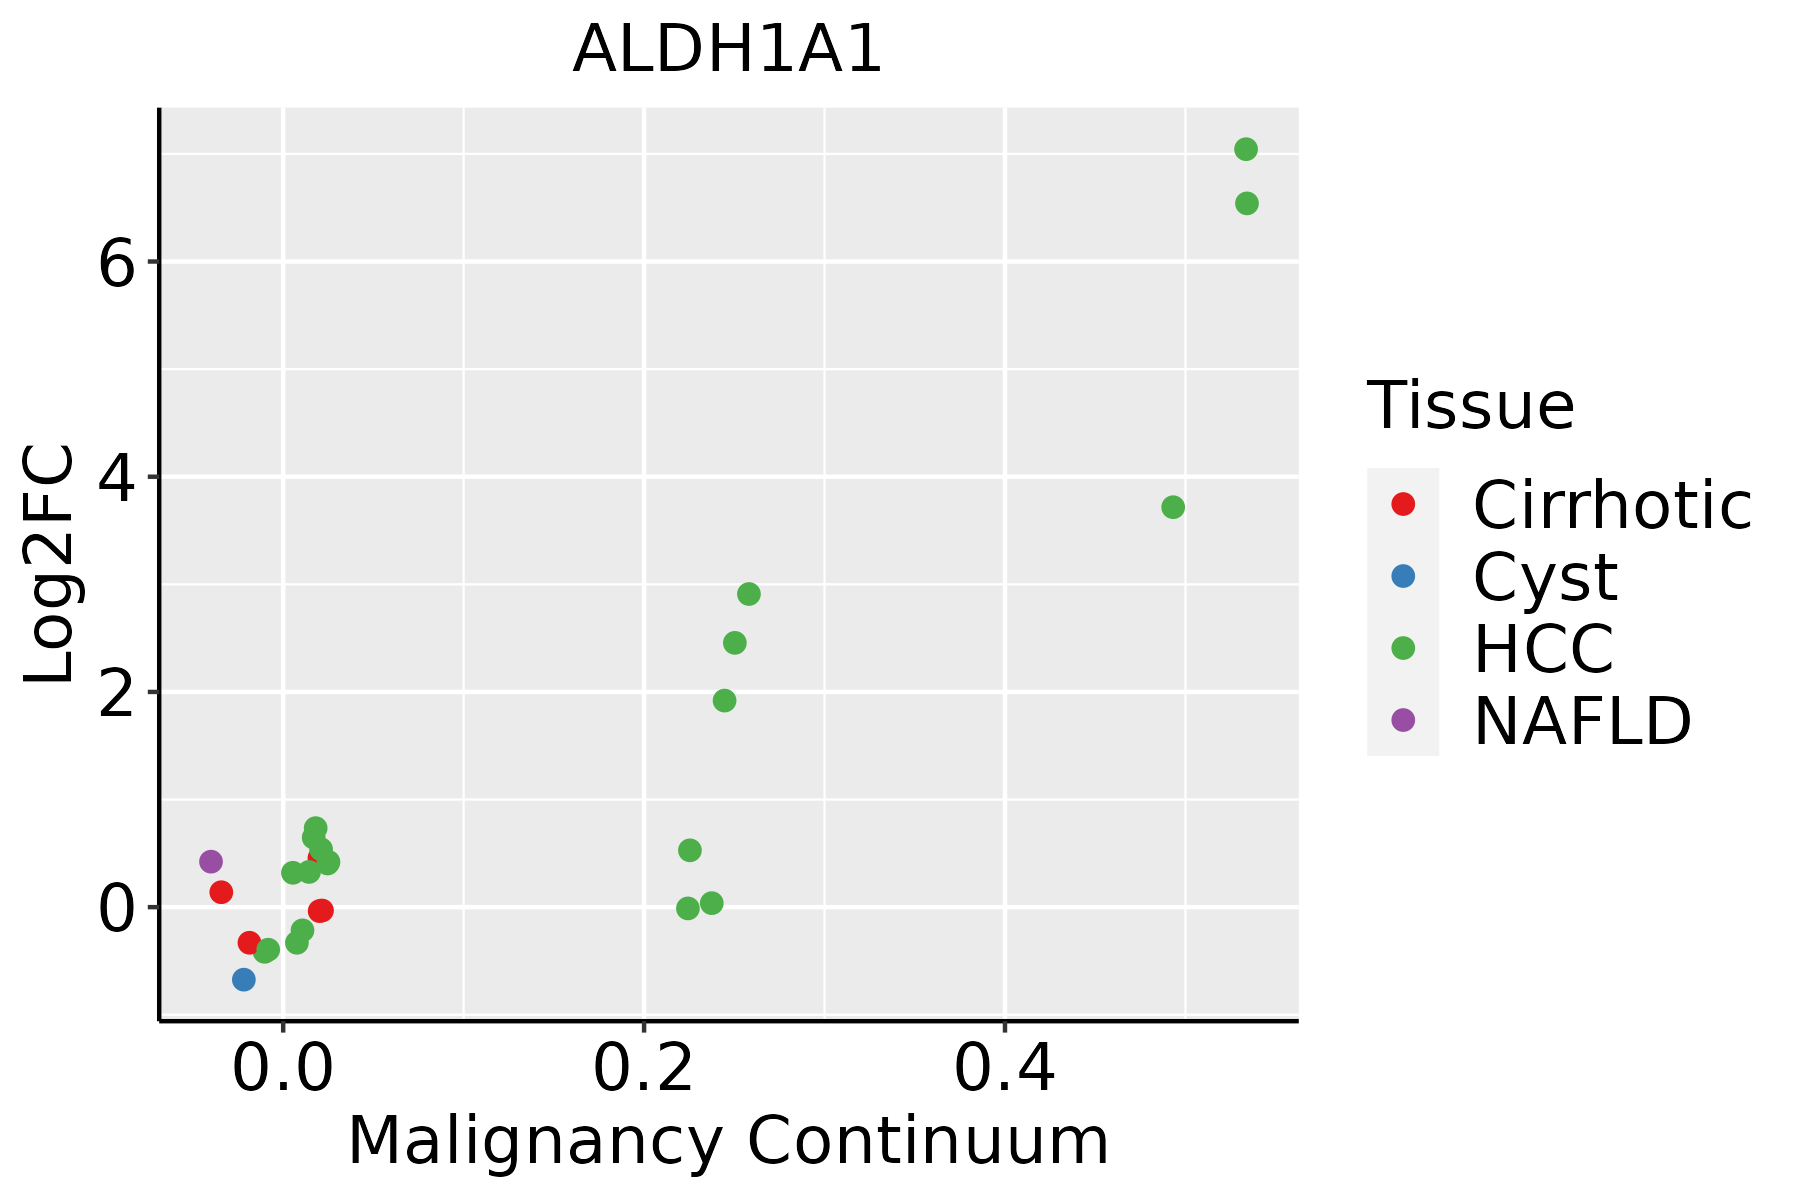 | HCC: Hepatocellular carcinoma |
| NAFLD: Non-alcoholic fatty liver disease | ||
| Oral Cavity | 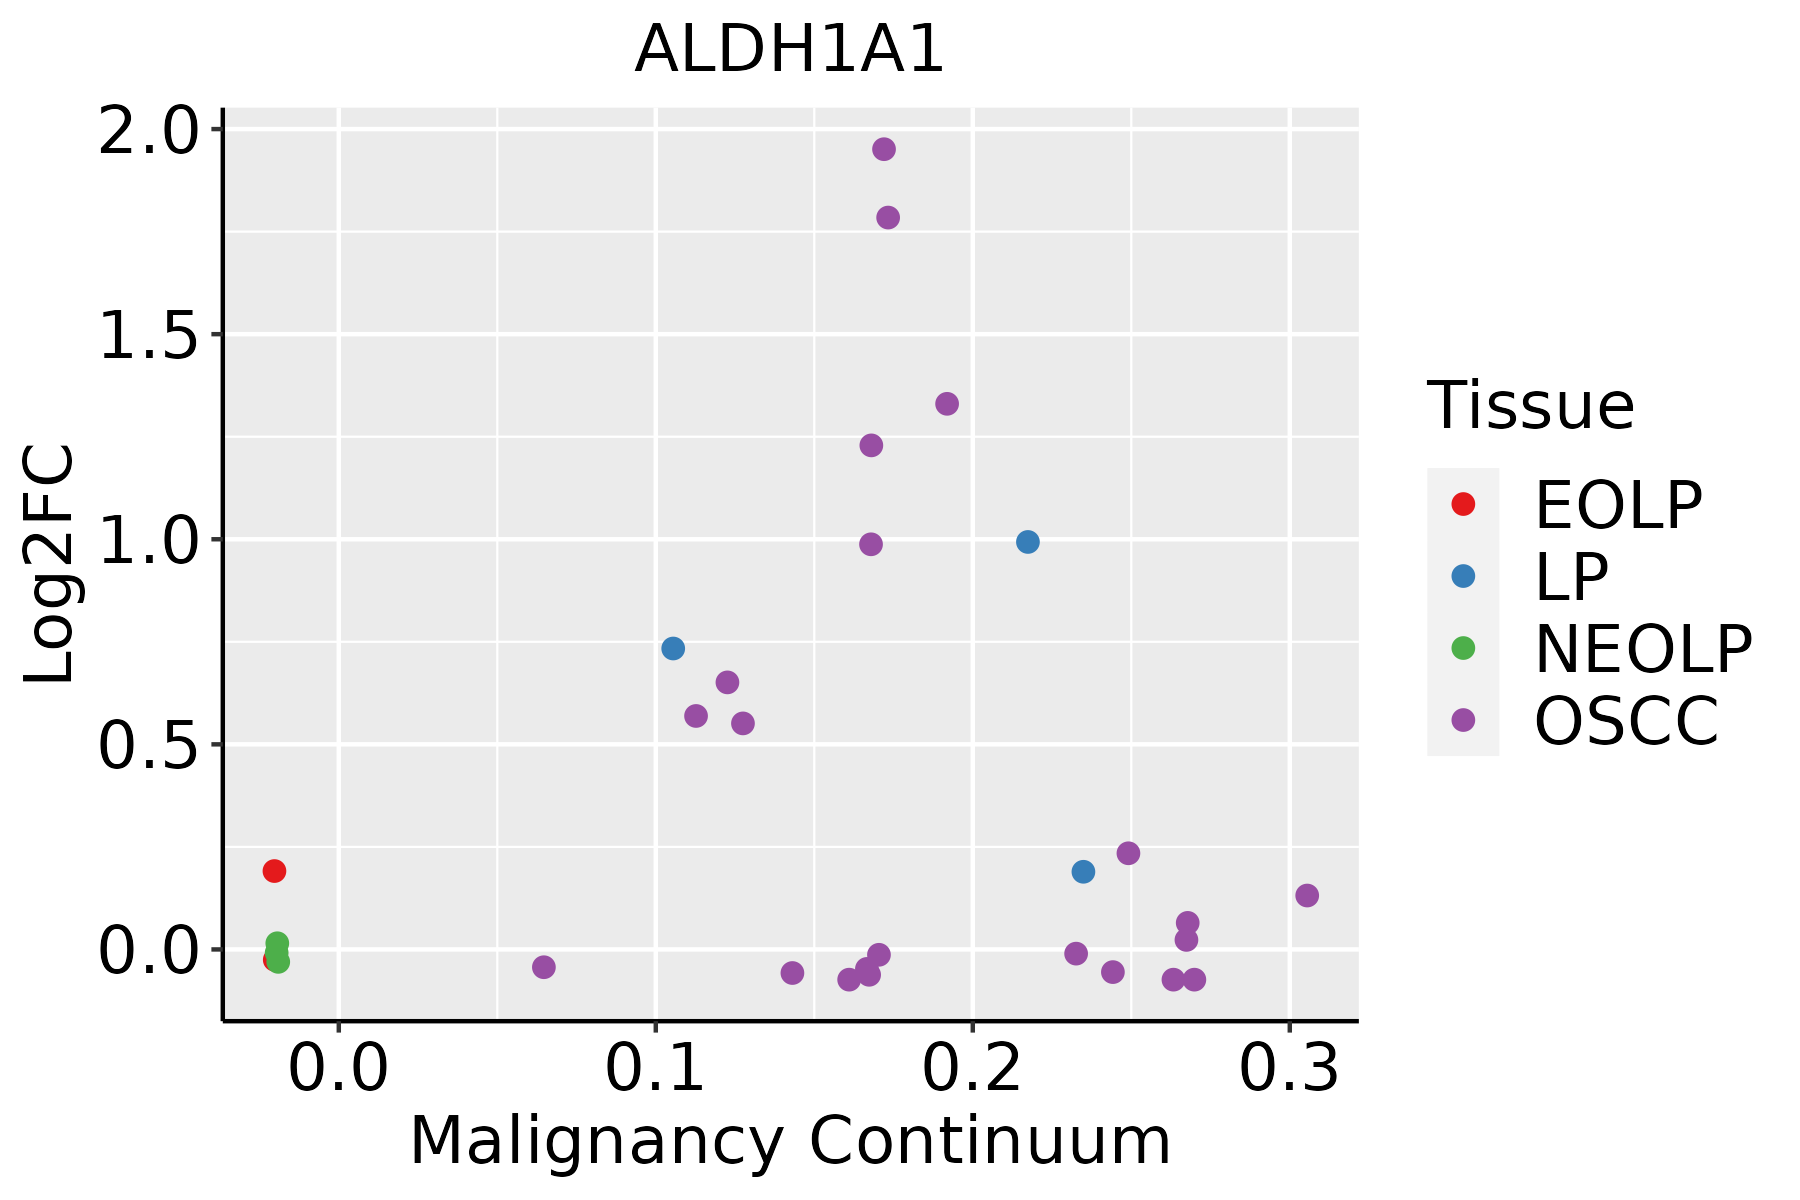 | EOLP: Erosive Oral lichen planus |
| LP: leukoplakia | ||
| NEOLP: Non-erosive oral lichen planus | ||
| OSCC: Oral squamous cell carcinoma | ||
| Thyroid | 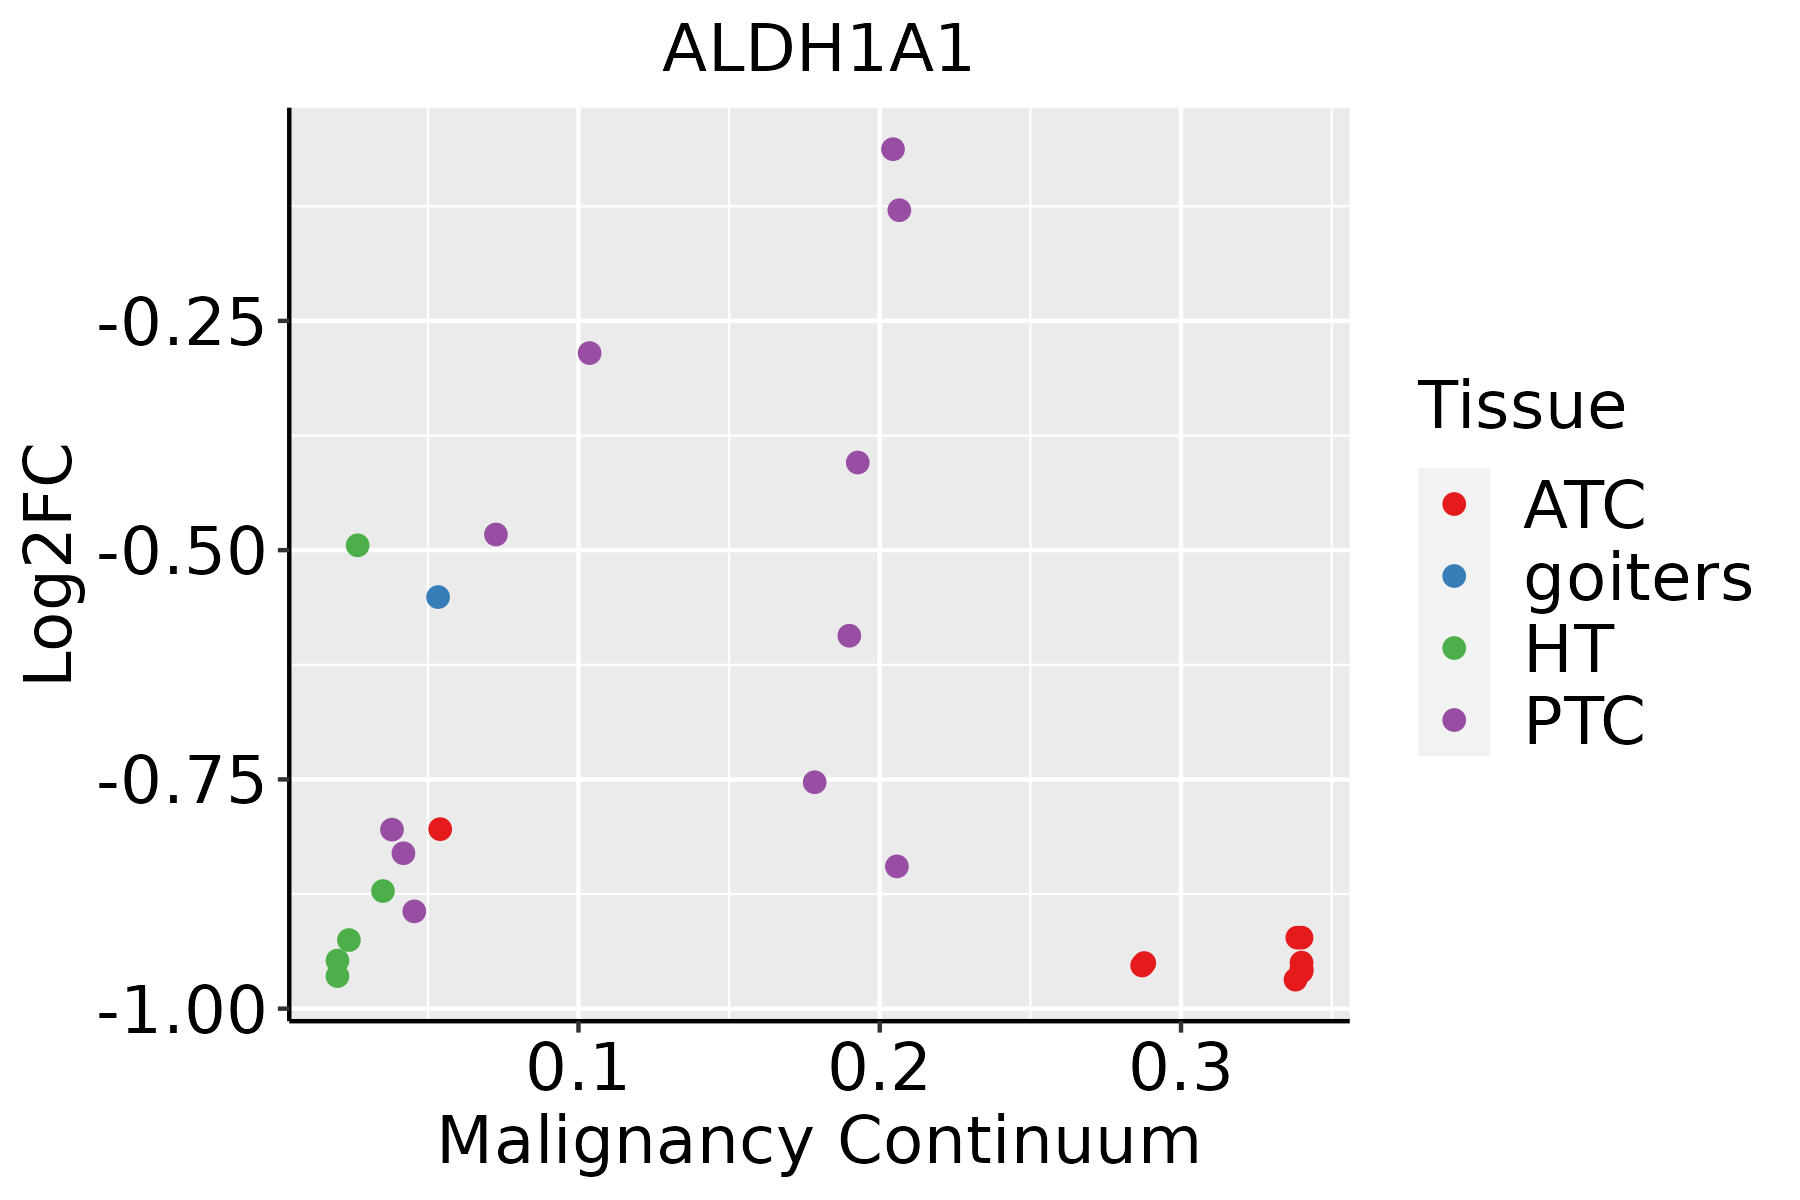 | ATC: Anaplastic thyroid cancer |
| HT: Hashimoto's thyroiditis | ||
| PTC: Papillary thyroid cancer |
| ∗log2FC in expression of this searched gene in stem-like cells from each diseased tissue sample relative to stem-like cells in normal samples in each tissue plotted against the malignancy continuum. Samples are colored based on if they are from different disease stage. |
Top |
Malignant transformation related pathway analysis |
| Find out the enriched GO biological processes and KEGG pathways involved in transition from healthy to precancer to cancer |
| Tissue | Disease Stage | Enriched GO biological Processes |
| Colorectum | AD |  |
| Colorectum | SER |  |
| Colorectum | MSS |  |
| Colorectum | MSI-H |  |
| Colorectum | FAP |  |
| ∗Top 15 enriched GO BP terms are showed in the bar plot of each disease state in each tissue. Each row represents a significant GO biological process which is colored according to the -log10(p.adjust). |
| Page: 1 2 3 4 5 6 7 8 9 |
| GO ID | Tissue | Disease Stage | Description | Gene Ratio | Bg Ratio | pvalue | p.adjust | Count |
| GO:0009636 | Colorectum | AD | response to toxic substance | 88/3918 | 262/18723 | 1.12e-06 | 3.72e-05 | 88 |
| GO:0006066 | Colorectum | AD | alcohol metabolic process | 106/3918 | 353/18723 | 3.02e-05 | 5.57e-04 | 106 |
| GO:0098754 | Colorectum | AD | detoxification | 53/3918 | 152/18723 | 4.63e-05 | 7.98e-04 | 53 |
| GO:0060249 | Colorectum | AD | anatomical structure homeostasis | 94/3918 | 314/18723 | 9.37e-05 | 1.42e-03 | 94 |
| GO:0097237 | Colorectum | AD | cellular response to toxic substance | 44/3918 | 124/18723 | 1.24e-04 | 1.80e-03 | 44 |
| GO:0001894 | Colorectum | AD | tissue homeostasis | 81/3918 | 268/18723 | 1.96e-04 | 2.62e-03 | 81 |
| GO:1990748 | Colorectum | AD | cellular detoxification | 41/3918 | 116/18723 | 2.29e-04 | 2.97e-03 | 41 |
| GO:0034308 | Colorectum | AD | primary alcohol metabolic process | 35/3918 | 102/18723 | 1.16e-03 | 1.05e-02 | 35 |
| GO:0006520 | Colorectum | AD | cellular amino acid metabolic process | 81/3918 | 284/18723 | 1.37e-03 | 1.19e-02 | 81 |
| GO:0006081 | Colorectum | AD | cellular aldehyde metabolic process | 22/3918 | 60/18723 | 3.64e-03 | 2.60e-02 | 22 |
| GO:0106106 | Colorectum | AD | cold-induced thermogenesis | 43/3918 | 144/18723 | 7.05e-03 | 4.31e-02 | 43 |
| GO:0120161 | Colorectum | AD | regulation of cold-induced thermogenesis | 43/3918 | 144/18723 | 7.05e-03 | 4.31e-02 | 43 |
| GO:1990845 | Colorectum | AD | adaptive thermogenesis | 46/3918 | 157/18723 | 7.97e-03 | 4.73e-02 | 46 |
| GO:00096361 | Colorectum | SER | response to toxic substance | 71/2897 | 262/18723 | 8.63e-07 | 4.07e-05 | 71 |
| GO:00972371 | Colorectum | SER | cellular response to toxic substance | 40/2897 | 124/18723 | 2.28e-06 | 9.43e-05 | 40 |
| GO:00987541 | Colorectum | SER | detoxification | 46/2897 | 152/18723 | 3.02e-06 | 1.20e-04 | 46 |
| GO:19907481 | Colorectum | SER | cellular detoxification | 37/2897 | 116/18723 | 7.20e-06 | 2.48e-04 | 37 |
| GO:00018941 | Colorectum | SER | tissue homeostasis | 66/2897 | 268/18723 | 5.87e-05 | 1.37e-03 | 66 |
| GO:00602491 | Colorectum | SER | anatomical structure homeostasis | 74/2897 | 314/18723 | 1.01e-04 | 2.13e-03 | 74 |
| GO:00060661 | Colorectum | SER | alcohol metabolic process | 79/2897 | 353/18723 | 3.50e-04 | 5.50e-03 | 79 |
| Page: 1 2 3 4 5 6 7 8 9 10 11 12 13 |
| Pathway ID | Tissue | Disease Stage | Description | Gene Ratio | Bg Ratio | pvalue | p.adjust | qvalue | Count |
| Page: 1 |
Top |
Cell-cell communication analysis |
| Identification of potential cell-cell interactions between two cell types and their ligand-receptor pairs for different disease states |
| Ligand | Receptor | LRpair | Pathway | Tissue | Disease Stage |
| Page: 1 |
Top |
Single-cell gene regulatory network inference analysis |
| Find out the significant the regulons (TFs) and the target genes of each regulon across cell types for different disease states |
| TF | Cell Type | Tissue | Disease Stage | Target Gene | RSS | Regulon Activity |
| ∗The dot plots of a searched regulon are shown for all cell subpopulations in each disease state of each tissue based on the regulon specific score inferred using pySCENIC and by calculating the average expression. |
| Page: 1 |
Top |
Somatic mutation of malignant transformation related genes |
| Annotation of somatic variants for genes involved in malignant transformation |
| Hugo Symbol | Variant Class | Variant Classification | dbSNP RS | HGVSc | HGVSp | HGVSp Short | SWISSPROT | BIOTYPE | SIFT | PolyPhen | Tumor Sample Barcode | Tissue | Histology | Sex | Age | Stage | Therapy Types | Drugs | Outcome |
| ALDH1A1 | SNV | Missense_Mutation | novel | c.924G>C | p.Arg308Ser | p.R308S | P00352 | protein_coding | deleterious(0) | probably_damaging(0.995) | TCGA-5L-AAT0-01 | Breast | breast invasive carcinoma | Female | <65 | I/II | Hormone Therapy | tamoxiphen | SD |
| ALDH1A1 | SNV | Missense_Mutation | novel | c.311N>T | p.Ala104Val | p.A104V | P00352 | protein_coding | deleterious(0.02) | possibly_damaging(0.712) | TCGA-AN-A046-01 | Breast | breast invasive carcinoma | Female | >=65 | I/II | Unknown | Unknown | SD |
| ALDH1A1 | SNV | Missense_Mutation | novel | c.326T>C | p.Met109Thr | p.M109T | P00352 | protein_coding | deleterious(0.02) | benign(0.006) | TCGA-AN-A0AK-01 | Breast | breast invasive carcinoma | Female | >=65 | I/II | Unknown | Unknown | SD |
| ALDH1A1 | SNV | Missense_Mutation | c.772N>T | p.Ala258Ser | p.A258S | P00352 | protein_coding | tolerated(0.14) | benign(0.261) | TCGA-BH-A0H9-01 | Breast | breast invasive carcinoma | Female | >=65 | I/II | Hormone Therapy | arimidex | SD | |
| ALDH1A1 | SNV | Missense_Mutation | c.1502C>T | p.Ser501Leu | p.S501L | P00352 | protein_coding | deleterious(0) | probably_damaging(0.999) | TCGA-BH-A18P-01 | Breast | breast invasive carcinoma | Female | <65 | I/II | Unknown | Unknown | PD | |
| ALDH1A1 | SNV | Missense_Mutation | c.1492N>G | p.Gln498Glu | p.Q498E | P00352 | protein_coding | tolerated(0.19) | benign(0.001) | TCGA-DG-A2KM-01 | Cervix | cervical & endocervical cancer | Female | <65 | I/II | Chemotherapy | cisplatin | SD | |
| ALDH1A1 | SNV | Missense_Mutation | c.250N>A | p.Glu84Lys | p.E84K | P00352 | protein_coding | tolerated(0.18) | possibly_damaging(0.576) | TCGA-Q1-A5R2-01 | Cervix | cervical & endocervical cancer | Female | <65 | I/II | Chemotherapy | cisplatin | PR | |
| ALDH1A1 | SNV | Missense_Mutation | novel | c.1497N>C | p.Lys499Asn | p.K499N | P00352 | protein_coding | deleterious(0.02) | probably_damaging(1) | TCGA-VS-A958-01 | Cervix | cervical & endocervical cancer | Female | <65 | I/II | Chemotherapy | cisplatin | CR |
| ALDH1A1 | SNV | Missense_Mutation | c.1436N>T | p.Gly479Val | p.G479V | P00352 | protein_coding | deleterious(0) | probably_damaging(1) | TCGA-AA-3977-01 | Colorectum | colon adenocarcinoma | Male | >=65 | I/II | Unknown | Unknown | SD | |
| ALDH1A1 | SNV | Missense_Mutation | c.1145T>C | p.Val382Ala | p.V382A | P00352 | protein_coding | deleterious(0) | benign(0.16) | TCGA-AA-A010-01 | Colorectum | colon adenocarcinoma | Female | <65 | I/II | Chemotherapy | folinic | CR |
| Page: 1 2 3 4 5 6 |
Top |
Related drugs of malignant transformation related genes |
| Identification of chemicals and drugs interact with genes involved in malignant transfromation |
| (DGIdb 4.0) |
| Entrez ID | Symbol | Category | Interaction Types | Drug Claim Name | Drug Name | PMIDs |
| 216 | ALDH1A1 | DRUGGABLE GENOME, ENZYME | ROTTLERIN | ROTTLERIN | ||
| 216 | ALDH1A1 | DRUGGABLE GENOME, ENZYME | PIRINIXIC ACID | PIRINIXIC ACID | ||
| 216 | ALDH1A1 | DRUGGABLE GENOME, ENZYME | SU-4312 | CHEMBL328710 | ||
| 216 | ALDH1A1 | DRUGGABLE GENOME, ENZYME | CHLORAMPHENICOL | CHLORAMPHENICOL | ||
| 216 | ALDH1A1 | DRUGGABLE GENOME, ENZYME | N- (9-FLUORENYLMETHOXYCARBONYL)-L-LEUCINE | N- (9-FLUORENYLMETHOXYCARBONYL)-L-LEUCINE | ||
| 216 | ALDH1A1 | DRUGGABLE GENOME, ENZYME | SJ000111875 | CHEMBL590949 | ||
| 216 | ALDH1A1 | DRUGGABLE GENOME, ENZYME | ZM-449829 | CHEMBL154580 | ||
| 216 | ALDH1A1 | DRUGGABLE GENOME, ENZYME | ARACHIDONYL TRIFLUOROMETHYLKETONE | ARACHIDONYL TRIFLUOROMETHYLKETONE | ||
| 216 | ALDH1A1 | DRUGGABLE GENOME, ENZYME | BAY-11-7082 | CHEMBL403183 | ||
| 216 | ALDH1A1 | DRUGGABLE GENOME, ENZYME | DNDI1417809 | CHEMBL1442783 |
| Page: 1 2 3 4 5 6 7 8 9 10 11 12 13 14 15 16 17 18 19 20 21 22 23 24 25 26 27 28 29 30 31 32 33 34 35 36 37 38 39 40 |

Copyright 2023-Present -The University of Texas Health Science Center at Houston |