
|
|||||
|
 | |
| |
| |
| |
| |
| |
|
Gene: ACYP1 |
Gene summary for ACYP1 |
| Gene information | Species | Human | Gene symbol | ACYP1 | Gene ID | 97 |
| Gene name | acylphosphatase 1 | |
| Gene Alias | ACYPE | |
| Cytomap | 14q24.3 | |
| Gene Type | protein-coding | GO ID | GO:0006793 | UniProtAcc | P07311 |
Top |
Malignant transformation analysis |
| Identification of the aberrant gene expression in precancerous and cancerous lesions by comparing the gene expression of stem-like cells in diseased tissues with normal stem cells |
| Entrez ID | Symbol | Replicates | Species | Organ | Tissue | Adj P-value | Log2FC | Malignancy |
| 97 | ACYP1 | P47T-E | Human | Esophagus | ESCC | 5.94e-14 | 2.43e-01 | 0.1067 |
| 97 | ACYP1 | P48T-E | Human | Esophagus | ESCC | 1.10e-16 | 2.72e-01 | 0.0959 |
| 97 | ACYP1 | P49T-E | Human | Esophagus | ESCC | 3.29e-14 | 1.08e+00 | 0.1768 |
| 97 | ACYP1 | P52T-E | Human | Esophagus | ESCC | 1.38e-24 | 6.56e-01 | 0.1555 |
| 97 | ACYP1 | P54T-E | Human | Esophagus | ESCC | 1.60e-24 | 4.96e-01 | 0.0975 |
| 97 | ACYP1 | P56T-E | Human | Esophagus | ESCC | 1.28e-06 | 4.46e-01 | 0.1613 |
| 97 | ACYP1 | P57T-E | Human | Esophagus | ESCC | 1.54e-13 | 3.86e-01 | 0.0926 |
| 97 | ACYP1 | P61T-E | Human | Esophagus | ESCC | 2.16e-32 | 7.33e-01 | 0.099 |
| 97 | ACYP1 | P62T-E | Human | Esophagus | ESCC | 1.43e-31 | 4.61e-01 | 0.1302 |
| 97 | ACYP1 | P65T-E | Human | Esophagus | ESCC | 2.00e-21 | 3.66e-01 | 0.0978 |
| 97 | ACYP1 | P74T-E | Human | Esophagus | ESCC | 4.95e-33 | 8.62e-01 | 0.1479 |
| 97 | ACYP1 | P75T-E | Human | Esophagus | ESCC | 6.01e-24 | 5.94e-01 | 0.1125 |
| 97 | ACYP1 | P76T-E | Human | Esophagus | ESCC | 3.99e-18 | 4.32e-01 | 0.1207 |
| 97 | ACYP1 | P79T-E | Human | Esophagus | ESCC | 7.41e-07 | 2.51e-01 | 0.1154 |
| 97 | ACYP1 | P80T-E | Human | Esophagus | ESCC | 3.32e-15 | 3.96e-01 | 0.155 |
| 97 | ACYP1 | P82T-E | Human | Esophagus | ESCC | 7.67e-09 | 5.57e-01 | 0.1072 |
| 97 | ACYP1 | P83T-E | Human | Esophagus | ESCC | 3.69e-43 | 1.00e+00 | 0.1738 |
| 97 | ACYP1 | P84T-E | Human | Esophagus | ESCC | 1.44e-05 | 4.46e-01 | 0.0933 |
| 97 | ACYP1 | P89T-E | Human | Esophagus | ESCC | 6.49e-18 | 9.23e-01 | 0.1752 |
| 97 | ACYP1 | P91T-E | Human | Esophagus | ESCC | 1.58e-16 | 1.72e+00 | 0.1828 |
| Page: 1 2 3 4 5 |
| Tissue | Expression Dynamics | Abbreviation |
| Esophagus | 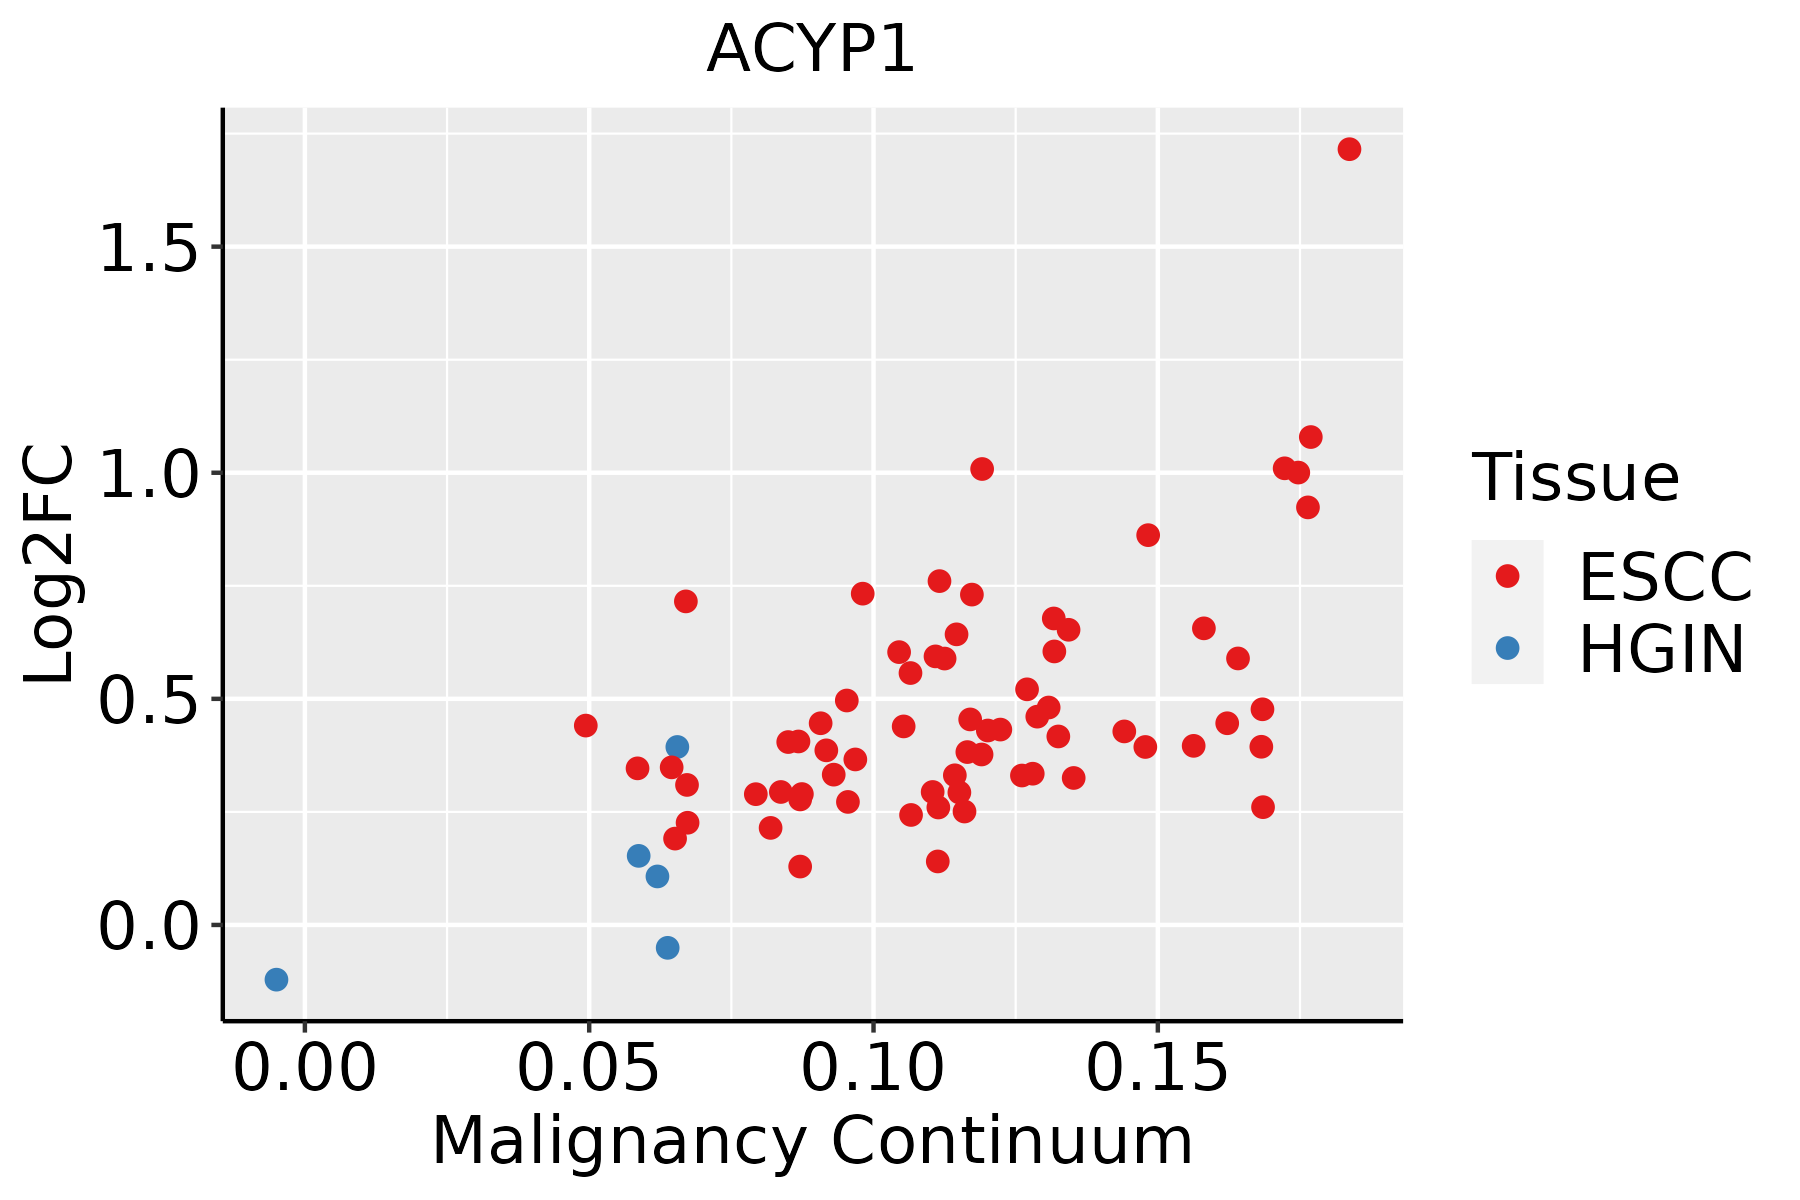 | ESCC: Esophageal squamous cell carcinoma |
| HGIN: High-grade intraepithelial neoplasias | ||
| LGIN: Low-grade intraepithelial neoplasias | ||
| Oral Cavity |  | EOLP: Erosive Oral lichen planus |
| LP: leukoplakia | ||
| NEOLP: Non-erosive oral lichen planus | ||
| OSCC: Oral squamous cell carcinoma | ||
| Skin | 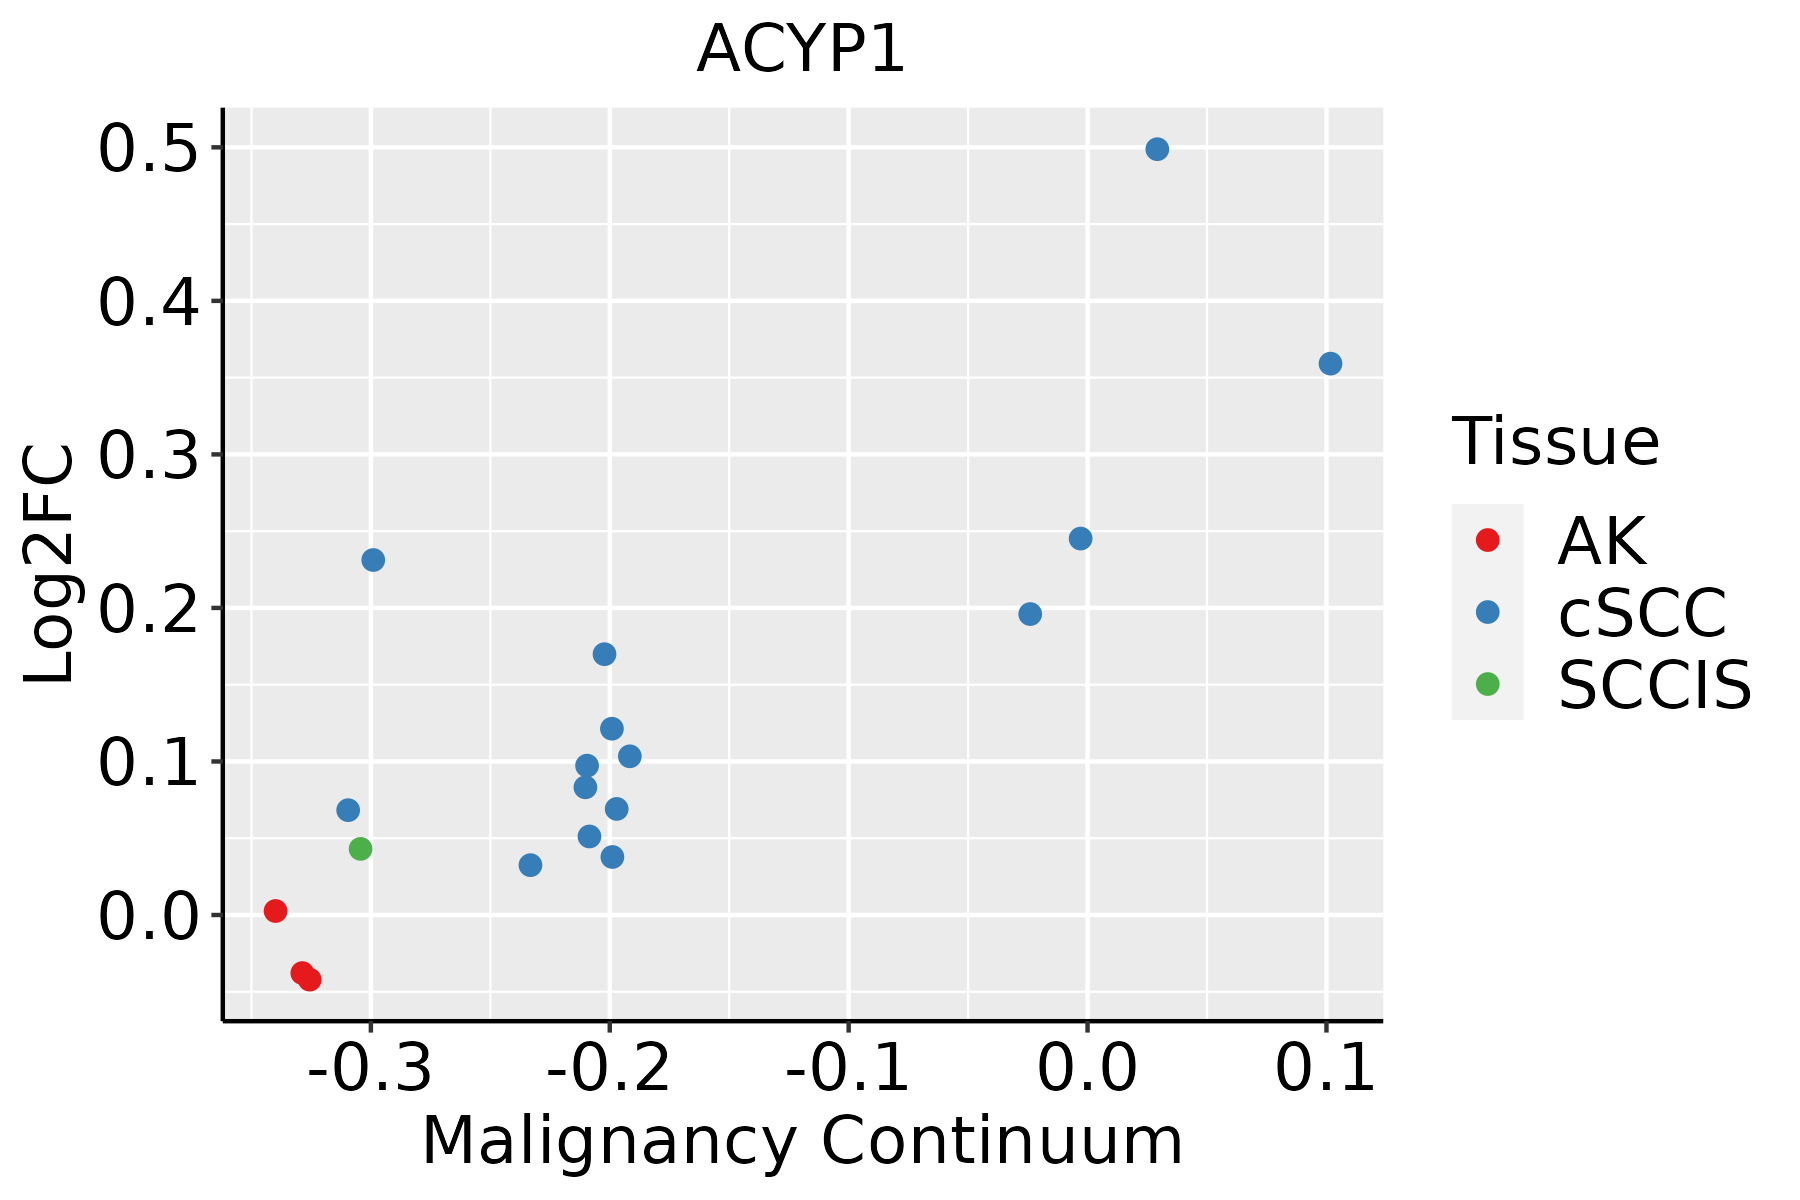 | AK: Actinic keratosis |
| cSCC: Cutaneous squamous cell carcinoma | ||
| SCCIS:squamous cell carcinoma in situ |
| ∗log2FC in expression of this searched gene in stem-like cells from each diseased tissue sample relative to stem-like cells in normal samples in each tissue plotted against the malignancy continuum. Samples are colored based on if they are from different disease stage. |
Top |
Malignant transformation related pathway analysis |
| Find out the enriched GO biological processes and KEGG pathways involved in transition from healthy to precancer to cancer |
| Tissue | Disease Stage | Enriched GO biological Processes |
| Colorectum | AD |  |
| Colorectum | SER |  |
| Colorectum | MSS |  |
| Colorectum | MSI-H |  |
| Colorectum | FAP |  |
| ∗Top 15 enriched GO BP terms are showed in the bar plot of each disease state in each tissue. Each row represents a significant GO biological process which is colored according to the -log10(p.adjust). |
| Page: 1 2 3 4 5 6 7 8 9 |
| GO ID | Tissue | Disease Stage | Description | Gene Ratio | Bg Ratio | pvalue | p.adjust | Count |
| Page: 1 |
| Pathway ID | Tissue | Disease Stage | Description | Gene Ratio | Bg Ratio | pvalue | p.adjust | qvalue | Count |
| hsa0062023 | Esophagus | ESCC | Pyruvate metabolism | 32/4205 | 47/8465 | 8.11e-03 | 1.94e-02 | 9.94e-03 | 32 |
| hsa0062033 | Esophagus | ESCC | Pyruvate metabolism | 32/4205 | 47/8465 | 8.11e-03 | 1.94e-02 | 9.94e-03 | 32 |
| hsa006209 | Oral cavity | OSCC | Pyruvate metabolism | 31/3704 | 47/8465 | 1.74e-03 | 4.73e-03 | 2.41e-03 | 31 |
| hsa0062012 | Oral cavity | OSCC | Pyruvate metabolism | 31/3704 | 47/8465 | 1.74e-03 | 4.73e-03 | 2.41e-03 | 31 |
| Page: 1 |
Top |
Cell-cell communication analysis |
| Identification of potential cell-cell interactions between two cell types and their ligand-receptor pairs for different disease states |
| Ligand | Receptor | LRpair | Pathway | Tissue | Disease Stage |
| Page: 1 |
Top |
Single-cell gene regulatory network inference analysis |
| Find out the significant the regulons (TFs) and the target genes of each regulon across cell types for different disease states |
| TF | Cell Type | Tissue | Disease Stage | Target Gene | RSS | Regulon Activity |
| ∗The dot plots of a searched regulon are shown for all cell subpopulations in each disease state of each tissue based on the regulon specific score inferred using pySCENIC and by calculating the average expression. |
| Page: 1 |
Top |
Somatic mutation of malignant transformation related genes |
| Annotation of somatic variants for genes involved in malignant transformation |
| Hugo Symbol | Variant Class | Variant Classification | dbSNP RS | HGVSc | HGVSp | HGVSp Short | SWISSPROT | BIOTYPE | SIFT | PolyPhen | Tumor Sample Barcode | Tissue | Histology | Sex | Age | Stage | Therapy Types | Drugs | Outcome |
| ACYP1 | SNV | Missense_Mutation | c.172N>G | p.Gln58Glu | p.Q58E | protein_coding | tolerated(0.98) | benign(0.076) | TCGA-AC-A23H-01 | Breast | breast invasive carcinoma | Female | >=65 | I/II | Unknown | Unknown | PD | ||
| ACYP1 | SNV | Missense_Mutation | rs768589082 | c.223N>T | p.Arg75Trp | p.R75W | protein_coding | deleterious(0) | possibly_damaging(0.827) | TCGA-BH-A18L-01 | Breast | breast invasive carcinoma | Female | <65 | III/IV | Unknown | Unknown | SD | |
| ACYP1 | SNV | Missense_Mutation | c.129N>C | p.Glu43Asp | p.E43D | protein_coding | deleterious(0) | probably_damaging(0.991) | TCGA-AG-3892-01 | Colorectum | rectum adenocarcinoma | Female | <65 | I/II | Unknown | Unknown | SD | ||
| ACYP1 | SNV | Missense_Mutation | rs113807807 | c.319N>A | p.Asp107Asn | p.D107N | protein_coding | deleterious(0.01) | benign(0.22) | TCGA-AJ-A3EL-01 | Endometrium | uterine corpus endometrioid carcinoma | Female | <65 | I/II | Unknown | Unknown | SD | |
| ACYP1 | SNV | Missense_Mutation | c.118N>A | p.Val40Met | p.V40M | protein_coding | deleterious(0) | probably_damaging(0.995) | TCGA-AP-A059-01 | Endometrium | uterine corpus endometrioid carcinoma | Female | >=65 | I/II | Unknown | Unknown | SD | ||
| ACYP1 | SNV | Missense_Mutation | novel | c.260N>A | p.Ser87Tyr | p.S87Y | protein_coding | deleterious(0.01) | benign(0.254) | TCGA-AP-A0LM-01 | Endometrium | uterine corpus endometrioid carcinoma | Female | <65 | III/IV | Chemotherapy | cisplatin | SD | |
| ACYP1 | SNV | Missense_Mutation | c.129N>C | p.Glu43Asp | p.E43D | protein_coding | deleterious(0) | probably_damaging(0.991) | TCGA-B5-A1MR-01 | Endometrium | uterine corpus endometrioid carcinoma | Female | >=65 | III/IV | Unknown | Unknown | SD | ||
| ACYP1 | SNV | Missense_Mutation | c.175N>A | p.Ala59Thr | p.A59T | protein_coding | tolerated(0.37) | benign(0.02) | TCGA-BS-A0UV-01 | Endometrium | uterine corpus endometrioid carcinoma | Female | <65 | III/IV | Unknown | Unknown | SD | ||
| ACYP1 | insertion | Frame_Shift_Ins | novel | c.387dupA | p.Ter130IlefsTer4 | p.*130Ifs*4 | protein_coding | TCGA-AX-A0J1-01 | Endometrium | uterine corpus endometrioid carcinoma | Female | >=65 | I/II | Unknown | Unknown | SD | |||
| ACYP1 | SNV | Missense_Mutation | novel | c.274A>G | p.Met92Val | p.M92V | protein_coding | deleterious(0.03) | probably_damaging(0.944) | TCGA-D6-6517-01 | Oral cavity | head & neck squamous cell carcinoma | Male | <65 | III/IV | Chemotherapy | methotrexate | SD |
| Page: 1 2 |
Top |
Related drugs of malignant transformation related genes |
| Identification of chemicals and drugs interact with genes involved in malignant transfromation |
| (DGIdb 4.0) |
| Entrez ID | Symbol | Category | Interaction Types | Drug Claim Name | Drug Name | PMIDs |
| Page: 1 |

Copyright 2023-Present -The University of Texas Health Science Center at Houston |