
|
|||||
|
 | |
| |
| |
| |
| |
| |
|
Gene: ACTN4 |
Gene summary for ACTN4 |
| Gene information | Species | Human | Gene symbol | ACTN4 | Gene ID | 81 |
| Gene name | actinin alpha 4 | |
| Gene Alias | ACTININ-4 | |
| Cytomap | 19q13.2 | |
| Gene Type | protein-coding | GO ID | GO:0000902 | UniProtAcc | A0A0S2Z3G9 |
Top |
Malignant transformation analysis |
| Identification of the aberrant gene expression in precancerous and cancerous lesions by comparing the gene expression of stem-like cells in diseased tissues with normal stem cells |
| Entrez ID | Symbol | Replicates | Species | Organ | Tissue | Adj P-value | Log2FC | Malignancy |
| 81 | ACTN4 | A015-C-006 | Human | Colorectum | FAP | 6.41e-23 | -1.85e-01 | -0.0994 |
| 81 | ACTN4 | A015-C-106 | Human | Colorectum | FAP | 3.05e-13 | -2.06e-02 | -0.0511 |
| 81 | ACTN4 | A002-C-114 | Human | Colorectum | FAP | 4.94e-24 | -1.79e-01 | -0.1561 |
| 81 | ACTN4 | A015-C-104 | Human | Colorectum | FAP | 1.14e-35 | -1.64e-01 | -0.1899 |
| 81 | ACTN4 | A001-C-014 | Human | Colorectum | FAP | 1.34e-18 | -1.89e-01 | 0.0135 |
| 81 | ACTN4 | A002-C-016 | Human | Colorectum | FAP | 5.60e-27 | -2.60e-01 | 0.0521 |
| 81 | ACTN4 | A015-C-002 | Human | Colorectum | FAP | 3.05e-16 | -2.77e-01 | -0.0763 |
| 81 | ACTN4 | A001-C-203 | Human | Colorectum | FAP | 9.41e-12 | -1.32e-01 | -0.0481 |
| 81 | ACTN4 | A002-C-116 | Human | Colorectum | FAP | 3.33e-41 | -4.79e-01 | -0.0452 |
| 81 | ACTN4 | A014-C-008 | Human | Colorectum | FAP | 8.28e-20 | -4.16e-01 | -0.191 |
| 81 | ACTN4 | A018-E-020 | Human | Colorectum | FAP | 5.89e-27 | -2.72e-01 | -0.2034 |
| 81 | ACTN4 | F034 | Human | Colorectum | FAP | 6.98e-26 | -4.64e-01 | -0.0665 |
| 81 | ACTN4 | F072B | Human | Colorectum | FAP | 8.71e-04 | -1.01e-01 | 0.257 |
| 81 | ACTN4 | CRC-1-8810 | Human | Colorectum | CRC | 2.58e-02 | 8.20e-02 | 0.6257 |
| 81 | ACTN4 | CRC-3-11773 | Human | Colorectum | CRC | 4.03e-09 | 1.77e-01 | 0.2564 |
| 81 | ACTN4 | AEH-subject1 | Human | Endometrium | AEH | 1.84e-23 | 5.21e-01 | -0.3059 |
| 81 | ACTN4 | AEH-subject2 | Human | Endometrium | AEH | 3.37e-26 | 4.73e-01 | -0.2525 |
| 81 | ACTN4 | AEH-subject3 | Human | Endometrium | AEH | 2.22e-17 | 2.78e-01 | -0.2576 |
| 81 | ACTN4 | AEH-subject4 | Human | Endometrium | AEH | 1.20e-18 | 4.32e-01 | -0.2657 |
| 81 | ACTN4 | AEH-subject5 | Human | Endometrium | AEH | 1.81e-19 | 5.39e-01 | -0.2953 |
| Page: 1 2 3 4 5 6 7 8 9 10 11 12 13 14 |
| Tissue | Expression Dynamics | Abbreviation |
| Cervix |  | CC: Cervix cancer |
| HSIL_HPV: HPV-infected high-grade squamous intraepithelial lesions | ||
| N_HPV: HPV-infected normal cervix | ||
| Colorectum (GSE201348) |  | FAP: Familial adenomatous polyposis |
| CRC: Colorectal cancer | ||
| Colorectum (HTA11) |  | AD: Adenomas |
| SER: Sessile serrated lesions | ||
| MSI-H: Microsatellite-high colorectal cancer | ||
| MSS: Microsatellite stable colorectal cancer | ||
| Endometrium | 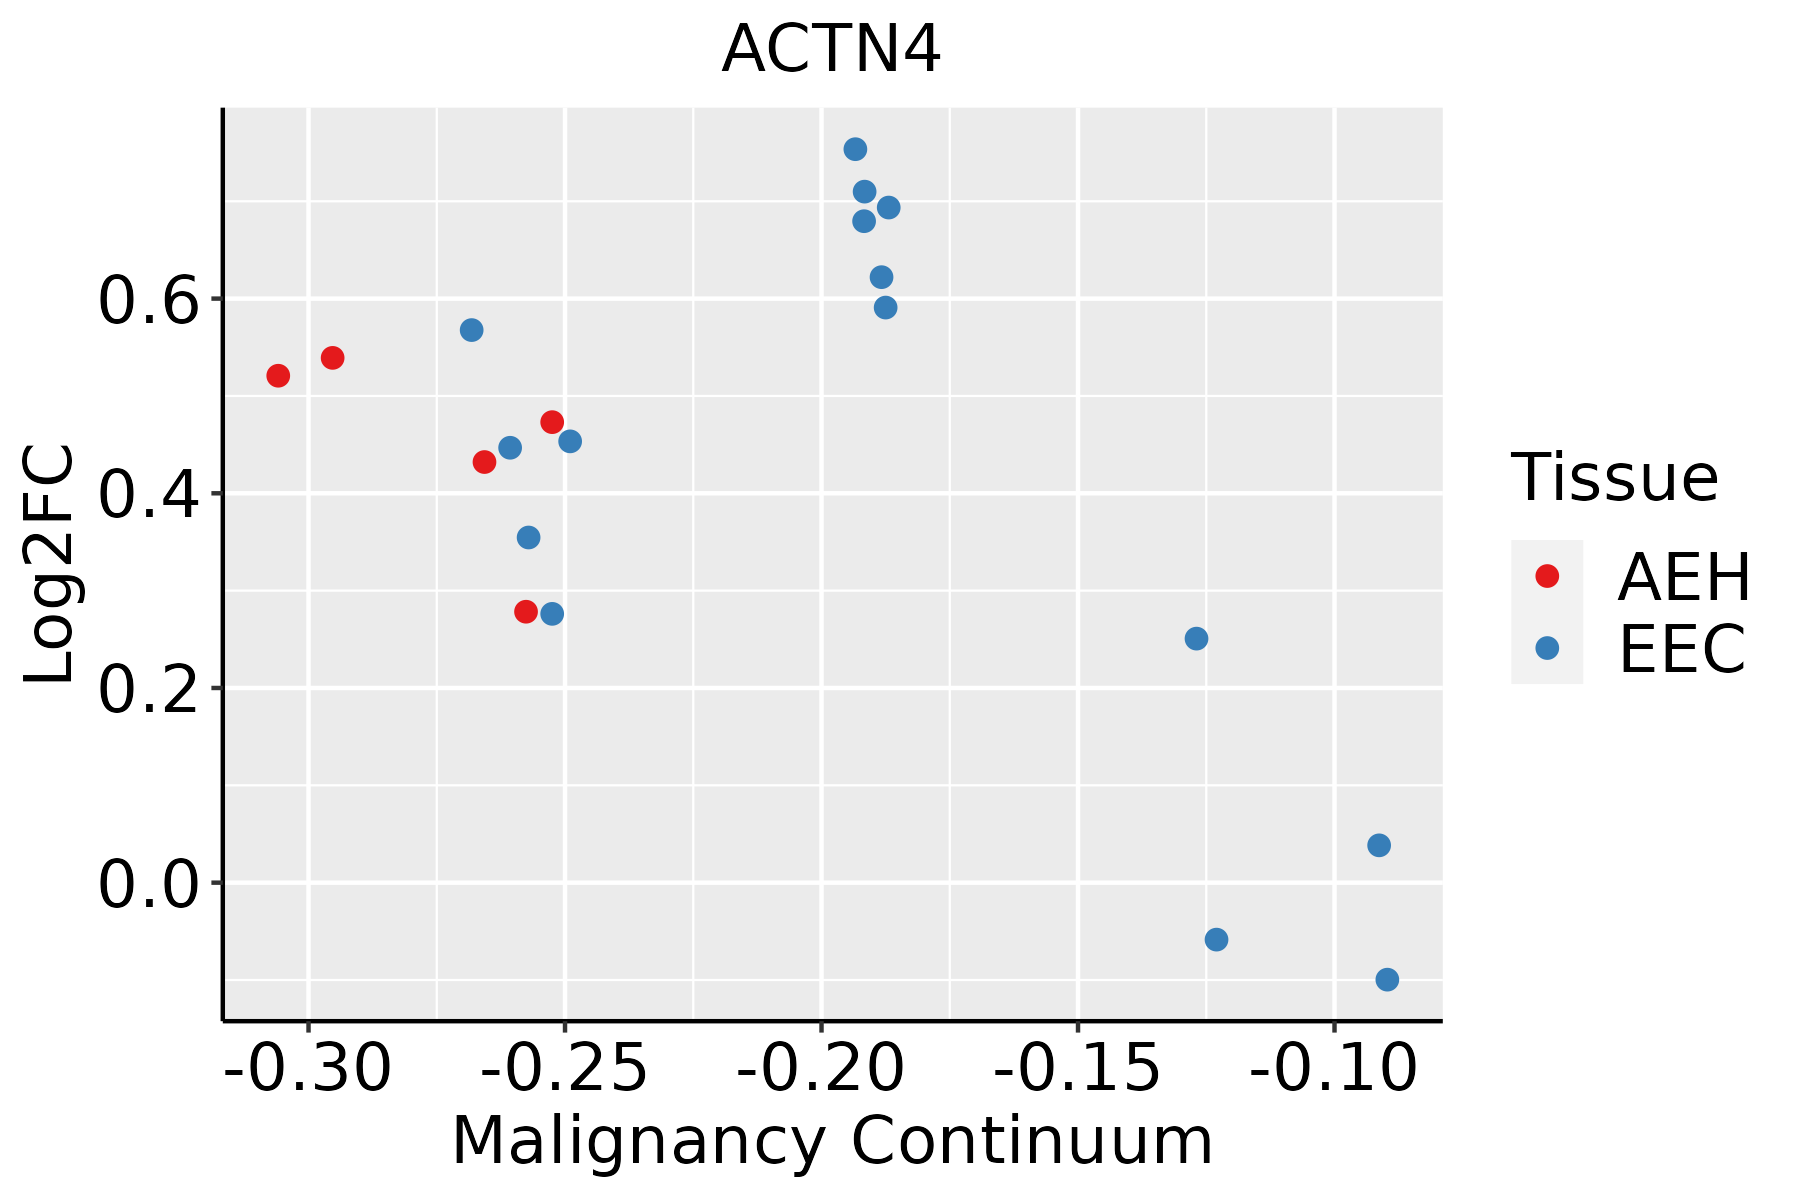 | AEH: Atypical endometrial hyperplasia |
| EEC: Endometrioid Cancer | ||
| Esophagus |  | ESCC: Esophageal squamous cell carcinoma |
| HGIN: High-grade intraepithelial neoplasias | ||
| LGIN: Low-grade intraepithelial neoplasias | ||
| GC | 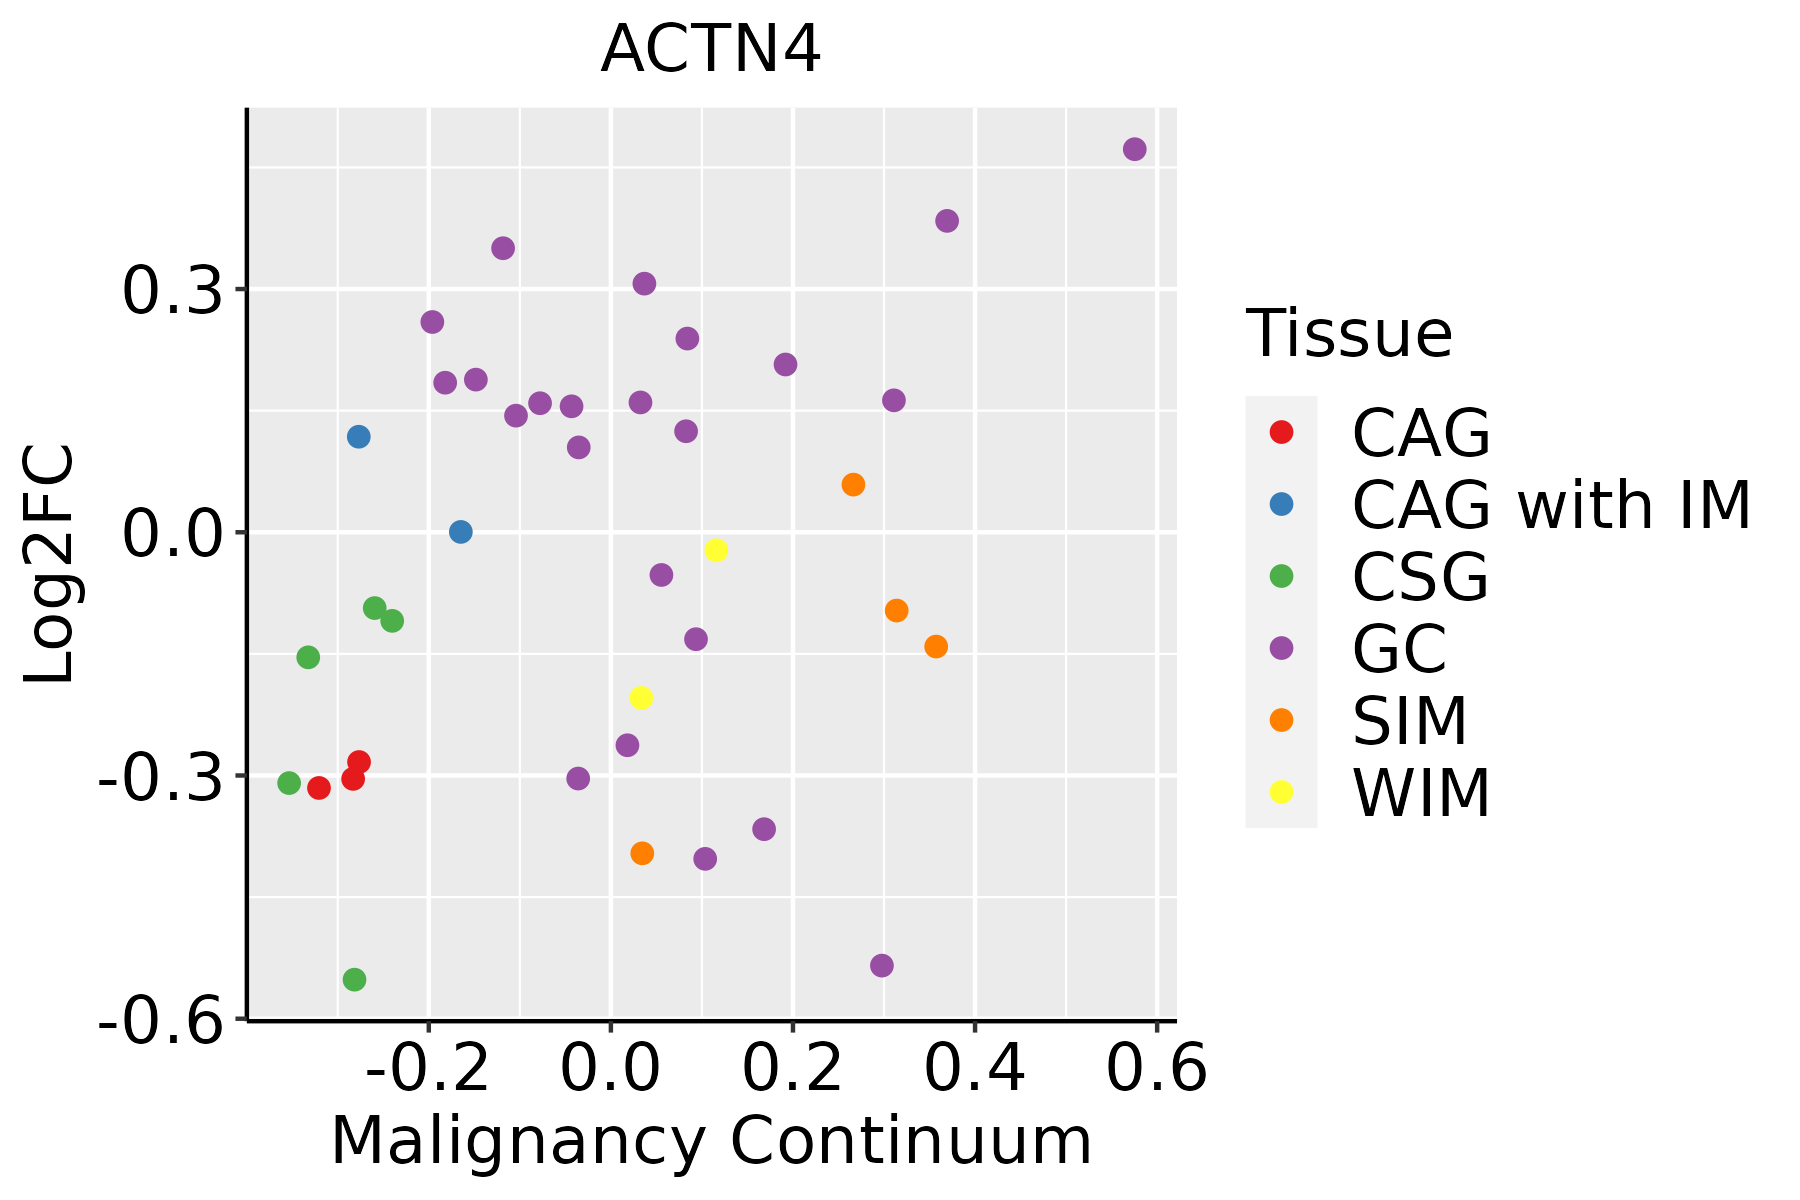 | CAG: Chronic atrophic gastritis |
| CAG with IM: Chronic atrophic gastritis with intestinal metaplasia | ||
| CSG: Chronic superficial gastritis | ||
| GC: Gastric cancer | ||
| SIM: Severe intestinal metaplasia | ||
| WIM: Wild intestinal metaplasia | ||
| Liver | 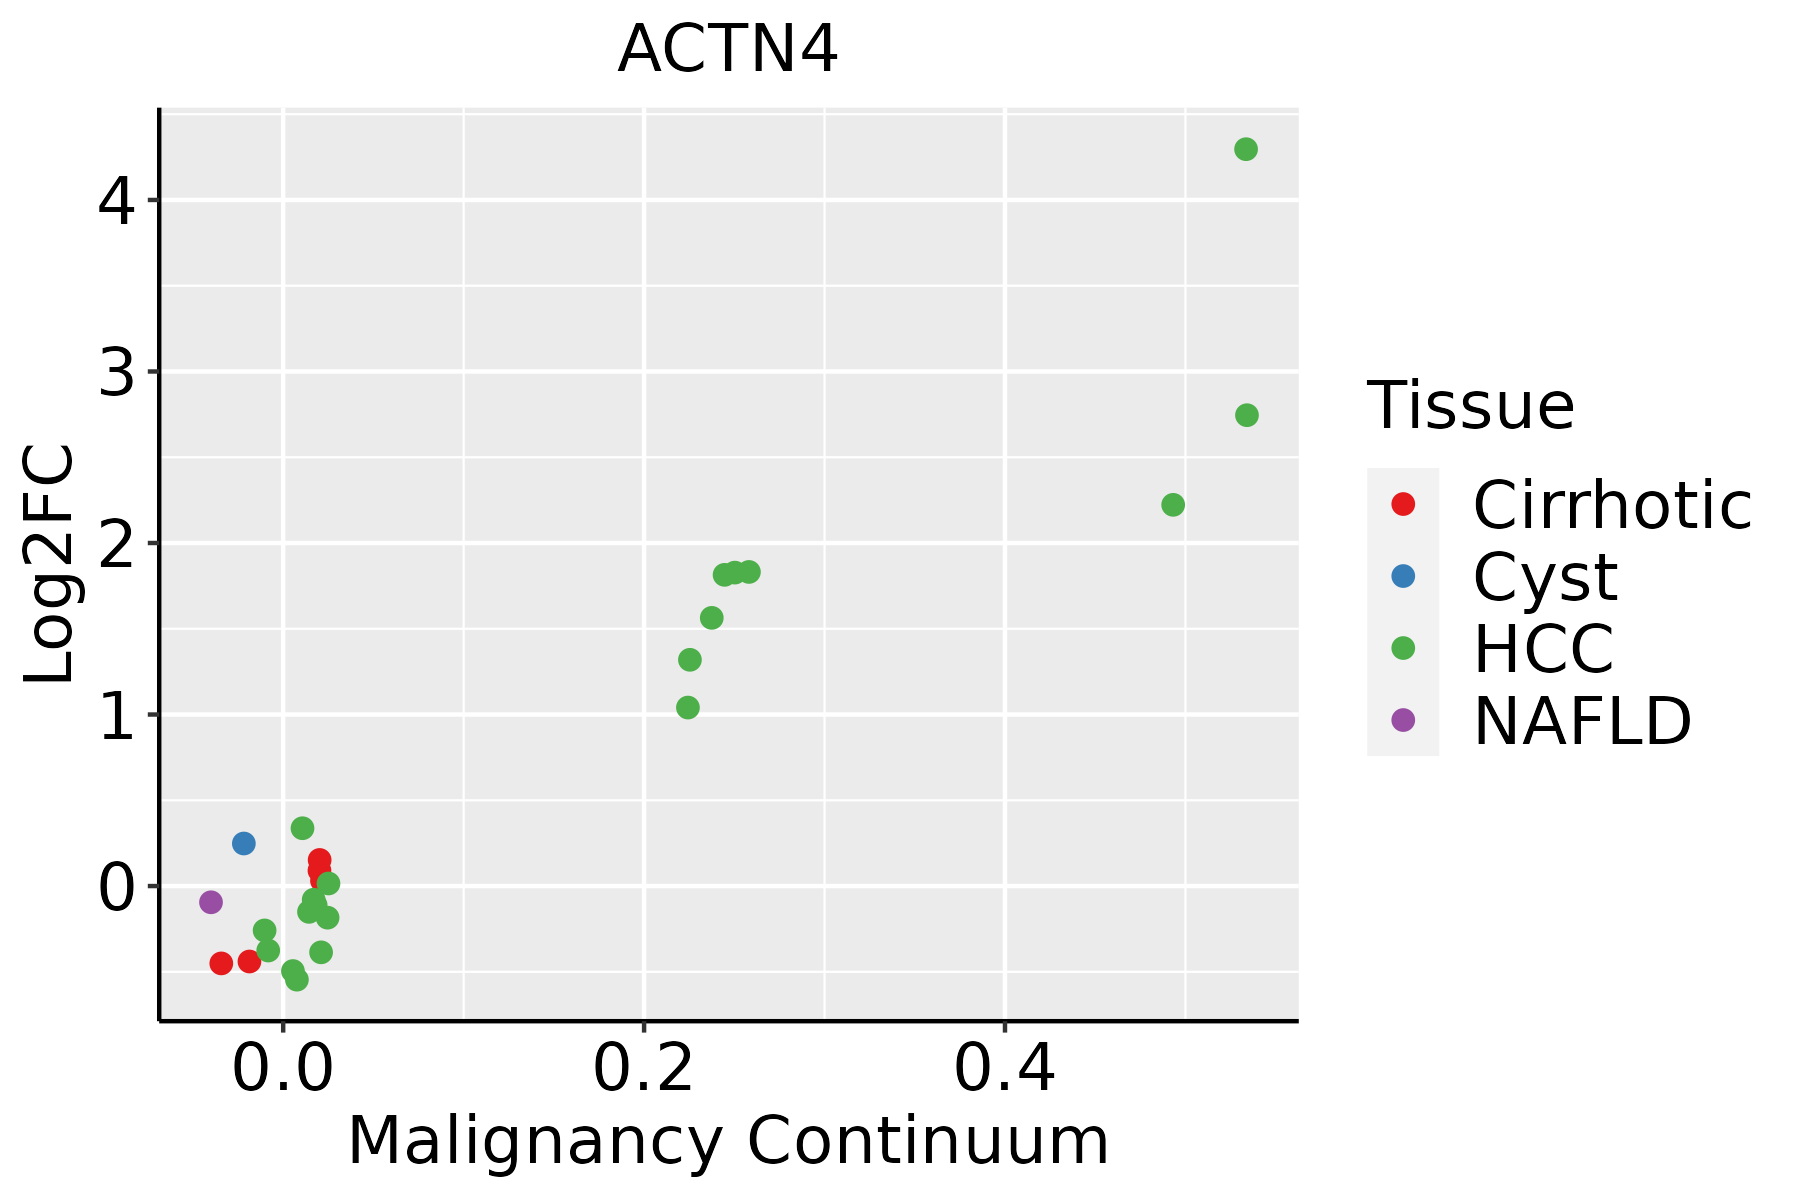 | HCC: Hepatocellular carcinoma |
| NAFLD: Non-alcoholic fatty liver disease | ||
| Oral Cavity |  | EOLP: Erosive Oral lichen planus |
| LP: leukoplakia | ||
| NEOLP: Non-erosive oral lichen planus | ||
| OSCC: Oral squamous cell carcinoma | ||
| Prostate | 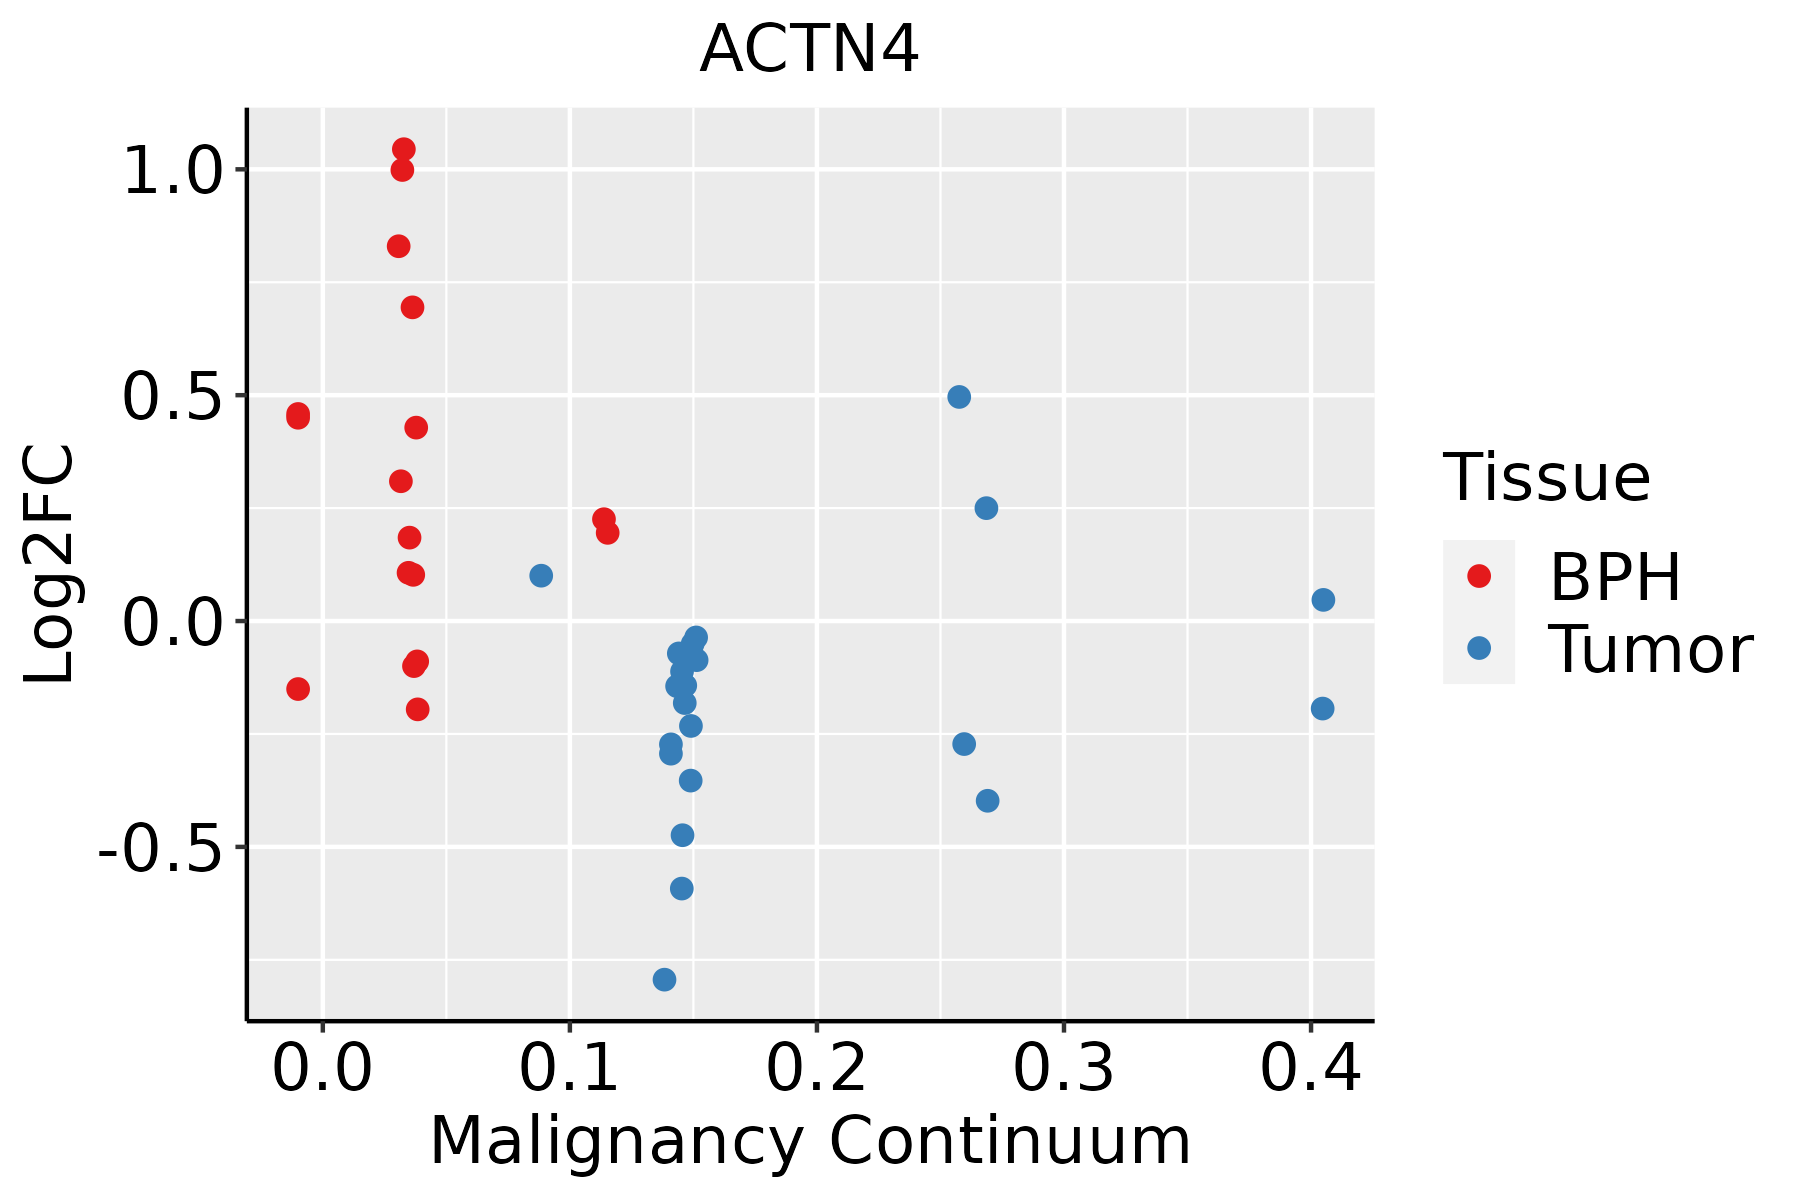 | BPH: Benign Prostatic Hyperplasia |
| Skin |  | AK: Actinic keratosis |
| cSCC: Cutaneous squamous cell carcinoma | ||
| SCCIS:squamous cell carcinoma in situ | ||
| Thyroid | 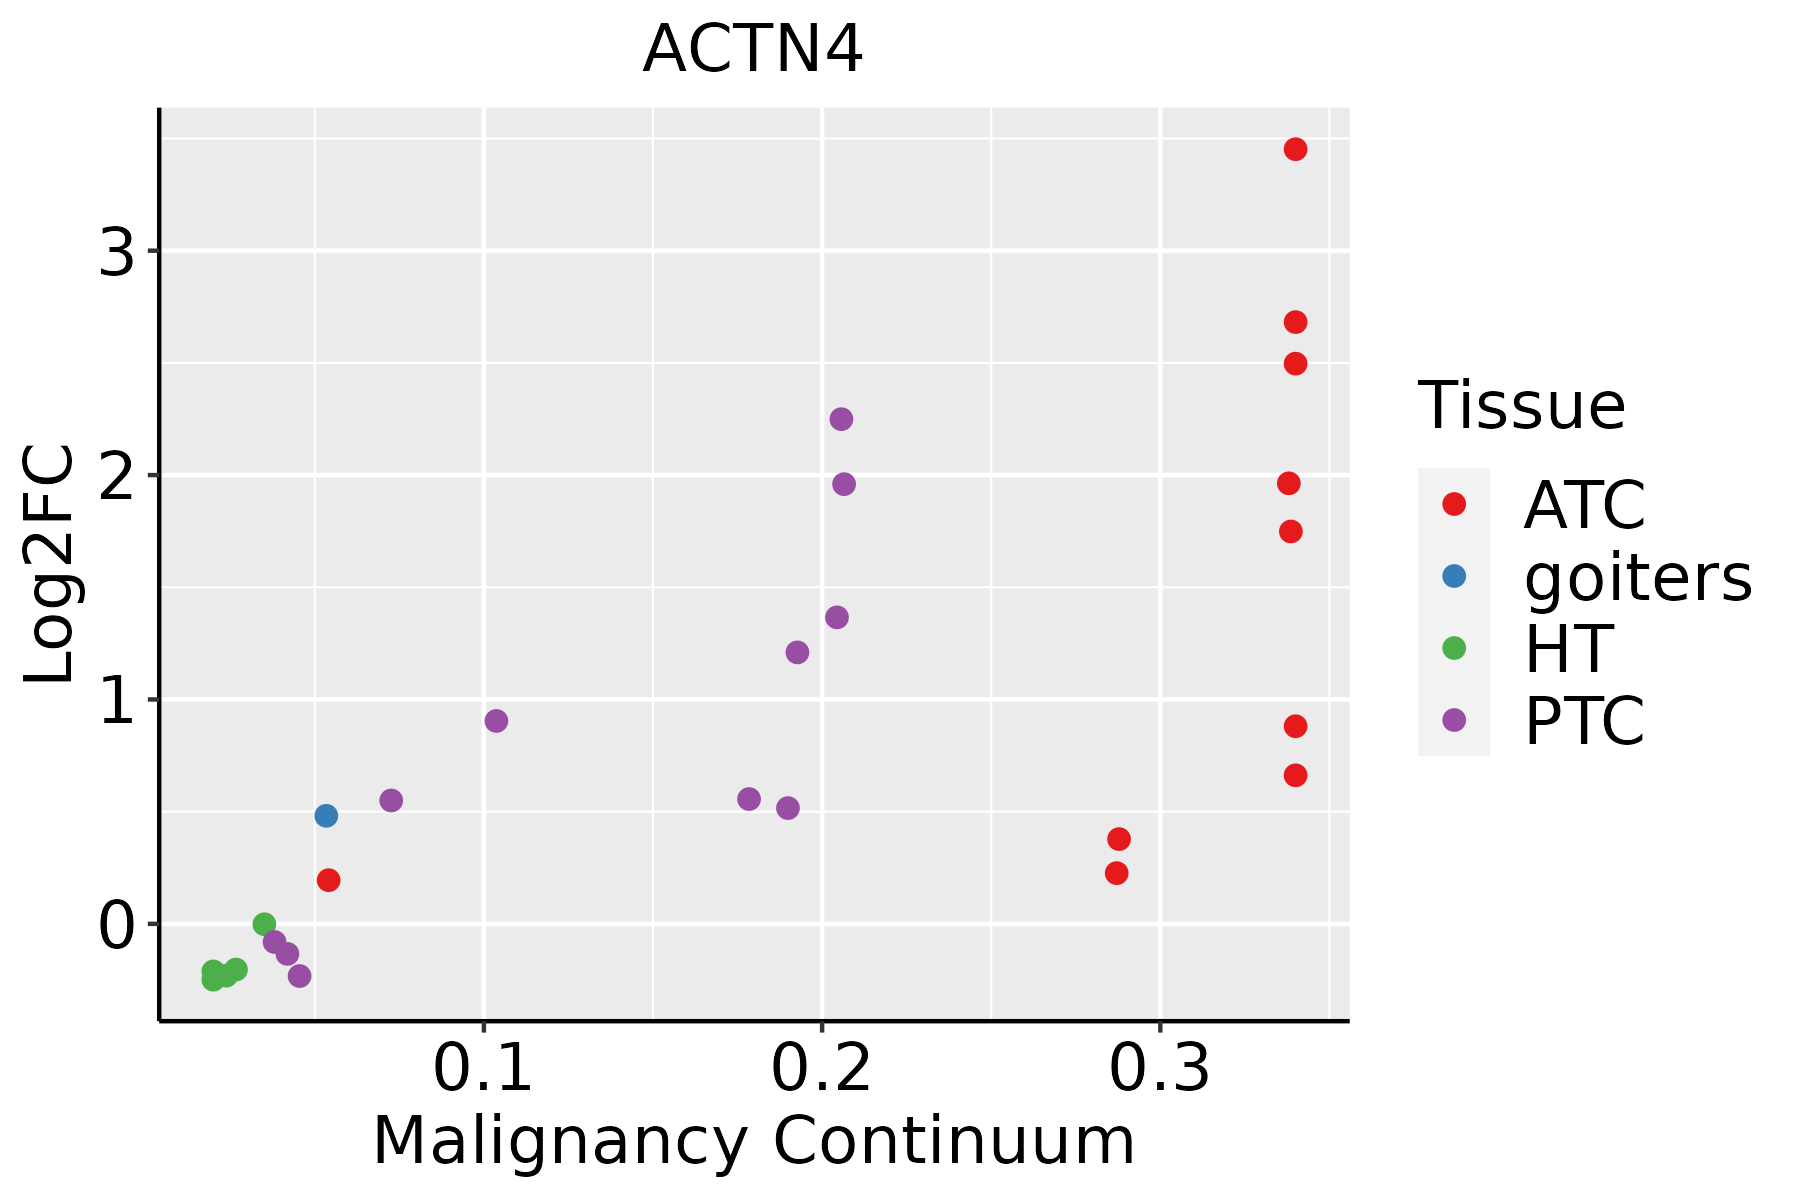 | ATC: Anaplastic thyroid cancer |
| HT: Hashimoto's thyroiditis | ||
| PTC: Papillary thyroid cancer |
| ∗log2FC in expression of this searched gene in stem-like cells from each diseased tissue sample relative to stem-like cells in normal samples in each tissue plotted against the malignancy continuum. Samples are colored based on if they are from different disease stage. |
Top |
Malignant transformation related pathway analysis |
| Find out the enriched GO biological processes and KEGG pathways involved in transition from healthy to precancer to cancer |
| Tissue | Disease Stage | Enriched GO biological Processes |
| Colorectum | AD |  |
| Colorectum | SER |  |
| Colorectum | MSS |  |
| Colorectum | MSI-H |  |
| Colorectum | FAP |  |
| ∗Top 15 enriched GO BP terms are showed in the bar plot of each disease state in each tissue. Each row represents a significant GO biological process which is colored according to the -log10(p.adjust). |
| Page: 1 2 3 4 5 6 7 8 9 |
| GO ID | Tissue | Disease Stage | Description | Gene Ratio | Bg Ratio | pvalue | p.adjust | Count |
| GO:001081010 | Cervix | CC | regulation of cell-substrate adhesion | 69/2311 | 221/18723 | 8.57e-14 | 5.69e-11 | 69 |
| GO:00315898 | Cervix | CC | cell-substrate adhesion | 96/2311 | 363/18723 | 1.48e-13 | 8.85e-11 | 96 |
| GO:002260410 | Cervix | CC | regulation of cell morphogenesis | 84/2311 | 309/18723 | 1.00e-12 | 4.29e-10 | 84 |
| GO:00071626 | Cervix | CC | negative regulation of cell adhesion | 72/2311 | 303/18723 | 2.36e-08 | 1.70e-06 | 72 |
| GO:19000249 | Cervix | CC | regulation of substrate adhesion-dependent cell spreading | 23/2311 | 57/18723 | 8.94e-08 | 5.04e-06 | 23 |
| GO:00107699 | Cervix | CC | regulation of cell morphogenesis involved in differentiation | 31/2311 | 96/18723 | 2.43e-07 | 1.05e-05 | 31 |
| GO:00344469 | Cervix | CC | substrate adhesion-dependent cell spreading | 32/2311 | 108/18723 | 1.36e-06 | 4.55e-05 | 32 |
| GO:00305229 | Cervix | CC | intracellular receptor signaling pathway | 60/2311 | 265/18723 | 1.89e-06 | 5.97e-05 | 60 |
| GO:19026009 | Cervix | CC | proton transmembrane transport | 39/2311 | 157/18723 | 1.23e-05 | 2.57e-04 | 39 |
| GO:00346129 | Cervix | CC | response to tumor necrosis factor | 55/2311 | 253/18723 | 1.75e-05 | 3.32e-04 | 55 |
| GO:00713569 | Cervix | CC | cellular response to tumor necrosis factor | 51/2311 | 229/18723 | 1.75e-05 | 3.32e-04 | 51 |
| GO:00516567 | Cervix | CC | establishment of organelle localization | 76/2311 | 390/18723 | 3.17e-05 | 5.21e-04 | 76 |
| GO:00108122 | Cervix | CC | negative regulation of cell-substrate adhesion | 21/2311 | 68/18723 | 4.35e-05 | 6.66e-04 | 21 |
| GO:00192213 | Cervix | CC | cytokine-mediated signaling pathway | 84/2311 | 472/18723 | 3.25e-04 | 3.44e-03 | 84 |
| GO:19023059 | Cervix | CC | regulation of sodium ion transmembrane transport | 19/2311 | 68/18723 | 4.21e-04 | 4.25e-03 | 19 |
| GO:00107712 | Cervix | CC | negative regulation of cell morphogenesis involved in differentiation | 7/2311 | 14/18723 | 6.73e-04 | 6.17e-03 | 7 |
| GO:19000252 | Cervix | CC | negative regulation of substrate adhesion-dependent cell spreading | 7/2311 | 14/18723 | 6.73e-04 | 6.17e-03 | 7 |
| GO:00300487 | Cervix | CC | actin filament-based movement | 29/2311 | 127/18723 | 6.91e-04 | 6.33e-03 | 29 |
| GO:00307057 | Cervix | CC | cytoskeleton-dependent intracellular transport | 40/2311 | 195/18723 | 7.92e-04 | 6.99e-03 | 40 |
| GO:00426924 | Cervix | CC | muscle cell differentiation | 69/2311 | 384/18723 | 8.12e-04 | 7.09e-03 | 69 |
| Page: 1 2 3 4 5 6 7 8 9 10 11 12 13 14 15 16 17 18 19 20 21 22 23 24 25 26 27 28 29 30 31 32 33 34 35 36 |
| Pathway ID | Tissue | Disease Stage | Description | Gene Ratio | Bg Ratio | pvalue | p.adjust | qvalue | Count |
| hsa0513120 | Cervix | CC | Shigellosis | 69/1267 | 247/8465 | 7.64e-08 | 1.03e-06 | 6.10e-07 | 69 |
| hsa0451010 | Cervix | CC | Focal adhesion | 59/1267 | 203/8465 | 1.53e-07 | 1.84e-06 | 1.09e-06 | 59 |
| hsa0481016 | Cervix | CC | Regulation of actin cytoskeleton | 64/1267 | 229/8465 | 2.24e-07 | 2.59e-06 | 1.53e-06 | 64 |
| hsa0452020 | Cervix | CC | Adherens junction | 33/1267 | 93/8465 | 6.99e-07 | 7.31e-06 | 4.32e-06 | 33 |
| hsa0453020 | Cervix | CC | Tight junction | 49/1267 | 169/8465 | 1.87e-06 | 1.78e-05 | 1.05e-05 | 49 |
| hsa0467020 | Cervix | CC | Leukocyte transendothelial migration | 36/1267 | 114/8465 | 5.22e-06 | 4.83e-05 | 2.86e-05 | 36 |
| hsa05131110 | Cervix | CC | Shigellosis | 69/1267 | 247/8465 | 7.64e-08 | 1.03e-06 | 6.10e-07 | 69 |
| hsa0451014 | Cervix | CC | Focal adhesion | 59/1267 | 203/8465 | 1.53e-07 | 1.84e-06 | 1.09e-06 | 59 |
| hsa0481017 | Cervix | CC | Regulation of actin cytoskeleton | 64/1267 | 229/8465 | 2.24e-07 | 2.59e-06 | 1.53e-06 | 64 |
| hsa04520110 | Cervix | CC | Adherens junction | 33/1267 | 93/8465 | 6.99e-07 | 7.31e-06 | 4.32e-06 | 33 |
| hsa04530110 | Cervix | CC | Tight junction | 49/1267 | 169/8465 | 1.87e-06 | 1.78e-05 | 1.05e-05 | 49 |
| hsa04670110 | Cervix | CC | Leukocyte transendothelial migration | 36/1267 | 114/8465 | 5.22e-06 | 4.83e-05 | 2.86e-05 | 36 |
| hsa0513145 | Cervix | N_HPV | Shigellosis | 23/349 | 247/8465 | 2.10e-04 | 1.75e-03 | 1.37e-03 | 23 |
| hsa0453025 | Cervix | N_HPV | Tight junction | 16/349 | 169/8465 | 1.60e-03 | 1.01e-02 | 7.92e-03 | 16 |
| hsa0467045 | Cervix | N_HPV | Leukocyte transendothelial migration | 12/349 | 114/8465 | 2.50e-03 | 1.45e-02 | 1.13e-02 | 12 |
| hsa0513155 | Cervix | N_HPV | Shigellosis | 23/349 | 247/8465 | 2.10e-04 | 1.75e-03 | 1.37e-03 | 23 |
| hsa0453035 | Cervix | N_HPV | Tight junction | 16/349 | 169/8465 | 1.60e-03 | 1.01e-02 | 7.92e-03 | 16 |
| hsa0467055 | Cervix | N_HPV | Leukocyte transendothelial migration | 12/349 | 114/8465 | 2.50e-03 | 1.45e-02 | 1.13e-02 | 12 |
| hsa05131 | Colorectum | AD | Shigellosis | 109/2092 | 247/8465 | 1.09e-11 | 2.44e-10 | 1.55e-10 | 109 |
| hsa04520 | Colorectum | AD | Adherens junction | 50/2092 | 93/8465 | 1.52e-09 | 2.83e-08 | 1.81e-08 | 50 |
| Page: 1 2 3 4 5 6 7 8 9 10 11 12 13 14 |
Top |
Cell-cell communication analysis |
| Identification of potential cell-cell interactions between two cell types and their ligand-receptor pairs for different disease states |
| Ligand | Receptor | LRpair | Pathway | Tissue | Disease Stage |
| Page: 1 |
Top |
Single-cell gene regulatory network inference analysis |
| Find out the significant the regulons (TFs) and the target genes of each regulon across cell types for different disease states |
| TF | Cell Type | Tissue | Disease Stage | Target Gene | RSS | Regulon Activity |
| ∗The dot plots of a searched regulon are shown for all cell subpopulations in each disease state of each tissue based on the regulon specific score inferred using pySCENIC and by calculating the average expression. |
| Page: 1 |
Top |
Somatic mutation of malignant transformation related genes |
| Annotation of somatic variants for genes involved in malignant transformation |
| Hugo Symbol | Variant Class | Variant Classification | dbSNP RS | HGVSc | HGVSp | HGVSp Short | SWISSPROT | BIOTYPE | SIFT | PolyPhen | Tumor Sample Barcode | Tissue | Histology | Sex | Age | Stage | Therapy Types | Drugs | Outcome |
| ACTN4 | SNV | Missense_Mutation | novel | c.2245N>A | p.Glu749Lys | p.E749K | O43707 | protein_coding | deleterious(0) | probably_damaging(0.989) | TCGA-A8-A09G-01 | Breast | breast invasive carcinoma | Female | >=65 | III/IV | Unknown | Unknown | SD |
| ACTN4 | SNV | Missense_Mutation | rs752211925 | c.1093N>T | p.Arg365Cys | p.R365C | O43707 | protein_coding | deleterious(0.02) | benign(0.313) | TCGA-AN-A0AK-01 | Breast | breast invasive carcinoma | Female | >=65 | I/II | Unknown | Unknown | SD |
| ACTN4 | SNV | Missense_Mutation | c.1210N>C | p.Glu404Gln | p.E404Q | O43707 | protein_coding | deleterious(0.01) | benign(0.347) | TCGA-AR-A1AI-01 | Breast | breast invasive carcinoma | Female | <65 | I/II | Chemotherapy | cytoxan | PD | |
| ACTN4 | SNV | Missense_Mutation | c.1506G>C | p.Trp502Cys | p.W502C | O43707 | protein_coding | deleterious(0) | probably_damaging(0.999) | TCGA-AR-A24L-01 | Breast | breast invasive carcinoma | Female | <65 | I/II | Hormone Therapy | tamoxiphen | PD | |
| ACTN4 | SNV | Missense_Mutation | c.2425N>A | p.Ala809Thr | p.A809T | O43707 | protein_coding | tolerated(0.15) | benign(0.012) | TCGA-D8-A1JD-01 | Breast | breast invasive carcinoma | Female | <65 | I/II | Chemotherapy | adriamycin | SD | |
| ACTN4 | SNV | Missense_Mutation | c.979N>A | p.Glu327Lys | p.E327K | O43707 | protein_coding | tolerated(0.64) | benign(0.027) | TCGA-D8-A1JN-01 | Breast | breast invasive carcinoma | Female | >=65 | III/IV | Hormone Therapy | anastrozolum | SD | |
| ACTN4 | SNV | Missense_Mutation | c.2161N>T | p.Asp721Tyr | p.D721Y | O43707 | protein_coding | deleterious(0.02) | probably_damaging(0.971) | TCGA-E2-A10A-01 | Breast | breast invasive carcinoma | Female | <65 | I/II | Hormone Therapy | zoladex | SD | |
| ACTN4 | SNV | Missense_Mutation | novel | c.230A>G | p.Asp77Gly | p.D77G | O43707 | protein_coding | deleterious(0.01) | probably_damaging(0.998) | TCGA-S3-AA10-01 | Breast | breast invasive carcinoma | Female | >=65 | I/II | Chemotherapy | cytoxan | CR |
| ACTN4 | insertion | In_Frame_Ins | novel | c.1364_1365insCCT | p.Lys455delinsAsnLeu | p.K455delinsNL | O43707 | protein_coding | TCGA-A8-A07P-01 | Breast | breast invasive carcinoma | Female | >=65 | I/II | Chemotherapy | 5-fluorouracil | SD | ||
| ACTN4 | insertion | Frame_Shift_Ins | novel | c.1365_1366insTGCGGGTGCAGGGT | p.His456CysfsTer58 | p.H456Cfs*58 | O43707 | protein_coding | TCGA-A8-A07P-01 | Breast | breast invasive carcinoma | Female | >=65 | I/II | Chemotherapy | 5-fluorouracil | SD |
| Page: 1 2 3 4 5 6 7 8 9 10 11 |
Top |
Related drugs of malignant transformation related genes |
| Identification of chemicals and drugs interact with genes involved in malignant transfromation |
| (DGIdb 4.0) |
| Entrez ID | Symbol | Category | Interaction Types | Drug Claim Name | Drug Name | PMIDs |
| Page: 1 |

Copyright 2023-Present -The University of Texas Health Science Center at Houston |