
|
|||||
|
 | |
| |
| |
| |
| |
| |
|
Gene: ZNF841 |
Gene summary for ZNF841 |
| Gene information | Species | Human | Gene symbol | ZNF841 | Gene ID | 284371 |
| Gene name | zinc finger protein 841 | |
| Gene Alias | ZNF841 | |
| Cytomap | 19q13.41 | |
| Gene Type | protein-coding | GO ID | GO:0006139 | UniProtAcc | Q6ZN19 |
Top |
Malignant transformation analysis |
| Identification of the aberrant gene expression in precancerous and cancerous lesions by comparing the gene expression of stem-like cells in diseased tissues with normal stem cells |
| Entrez ID | Symbol | Replicates | Species | Organ | Tissue | Adj P-value | Log2FC | Malignancy |
| 284371 | ZNF841 | P30T-E | Human | Esophagus | ESCC | 9.60e-15 | 3.97e-01 | 0.137 |
| 284371 | ZNF841 | P31T-E | Human | Esophagus | ESCC | 9.44e-07 | 1.23e-01 | 0.1251 |
| 284371 | ZNF841 | P32T-E | Human | Esophagus | ESCC | 3.57e-08 | 1.82e-01 | 0.1666 |
| 284371 | ZNF841 | P36T-E | Human | Esophagus | ESCC | 1.12e-05 | 2.21e-01 | 0.1187 |
| 284371 | ZNF841 | P37T-E | Human | Esophagus | ESCC | 1.36e-15 | 2.97e-01 | 0.1371 |
| 284371 | ZNF841 | P39T-E | Human | Esophagus | ESCC | 3.75e-03 | 1.11e-01 | 0.0894 |
| 284371 | ZNF841 | P40T-E | Human | Esophagus | ESCC | 1.20e-04 | 1.46e-01 | 0.109 |
| 284371 | ZNF841 | P42T-E | Human | Esophagus | ESCC | 7.97e-06 | 1.71e-01 | 0.1175 |
| 284371 | ZNF841 | P44T-E | Human | Esophagus | ESCC | 1.46e-07 | 1.84e-01 | 0.1096 |
| 284371 | ZNF841 | P47T-E | Human | Esophagus | ESCC | 4.12e-11 | 2.17e-01 | 0.1067 |
| 284371 | ZNF841 | P48T-E | Human | Esophagus | ESCC | 2.06e-08 | 1.78e-01 | 0.0959 |
| 284371 | ZNF841 | P49T-E | Human | Esophagus | ESCC | 7.48e-03 | 3.08e-01 | 0.1768 |
| 284371 | ZNF841 | P52T-E | Human | Esophagus | ESCC | 1.46e-28 | 4.93e-01 | 0.1555 |
| 284371 | ZNF841 | P54T-E | Human | Esophagus | ESCC | 6.66e-28 | 6.06e-01 | 0.0975 |
| 284371 | ZNF841 | P57T-E | Human | Esophagus | ESCC | 4.40e-09 | 1.83e-01 | 0.0926 |
| 284371 | ZNF841 | P61T-E | Human | Esophagus | ESCC | 3.11e-12 | 2.49e-01 | 0.099 |
| 284371 | ZNF841 | P62T-E | Human | Esophagus | ESCC | 9.62e-10 | 2.06e-01 | 0.1302 |
| 284371 | ZNF841 | P74T-E | Human | Esophagus | ESCC | 1.20e-14 | 3.69e-01 | 0.1479 |
| 284371 | ZNF841 | P75T-E | Human | Esophagus | ESCC | 9.25e-48 | 8.12e-01 | 0.1125 |
| 284371 | ZNF841 | P76T-E | Human | Esophagus | ESCC | 9.35e-10 | 1.75e-01 | 0.1207 |
| Page: 1 2 3 |
| Tissue | Expression Dynamics | Abbreviation |
| Esophagus | 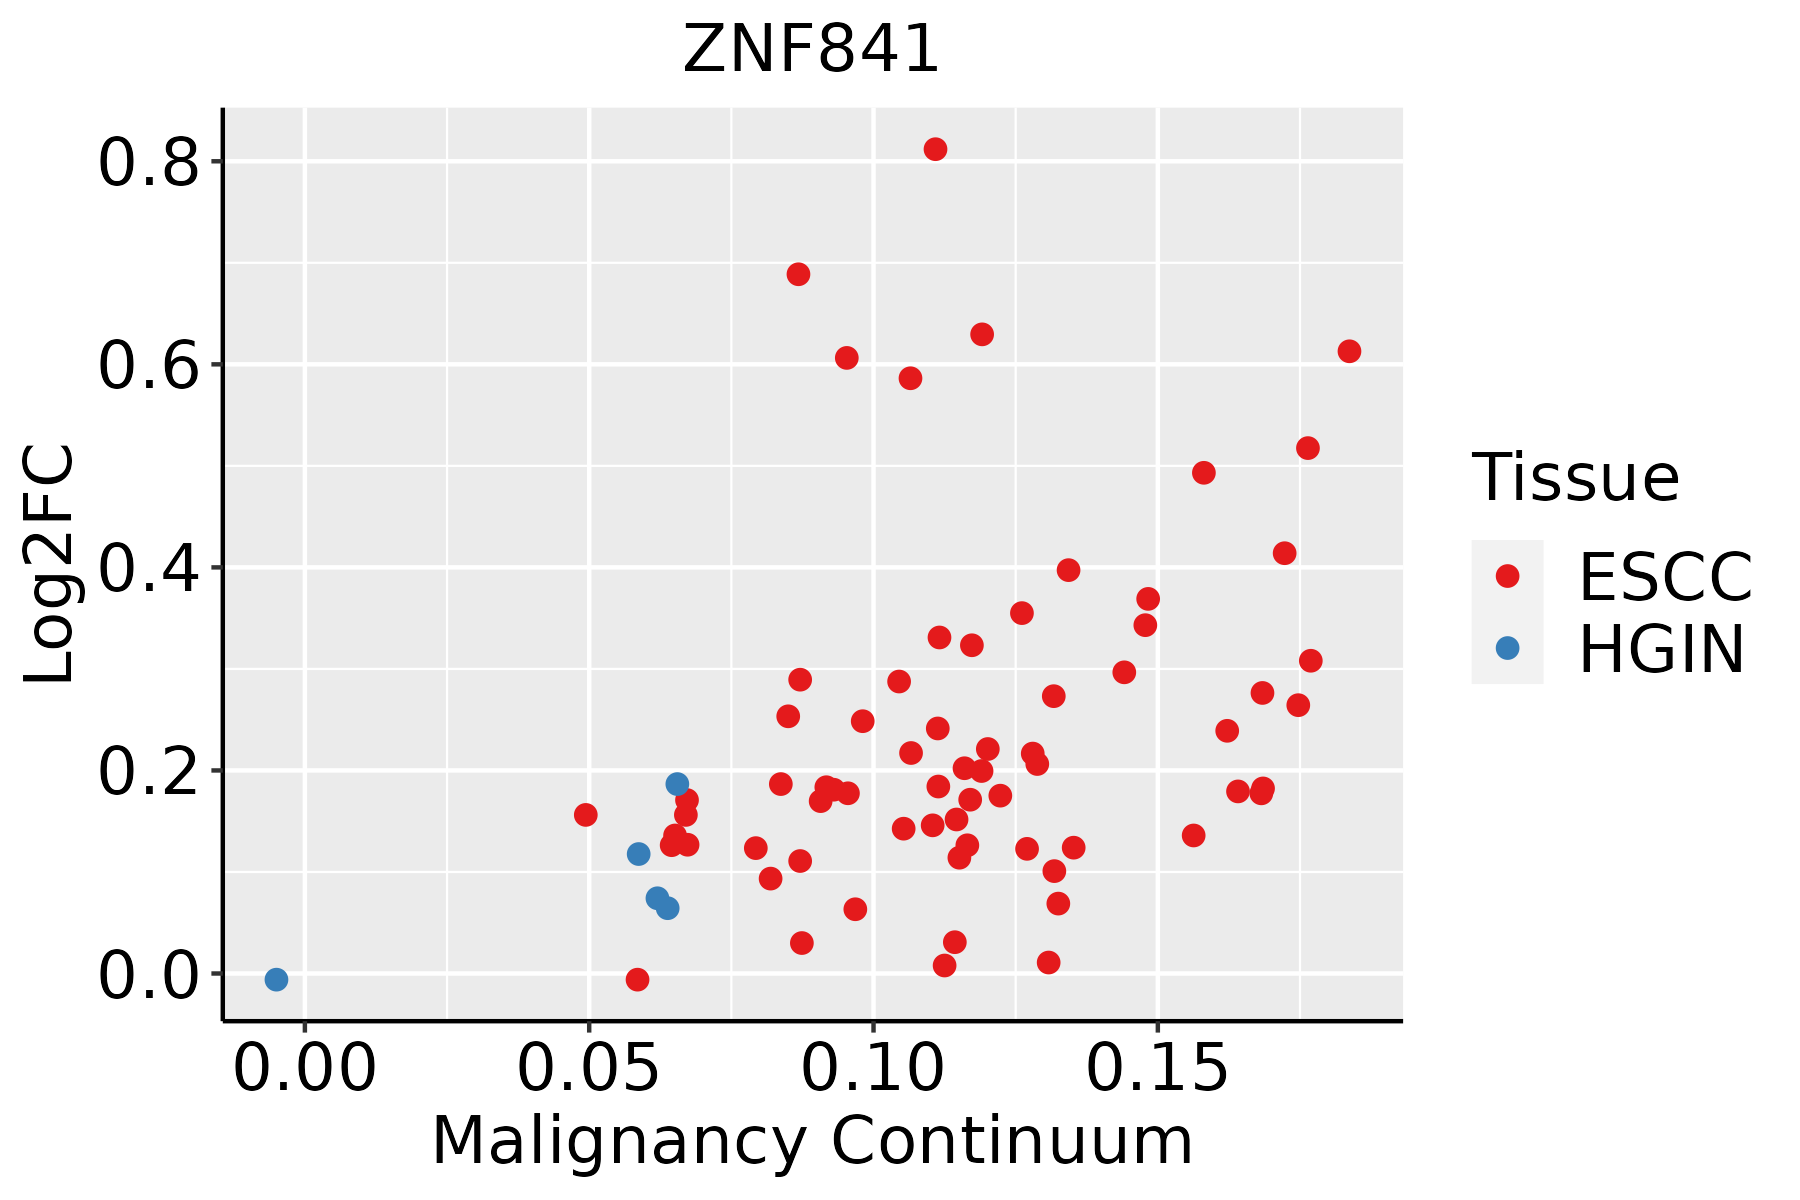 | ESCC: Esophageal squamous cell carcinoma |
| HGIN: High-grade intraepithelial neoplasias | ||
| LGIN: Low-grade intraepithelial neoplasias | ||
| Liver |  | HCC: Hepatocellular carcinoma |
| NAFLD: Non-alcoholic fatty liver disease |
| ∗log2FC in expression of this searched gene in stem-like cells from each diseased tissue sample relative to stem-like cells in normal samples in each tissue plotted against the malignancy continuum. Samples are colored based on if they are from different disease stage. |
Top |
Malignant transformation related pathway analysis |
| Find out the enriched GO biological processes and KEGG pathways involved in transition from healthy to precancer to cancer |
| Tissue | Disease Stage | Enriched GO biological Processes |
| Colorectum | AD |  |
| Colorectum | SER |  |
| Colorectum | MSS |  |
| Colorectum | MSI-H |  |
| Colorectum | FAP |  |
| ∗Top 15 enriched GO BP terms are showed in the bar plot of each disease state in each tissue. Each row represents a significant GO biological process which is colored according to the -log10(p.adjust). |
| Page: 1 2 3 4 5 6 7 8 9 |
| GO ID | Tissue | Disease Stage | Description | Gene Ratio | Bg Ratio | pvalue | p.adjust | Count |
| Page: 1 |
| Pathway ID | Tissue | Disease Stage | Description | Gene Ratio | Bg Ratio | pvalue | p.adjust | qvalue | Count |
| Page: 1 |
Top |
Cell-cell communication analysis |
| Identification of potential cell-cell interactions between two cell types and their ligand-receptor pairs for different disease states |
| Ligand | Receptor | LRpair | Pathway | Tissue | Disease Stage |
| Page: 1 |
Top |
Single-cell gene regulatory network inference analysis |
| Find out the significant the regulons (TFs) and the target genes of each regulon across cell types for different disease states |
| TF | Cell Type | Tissue | Disease Stage | Target Gene | RSS | Regulon Activity |
| ZNF841 | CD8TEXINT | Cervix | ADJ | IGHG1,CRTAM,VPS11, etc. | 1.72e-02 |  |
| ZNF841 | CD8TCM | Cervix | CC | IGHG1,CRTAM,VPS11, etc. | 9.17e-02 |  |
| ZNF841 | CD8TEXINT | Cervix | CC | IGHG1,CRTAM,VPS11, etc. | 1.52e-01 | |
| ZNF841 | CD8TEFF | Cervix | CC | IGHG1,CRTAM,VPS11, etc. | 7.23e-02 | |
| ZNF841 | TREG | Cervix | CC | IGHG1,CRTAM,VPS11, etc. | 9.19e-02 | |
| ZNF841 | CD8TEFF | Cervix | Healthy | IGHG1,CRTAM,VPS11, etc. | 1.73e-01 |  |
| ZNF841 | TREG | Cervix | Healthy | IGHG1,CRTAM,VPS11, etc. | 9.01e-02 | |
| ZNF841 | CD8TEXINT | Cervix | HSIL_HPV | IGHG1,CRTAM,VPS11, etc. | 1.16e-01 |  |
| ZNF841 | CD8TEFF | Cervix | HSIL_HPV | IGHG1,CRTAM,VPS11, etc. | 8.00e-02 | |
| ZNF841 | DIFF | Esophagus | ESCC | ZNF808,ZNF493,ZNF224, etc. | 0.00e+00 |  |
| ∗The dot plots of a searched regulon are shown for all cell subpopulations in each disease state of each tissue based on the regulon specific score inferred using pySCENIC and by calculating the average expression. |
| Page: 1 2 |
Top |
Somatic mutation of malignant transformation related genes |
| Annotation of somatic variants for genes involved in malignant transformation |
| Hugo Symbol | Variant Class | Variant Classification | dbSNP RS | HGVSc | HGVSp | HGVSp Short | SWISSPROT | BIOTYPE | SIFT | PolyPhen | Tumor Sample Barcode | Tissue | Histology | Sex | Age | Stage | Therapy Types | Drugs | Outcome |
| ZNF841 | SNV | Missense_Mutation | novel | c.49N>C | p.Phe17Leu | p.F17L | Q6ZN19 | protein_coding | deleterious(0.01) | benign(0.156) | TCGA-A8-A0A7-01 | Breast | breast invasive carcinoma | Female | <65 | I/II | Unknown | Unknown | SD |
| ZNF841 | SNV | Missense_Mutation | rs749554827 | c.2413N>T | p.Arg805Cys | p.R805C | Q6ZN19 | protein_coding | tolerated(0.2) | possibly_damaging(0.745) | TCGA-AN-A046-01 | Breast | breast invasive carcinoma | Female | >=65 | I/II | Unknown | Unknown | SD |
| ZNF841 | SNV | Missense_Mutation | novel | c.1950N>T | p.Glu650Asp | p.E650D | Q6ZN19 | protein_coding | deleterious(0.03) | possibly_damaging(0.829) | TCGA-AN-A046-01 | Breast | breast invasive carcinoma | Female | >=65 | I/II | Unknown | Unknown | SD |
| ZNF841 | SNV | Missense_Mutation | novel | c.567G>C | p.Gln189His | p.Q189H | Q6ZN19 | protein_coding | tolerated(0.48) | possibly_damaging(0.773) | TCGA-AN-A0AJ-01 | Breast | breast invasive carcinoma | Female | >=65 | I/II | Unknown | Unknown | SD |
| ZNF841 | SNV | Missense_Mutation | novel | c.567N>C | p.Gln189His | p.Q189H | Q6ZN19 | protein_coding | tolerated(0.48) | possibly_damaging(0.773) | TCGA-AN-A0AR-01 | Breast | breast invasive carcinoma | Female | <65 | I/II | Unknown | Unknown | SD |
| ZNF841 | SNV | Missense_Mutation | c.2033N>C | p.Glu678Ala | p.E678A | Q6ZN19 | protein_coding | deleterious(0) | benign(0.202) | TCGA-AO-A03L-01 | Breast | breast invasive carcinoma | Female | <65 | III/IV | Chemotherapy | cyclophosphamide | SD | |
| ZNF841 | SNV | Missense_Mutation | c.2323N>T | p.Arg775Cys | p.R775C | Q6ZN19 | protein_coding | tolerated(0.15) | possibly_damaging(0.83) | TCGA-B6-A0IJ-01 | Breast | breast invasive carcinoma | Female | <65 | I/II | Unknown | Unknown | SD | |
| ZNF841 | SNV | Missense_Mutation | c.1048N>G | p.Cys350Gly | p.C350G | Q6ZN19 | protein_coding | deleterious(0) | probably_damaging(0.99) | TCGA-BH-A0BA-01 | Breast | breast invasive carcinoma | Female | <65 | III/IV | Chemotherapy | cytoxan | SD | |
| ZNF841 | SNV | Missense_Mutation | c.1463N>G | p.Asn488Ser | p.N488S | Q6ZN19 | protein_coding | tolerated(0.05) | benign(0.003) | TCGA-BH-A0BP-01 | Breast | breast invasive carcinoma | Female | >=65 | I/II | Unknown | Unknown | SD | |
| ZNF841 | SNV | Missense_Mutation | c.1804N>G | p.Cys602Gly | p.C602G | Q6ZN19 | protein_coding | deleterious(0) | probably_damaging(0.985) | TCGA-BH-A0C1-01 | Breast | breast invasive carcinoma | Female | <65 | III/IV | Chemotherapy | adriamycin | PD |
| Page: 1 2 3 4 5 6 7 8 9 10 11 12 13 14 15 |
Top |
Related drugs of malignant transformation related genes |
| Identification of chemicals and drugs interact with genes involved in malignant transfromation |
| (DGIdb 4.0) |
| Entrez ID | Symbol | Category | Interaction Types | Drug Claim Name | Drug Name | PMIDs |
| Page: 1 |

Copyright 2023-Present -The University of Texas Health Science Center at Houston |