
|
|||||
|
 | |
| |
| |
| |
| |
| |
|
Gene: ZNF787 |
Gene summary for ZNF787 |
| Gene information | Species | Human | Gene symbol | ZNF787 | Gene ID | 126208 |
| Gene name | zinc finger protein 787 | |
| Gene Alias | TIP20 | |
| Cytomap | 19q13.43 | |
| Gene Type | protein-coding | GO ID | GO:0006139 | UniProtAcc | Q6DD87 |
Top |
Malignant transformation analysis |
| Identification of the aberrant gene expression in precancerous and cancerous lesions by comparing the gene expression of stem-like cells in diseased tissues with normal stem cells |
| Entrez ID | Symbol | Replicates | Species | Organ | Tissue | Adj P-value | Log2FC | Malignancy |
| 126208 | ZNF787 | male-WTA | Human | Thyroid | PTC | 1.17e-17 | 1.95e-01 | 0.1037 |
| 126208 | ZNF787 | PTC01 | Human | Thyroid | PTC | 5.77e-03 | 4.93e-02 | 0.1899 |
| 126208 | ZNF787 | PTC04 | Human | Thyroid | PTC | 8.23e-13 | 2.50e-01 | 0.1927 |
| 126208 | ZNF787 | PTC05 | Human | Thyroid | PTC | 1.01e-09 | 3.36e-01 | 0.2065 |
| 126208 | ZNF787 | PTC06 | Human | Thyroid | PTC | 1.52e-27 | 4.75e-01 | 0.2057 |
| 126208 | ZNF787 | PTC07 | Human | Thyroid | PTC | 2.96e-28 | 3.78e-01 | 0.2044 |
| 126208 | ZNF787 | ATC12 | Human | Thyroid | ATC | 4.16e-11 | 2.33e-01 | 0.34 |
| 126208 | ZNF787 | ATC13 | Human | Thyroid | ATC | 1.42e-55 | 1.10e+00 | 0.34 |
| 126208 | ZNF787 | ATC2 | Human | Thyroid | ATC | 5.51e-11 | 7.16e-01 | 0.34 |
| 126208 | ZNF787 | ATC4 | Human | Thyroid | ATC | 1.66e-16 | 3.21e-01 | 0.34 |
| 126208 | ZNF787 | ATC5 | Human | Thyroid | ATC | 1.30e-65 | 1.17e+00 | 0.34 |
| Page: 1 2 |
| Tissue | Expression Dynamics | Abbreviation |
| Colorectum (GSE201348) |  | FAP: Familial adenomatous polyposis |
| CRC: Colorectal cancer | ||
| Colorectum (HTA11) | 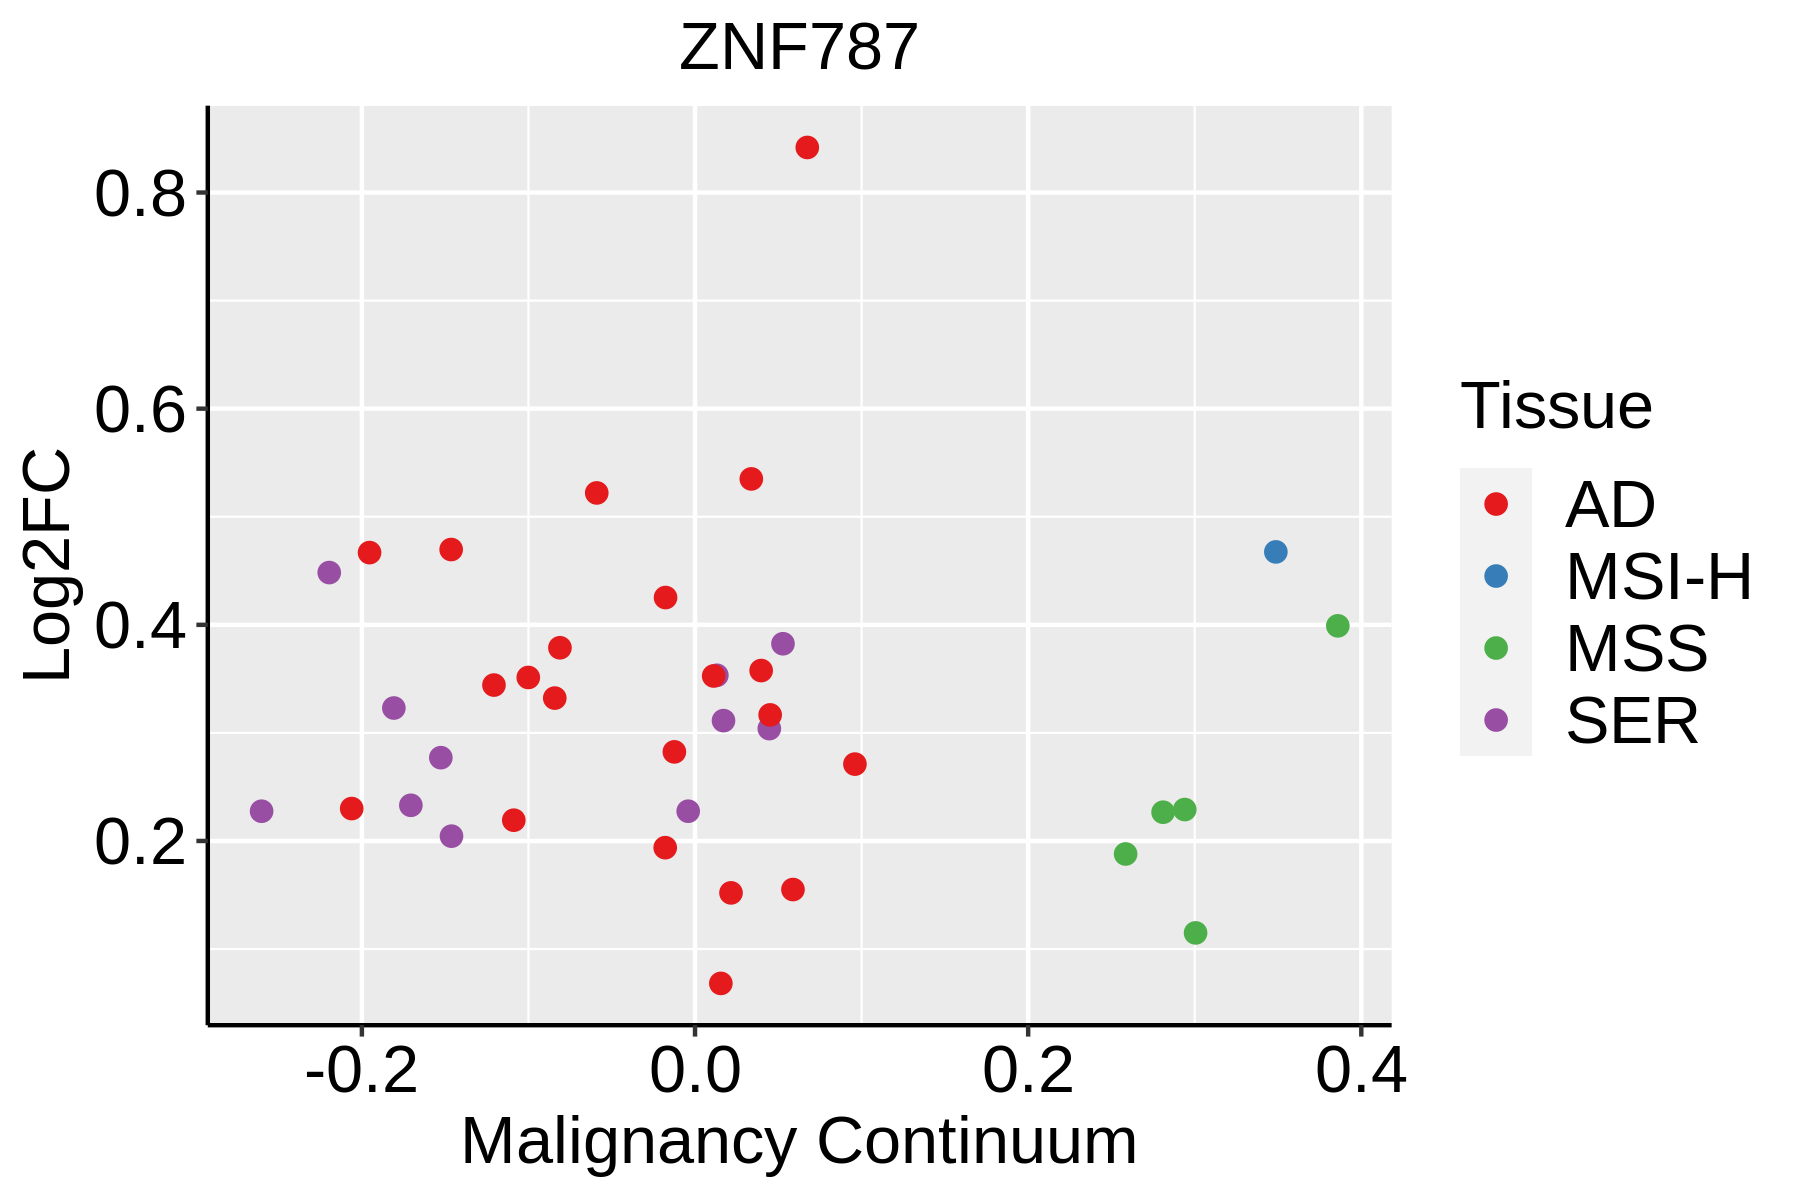 | AD: Adenomas |
| SER: Sessile serrated lesions | ||
| MSI-H: Microsatellite-high colorectal cancer | ||
| MSS: Microsatellite stable colorectal cancer | ||
| Liver | 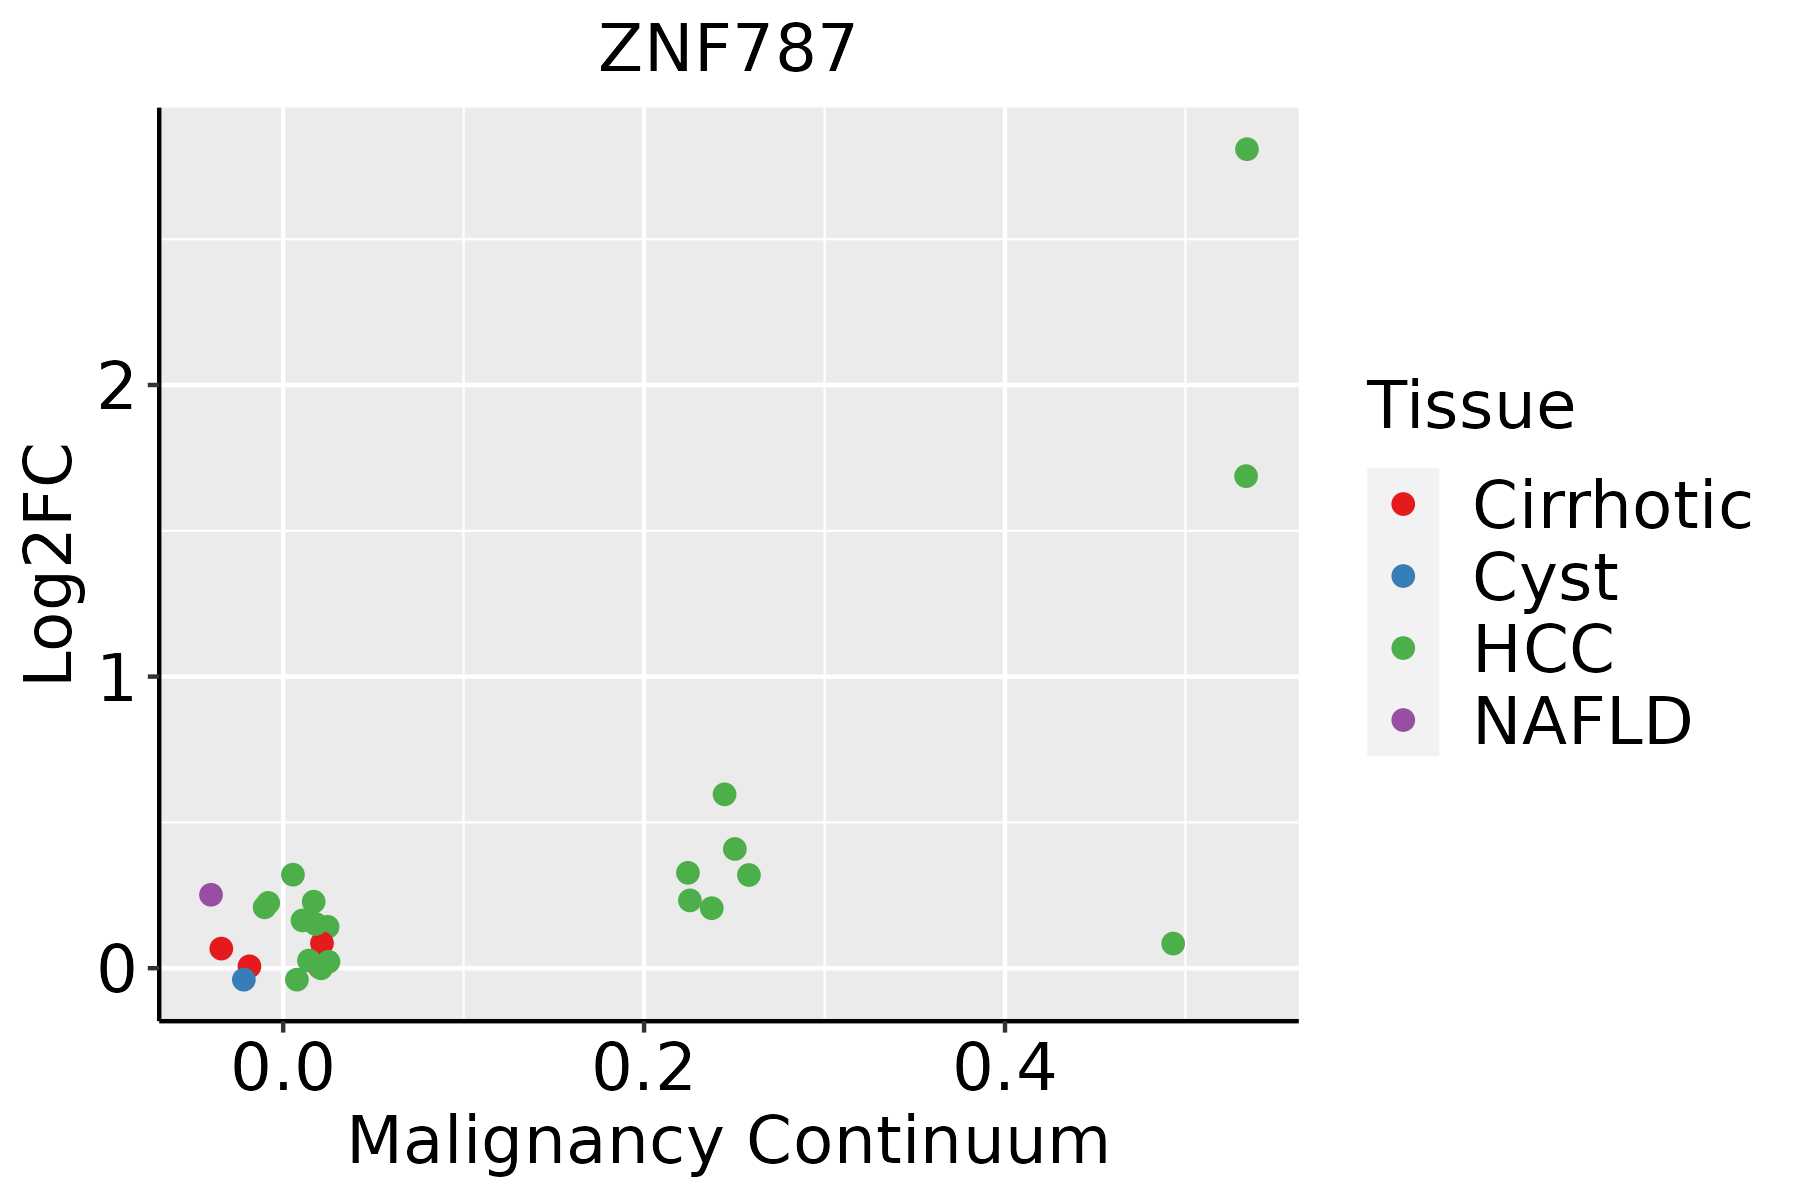 | HCC: Hepatocellular carcinoma |
| NAFLD: Non-alcoholic fatty liver disease | ||
| Thyroid | 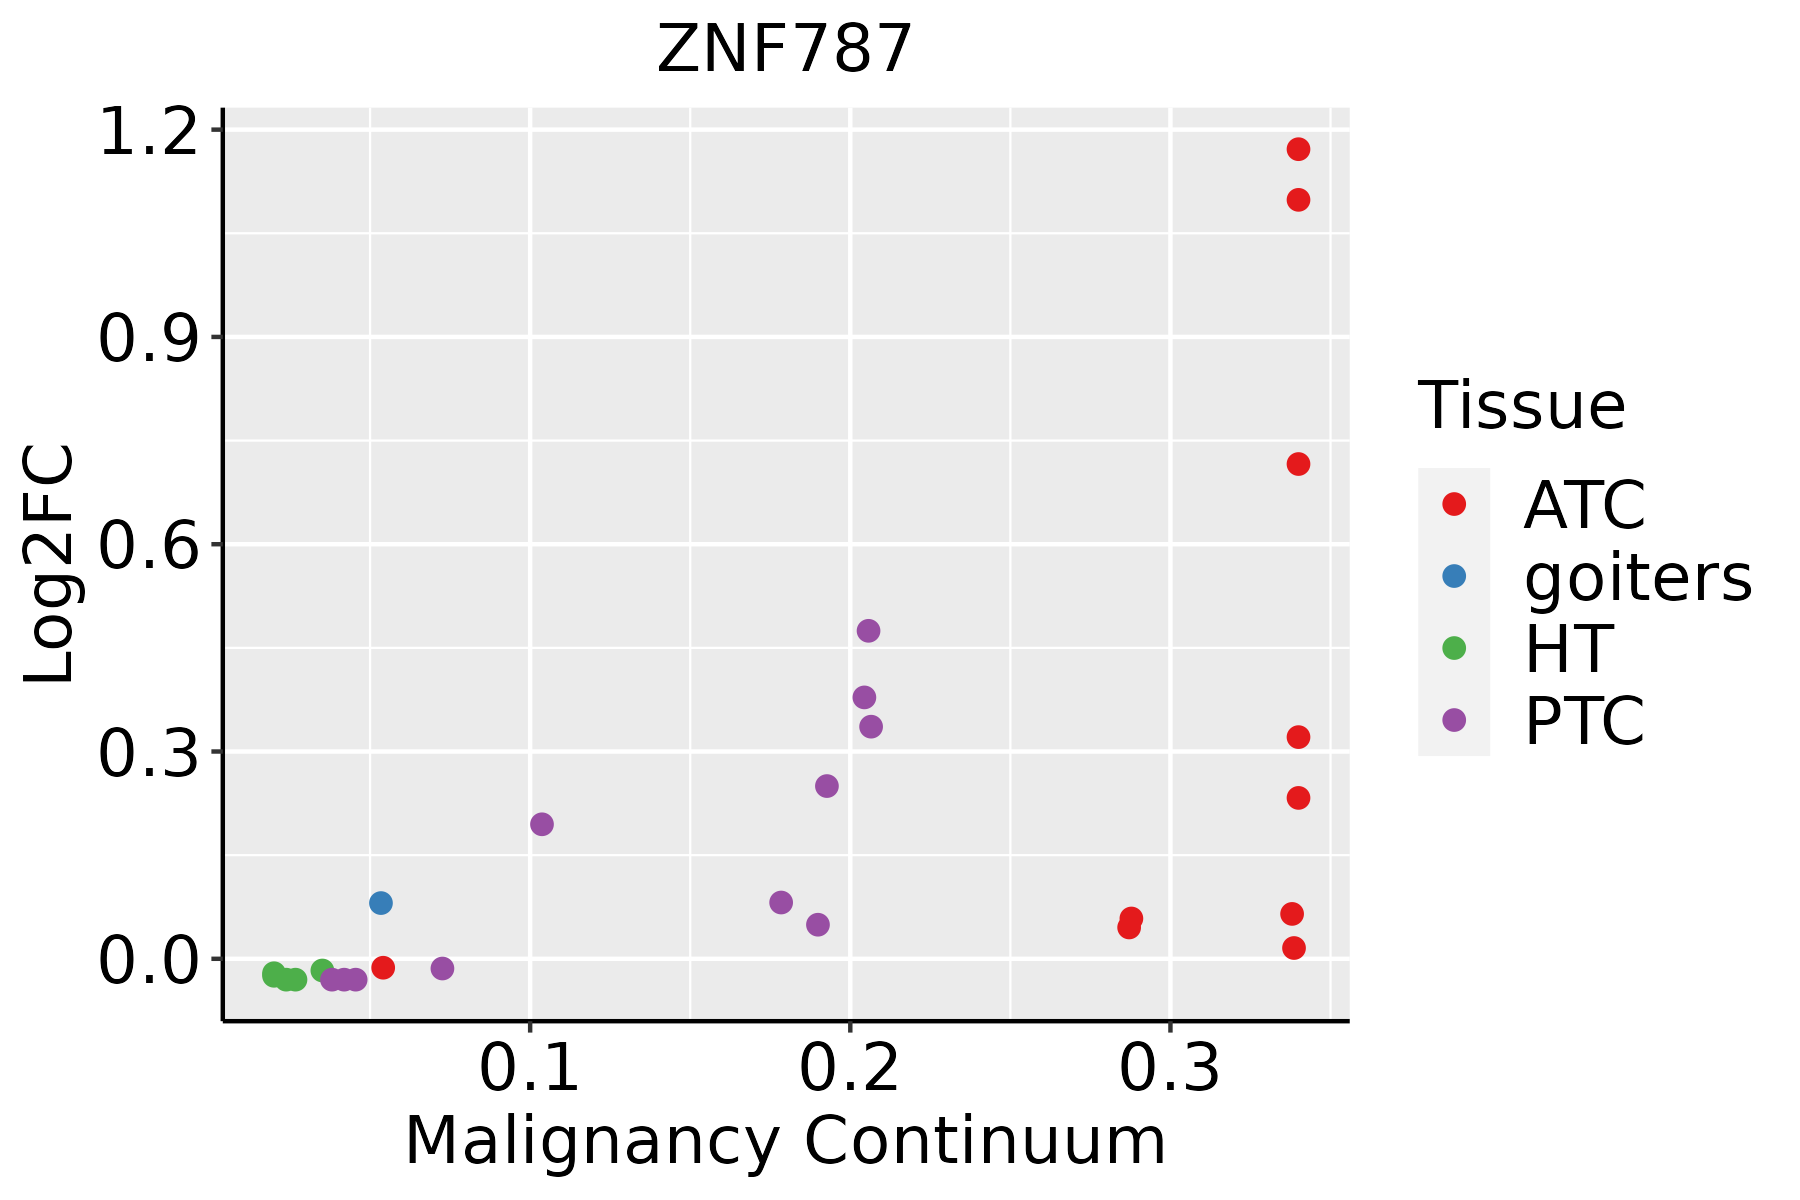 | ATC: Anaplastic thyroid cancer |
| HT: Hashimoto's thyroiditis | ||
| PTC: Papillary thyroid cancer |
| ∗log2FC in expression of this searched gene in stem-like cells from each diseased tissue sample relative to stem-like cells in normal samples in each tissue plotted against the malignancy continuum. Samples are colored based on if they are from different disease stage. |
Top |
Malignant transformation related pathway analysis |
| Find out the enriched GO biological processes and KEGG pathways involved in transition from healthy to precancer to cancer |
| Tissue | Disease Stage | Enriched GO biological Processes |
| Colorectum | AD |  |
| Colorectum | SER |  |
| Colorectum | MSS |  |
| Colorectum | MSI-H |  |
| Colorectum | FAP |  |
| ∗Top 15 enriched GO BP terms are showed in the bar plot of each disease state in each tissue. Each row represents a significant GO biological process which is colored according to the -log10(p.adjust). |
| Page: 1 2 3 4 5 6 7 8 9 |
| GO ID | Tissue | Disease Stage | Description | Gene Ratio | Bg Ratio | pvalue | p.adjust | Count |
| Page: 1 |
| Pathway ID | Tissue | Disease Stage | Description | Gene Ratio | Bg Ratio | pvalue | p.adjust | qvalue | Count |
| Page: 1 |
Top |
Cell-cell communication analysis |
| Identification of potential cell-cell interactions between two cell types and their ligand-receptor pairs for different disease states |
| Ligand | Receptor | LRpair | Pathway | Tissue | Disease Stage |
| Page: 1 |
Top |
Single-cell gene regulatory network inference analysis |
| Find out the significant the regulons (TFs) and the target genes of each regulon across cell types for different disease states |
| TF | Cell Type | Tissue | Disease Stage | Target Gene | RSS | Regulon Activity |
| ZNF787 | MYOFIB | Stomach | CSG | TLL1,KCNAB2,ZNF627, etc. | 1.17e-01 |  |
| ZNF787 | LYMEND | Stomach | CSG | TLL1,KCNAB2,ZNF627, etc. | 0.00e+00 | |
| ZNF787 | LYMEND | Stomach | GC | TLL1,KCNAB2,ZNF627, etc. | 1.03e-02 |  |
| ZNF787 | CAF | Stomach | SIM | TLL1,KCNAB2,ZNF627, etc. | 1.14e-01 |  |
| ZNF787 | MVA | Stomach | WIM | TLL1,KCNAB2,ZNF627, etc. | 8.03e-02 |  |
| ZNF787 | ICAF | Stomach | WIM | TLL1,KCNAB2,ZNF627, etc. | 1.10e-01 | |
| ∗The dot plots of a searched regulon are shown for all cell subpopulations in each disease state of each tissue based on the regulon specific score inferred using pySCENIC and by calculating the average expression. |
| Page: 1 |
Top |
Somatic mutation of malignant transformation related genes |
| Annotation of somatic variants for genes involved in malignant transformation |
| Hugo Symbol | Variant Class | Variant Classification | dbSNP RS | HGVSc | HGVSp | HGVSp Short | SWISSPROT | BIOTYPE | SIFT | PolyPhen | Tumor Sample Barcode | Tissue | Histology | Sex | Age | Stage | Therapy Types | Drugs | Outcome |
| ZNF787 | insertion | Frame_Shift_Ins | novel | c.24_25insCCATGGCGTGTGGAGTCCCG | p.Ser9ProfsTer80 | p.S9Pfs*80 | protein_coding | TCGA-A8-A07U-01 | Breast | breast invasive carcinoma | Female | >=65 | III/IV | Chemotherapy | 5-fluorouracil | SD | |||
| ZNF787 | SNV | Missense_Mutation | novel | c.341N>A | p.Arg114His | p.R114H | protein_coding | deleterious(0) | probably_damaging(0.99) | TCGA-2W-A8YY-01 | Cervix | cervical & endocervical cancer | Female | <65 | I/II | Chemotherapy | cisplatin | CR | |
| ZNF787 | SNV | Missense_Mutation | novel | c.257N>A | p.Arg86His | p.R86H | protein_coding | deleterious(0) | probably_damaging(0.993) | TCGA-VS-A94Z-01 | Cervix | cervical & endocervical cancer | Female | <65 | I/II | Chemotherapy | cisplatin | CR | |
| ZNF787 | SNV | Missense_Mutation | novel | c.424N>G | p.Arg142Gly | p.R142G | protein_coding | deleterious(0) | possibly_damaging(0.483) | TCGA-A6-3809-01 | Colorectum | colon adenocarcinoma | Female | >=65 | I/II | Unknown | Unknown | SD | |
| ZNF787 | SNV | Missense_Mutation | novel | c.1080G>T | p.Glu360Asp | p.E360D | protein_coding | tolerated_low_confidence(0.55) | benign(0.003) | TCGA-AA-3947-01 | Colorectum | colon adenocarcinoma | Female | <65 | I/II | Unknown | Unknown | SD | |
| ZNF787 | SNV | Missense_Mutation | novel | c.1027N>A | p.Ala343Thr | p.A343T | protein_coding | deleterious(0.01) | benign(0) | TCGA-CM-4746-01 | Colorectum | colon adenocarcinoma | Male | <65 | I/II | Unknown | Unknown | SD | |
| ZNF787 | SNV | Missense_Mutation | novel | c.350C>T | p.Thr117Met | p.T117M | protein_coding | deleterious(0) | probably_damaging(0.99) | TCGA-A5-A0VP-01 | Endometrium | uterine corpus endometrioid carcinoma | Female | >=65 | I/II | Unknown | Unknown | SD | |
| ZNF787 | SNV | Missense_Mutation | novel | c.338N>A | p.Arg113Gln | p.R113Q | protein_coding | tolerated(1) | benign(0.052) | TCGA-A5-A1OF-01 | Endometrium | uterine corpus endometrioid carcinoma | Female | <65 | I/II | Unknown | Unknown | SD | |
| ZNF787 | SNV | Missense_Mutation | novel | c.317N>A | p.Ser106Asn | p.S106N | protein_coding | deleterious(0.04) | benign(0.015) | TCGA-AP-A1DV-01 | Endometrium | uterine corpus endometrioid carcinoma | Female | <65 | I/II | Unknown | Unknown | SD | |
| ZNF787 | SNV | Missense_Mutation | novel | c.257N>A | p.Arg86His | p.R86H | protein_coding | deleterious(0) | probably_damaging(0.993) | TCGA-AP-A1E0-01 | Endometrium | uterine corpus endometrioid carcinoma | Female | <65 | III/IV | Chemotherapy | paclitaxel | SD |
| Page: 1 2 3 |
Top |
Related drugs of malignant transformation related genes |
| Identification of chemicals and drugs interact with genes involved in malignant transfromation |
| (DGIdb 4.0) |
| Entrez ID | Symbol | Category | Interaction Types | Drug Claim Name | Drug Name | PMIDs |
| Page: 1 |

Copyright 2023-Present -The University of Texas Health Science Center at Houston |