
|
|||||
|
 | |
| |
| |
| |
| |
| |
|
Gene: ZNF75A |
Gene summary for ZNF75A |
| Gene information | Species | Human | Gene symbol | ZNF75A | Gene ID | 7627 |
| Gene name | zinc finger protein 75a | |
| Gene Alias | ZNF75A | |
| Cytomap | 16p13.3 | |
| Gene Type | protein-coding | GO ID | GO:0000122 | UniProtAcc | Q68CU0 |
Top |
Malignant transformation analysis |
| Identification of the aberrant gene expression in precancerous and cancerous lesions by comparing the gene expression of stem-like cells in diseased tissues with normal stem cells |
| Entrez ID | Symbol | Replicates | Species | Organ | Tissue | Adj P-value | Log2FC | Malignancy |
| 7627 | ZNF75A | P27T-E | Human | Esophagus | ESCC | 8.74e-16 | 3.12e-01 | 0.1055 |
| 7627 | ZNF75A | P28T-E | Human | Esophagus | ESCC | 5.17e-13 | 2.63e-01 | 0.1149 |
| 7627 | ZNF75A | P30T-E | Human | Esophagus | ESCC | 3.76e-15 | 5.78e-01 | 0.137 |
| 7627 | ZNF75A | P31T-E | Human | Esophagus | ESCC | 9.73e-07 | 1.71e-01 | 0.1251 |
| 7627 | ZNF75A | P32T-E | Human | Esophagus | ESCC | 2.70e-11 | 2.00e-01 | 0.1666 |
| 7627 | ZNF75A | P36T-E | Human | Esophagus | ESCC | 2.21e-11 | 2.98e-01 | 0.1187 |
| 7627 | ZNF75A | P37T-E | Human | Esophagus | ESCC | 1.80e-11 | 2.53e-01 | 0.1371 |
| 7627 | ZNF75A | P39T-E | Human | Esophagus | ESCC | 1.35e-06 | 2.11e-01 | 0.0894 |
| 7627 | ZNF75A | P40T-E | Human | Esophagus | ESCC | 4.60e-05 | 1.50e-01 | 0.109 |
| 7627 | ZNF75A | P42T-E | Human | Esophagus | ESCC | 3.47e-08 | 2.36e-01 | 0.1175 |
| 7627 | ZNF75A | P44T-E | Human | Esophagus | ESCC | 2.72e-07 | 2.26e-01 | 0.1096 |
| 7627 | ZNF75A | P47T-E | Human | Esophagus | ESCC | 4.87e-15 | 2.93e-01 | 0.1067 |
| 7627 | ZNF75A | P48T-E | Human | Esophagus | ESCC | 4.26e-09 | 2.44e-01 | 0.0959 |
| 7627 | ZNF75A | P52T-E | Human | Esophagus | ESCC | 7.10e-22 | 4.13e-01 | 0.1555 |
| 7627 | ZNF75A | P54T-E | Human | Esophagus | ESCC | 5.91e-17 | 4.17e-01 | 0.0975 |
| 7627 | ZNF75A | P57T-E | Human | Esophagus | ESCC | 1.36e-05 | 1.75e-01 | 0.0926 |
| 7627 | ZNF75A | P61T-E | Human | Esophagus | ESCC | 2.53e-13 | 3.05e-01 | 0.099 |
| 7627 | ZNF75A | P62T-E | Human | Esophagus | ESCC | 3.97e-38 | 5.43e-01 | 0.1302 |
| 7627 | ZNF75A | P65T-E | Human | Esophagus | ESCC | 2.52e-12 | 2.91e-01 | 0.0978 |
| 7627 | ZNF75A | P74T-E | Human | Esophagus | ESCC | 3.70e-20 | 6.15e-01 | 0.1479 |
| Page: 1 2 3 |
| Tissue | Expression Dynamics | Abbreviation |
| Esophagus | 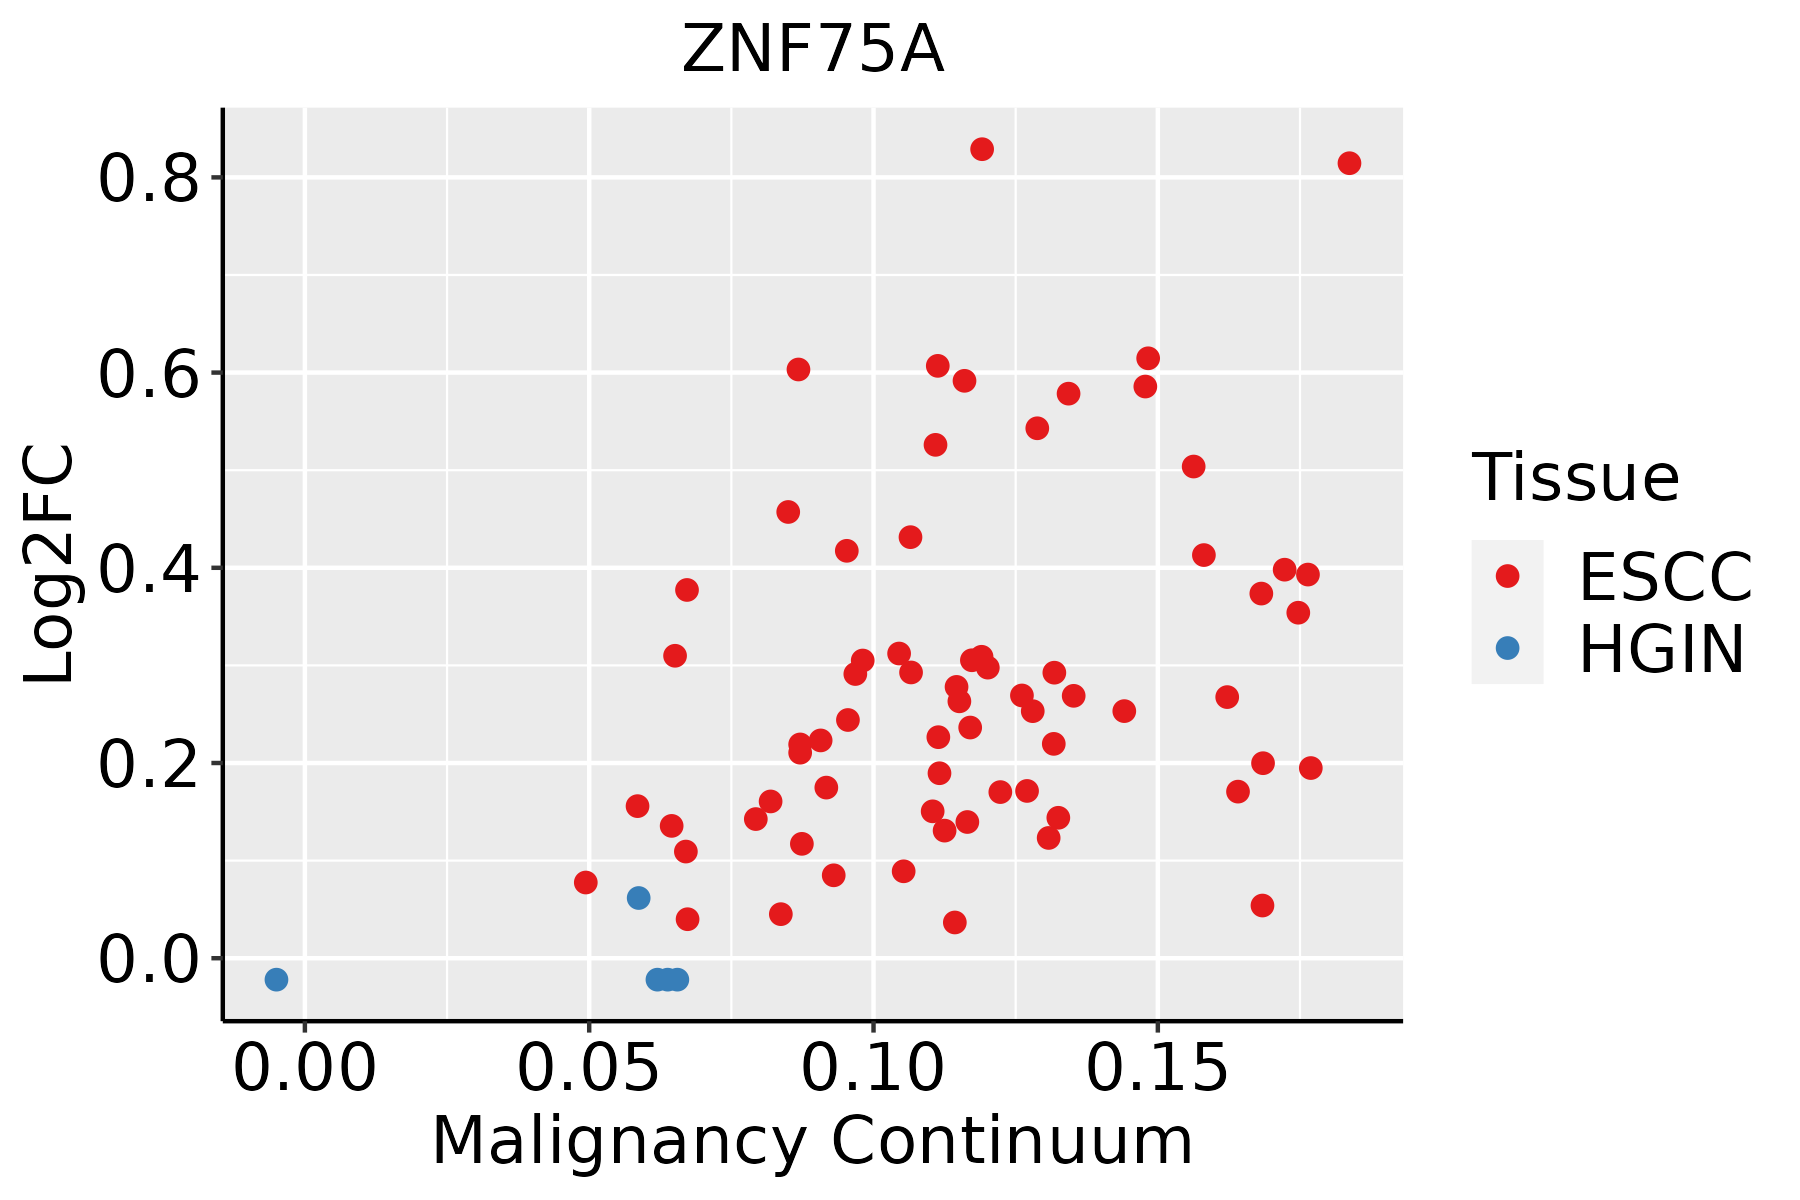 | ESCC: Esophageal squamous cell carcinoma |
| HGIN: High-grade intraepithelial neoplasias | ||
| LGIN: Low-grade intraepithelial neoplasias | ||
| Skin | 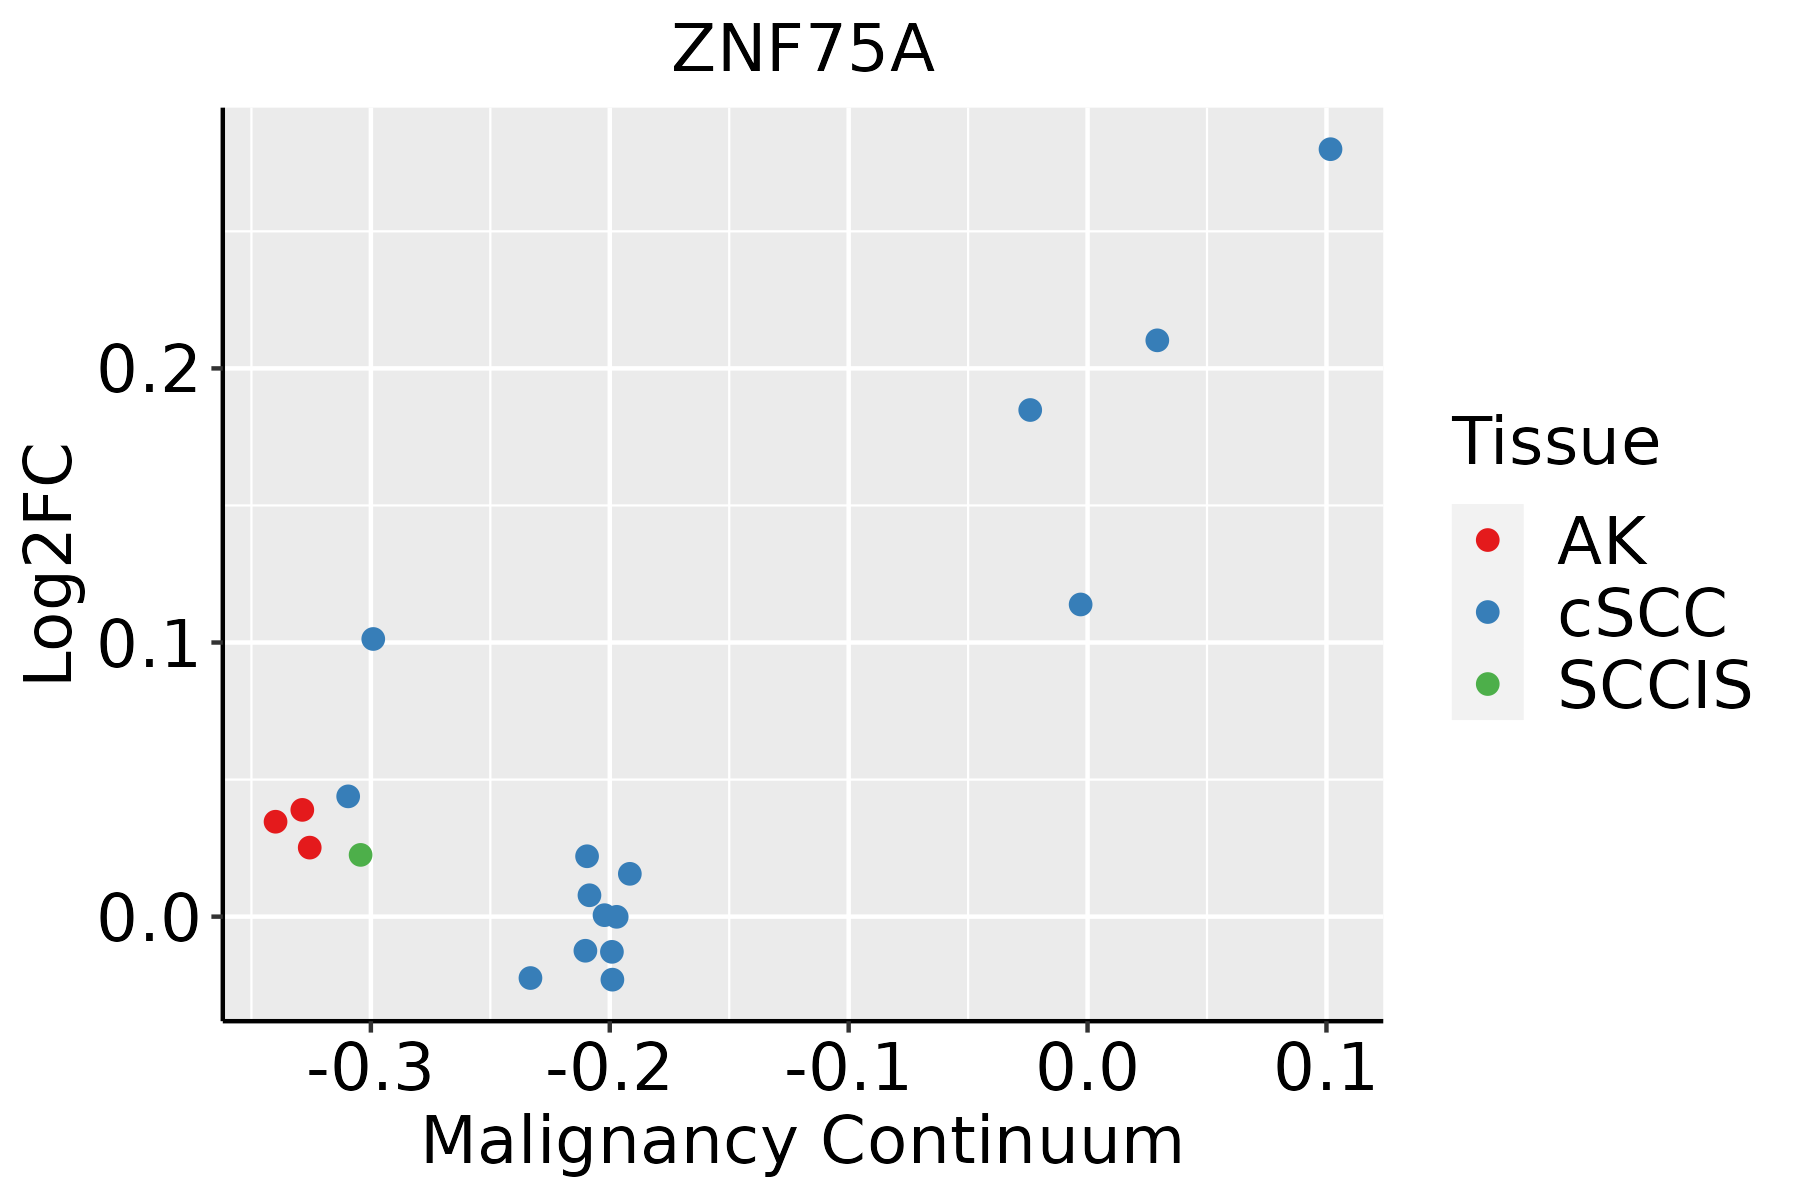 | AK: Actinic keratosis |
| cSCC: Cutaneous squamous cell carcinoma | ||
| SCCIS:squamous cell carcinoma in situ |
| ∗log2FC in expression of this searched gene in stem-like cells from each diseased tissue sample relative to stem-like cells in normal samples in each tissue plotted against the malignancy continuum. Samples are colored based on if they are from different disease stage. |
Top |
Malignant transformation related pathway analysis |
| Find out the enriched GO biological processes and KEGG pathways involved in transition from healthy to precancer to cancer |
| Tissue | Disease Stage | Enriched GO biological Processes |
| Colorectum | AD |  |
| Colorectum | SER |  |
| Colorectum | MSS |  |
| Colorectum | MSI-H |  |
| Colorectum | FAP |  |
| ∗Top 15 enriched GO BP terms are showed in the bar plot of each disease state in each tissue. Each row represents a significant GO biological process which is colored according to the -log10(p.adjust). |
| Page: 1 2 3 4 5 6 7 8 9 |
| GO ID | Tissue | Disease Stage | Description | Gene Ratio | Bg Ratio | pvalue | p.adjust | Count |
| Page: 1 |
| Pathway ID | Tissue | Disease Stage | Description | Gene Ratio | Bg Ratio | pvalue | p.adjust | qvalue | Count |
| Page: 1 |
Top |
Cell-cell communication analysis |
| Identification of potential cell-cell interactions between two cell types and their ligand-receptor pairs for different disease states |
| Ligand | Receptor | LRpair | Pathway | Tissue | Disease Stage |
| Page: 1 |
Top |
Single-cell gene regulatory network inference analysis |
| Find out the significant the regulons (TFs) and the target genes of each regulon across cell types for different disease states |
| TF | Cell Type | Tissue | Disease Stage | Target Gene | RSS | Regulon Activity |
| ZNF75A | CD8TCM | Cervix | ADJ | SLC25A15,DMKN,FUCA1, etc. | 8.48e-02 |  |
| ZNF75A | CD8TCM | Cervix | N_HPV | SLC25A15,DMKN,FUCA1, etc. | 1.10e-01 |  |
| ZNF75A | NK | Cervix | N_HPV | SLC25A15,DMKN,FUCA1, etc. | 7.88e-02 | |
| ZNF75A | CD8TEXP | Cervix | N_HPV | SLC25A15,DMKN,FUCA1, etc. | 3.03e-02 | |
| ZNF75A | CD4TN | Liver | Cirrhotic | SMCR8,LUC7L2,TRAV13-2, etc. | 3.22e-01 |  |
| ZNF75A | TREG | Liver | Cirrhotic | SMCR8,LUC7L2,TRAV13-2, etc. | 5.28e-02 | |
| ZNF75A | CD8TCM | Liver | HCC | SMCR8,LUC7L2,TRAV13-2, etc. | 4.11e-01 |  |
| ∗The dot plots of a searched regulon are shown for all cell subpopulations in each disease state of each tissue based on the regulon specific score inferred using pySCENIC and by calculating the average expression. |
| Page: 1 |
Top |
Somatic mutation of malignant transformation related genes |
| Annotation of somatic variants for genes involved in malignant transformation |
| Hugo Symbol | Variant Class | Variant Classification | dbSNP RS | HGVSc | HGVSp | HGVSp Short | SWISSPROT | BIOTYPE | SIFT | PolyPhen | Tumor Sample Barcode | Tissue | Histology | Sex | Age | Stage | Therapy Types | Drugs | Outcome |
| ZNF75A | SNV | Missense_Mutation | c.860G>C | p.Ser287Thr | p.S287T | Q96N20 | protein_coding | tolerated(0.07) | benign(0.16) | TCGA-AO-A0J7-01 | Breast | breast invasive carcinoma | Female | >=65 | I/II | Chemotherapy | doxorubicin | SD | |
| ZNF75A | SNV | Missense_Mutation | c.357N>A | p.Met119Ile | p.M119I | Q96N20 | protein_coding | tolerated(0.33) | benign(0) | TCGA-AO-A128-01 | Breast | breast invasive carcinoma | Female | <65 | I/II | Chemotherapy | doxorubicin | SD | |
| ZNF75A | SNV | Missense_Mutation | c.34N>A | p.Asp12Asn | p.D12N | Q96N20 | protein_coding | deleterious(0.03) | benign(0.003) | TCGA-AR-A24O-01 | Breast | breast invasive carcinoma | Female | <65 | III/IV | Chemotherapy | cytoxan | PD | |
| ZNF75A | SNV | Missense_Mutation | novel | c.425A>G | p.Gln142Arg | p.Q142R | Q96N20 | protein_coding | tolerated(0.09) | benign(0.098) | TCGA-BH-A1FU-01 | Breast | breast invasive carcinoma | Female | <65 | I/II | Unknown | Unknown | PD |
| ZNF75A | SNV | Missense_Mutation | c.144N>T | p.Glu48Asp | p.E48D | Q96N20 | protein_coding | deleterious(0.05) | probably_damaging(0.987) | TCGA-D8-A140-01 | Breast | breast invasive carcinoma | Female | <65 | I/II | Chemotherapy | doxorubicin+cyclophosphamid | SD | |
| ZNF75A | SNV | Missense_Mutation | c.661T>C | p.Trp221Arg | p.W221R | Q96N20 | protein_coding | tolerated(0.07) | possibly_damaging(0.664) | TCGA-AA-3710-01 | Colorectum | colon adenocarcinoma | Female | >=65 | I/II | Unknown | Unknown | SD | |
| ZNF75A | SNV | Missense_Mutation | c.357N>A | p.Met119Ile | p.M119I | Q96N20 | protein_coding | tolerated(0.33) | benign(0) | TCGA-AA-3811-01 | Colorectum | colon adenocarcinoma | Female | >=65 | III/IV | Unknown | Unknown | PD | |
| ZNF75A | SNV | Missense_Mutation | novel | c.168A>C | p.Gln56His | p.Q56H | Q96N20 | protein_coding | tolerated(0.12) | benign(0.001) | TCGA-AA-3950-01 | Colorectum | colon adenocarcinoma | Female | >=65 | I/II | Unknown | Unknown | SD |
| ZNF75A | SNV | Missense_Mutation | novel | c.169G>T | p.Val57Leu | p.V57L | Q96N20 | protein_coding | tolerated(0.38) | benign(0.005) | TCGA-AA-3950-01 | Colorectum | colon adenocarcinoma | Female | >=65 | I/II | Unknown | Unknown | SD |
| ZNF75A | SNV | Missense_Mutation | novel | c.539N>C | p.Gln180Pro | p.Q180P | Q96N20 | protein_coding | deleterious(0) | possibly_damaging(0.843) | TCGA-AA-A00N-01 | Colorectum | colon adenocarcinoma | Male | >=65 | I/II | Unknown | Unknown | PD |
| Page: 1 2 3 4 |
Top |
Related drugs of malignant transformation related genes |
| Identification of chemicals and drugs interact with genes involved in malignant transfromation |
| (DGIdb 4.0) |
| Entrez ID | Symbol | Category | Interaction Types | Drug Claim Name | Drug Name | PMIDs |
| Page: 1 |

Copyright 2023-Present -The University of Texas Health Science Center at Houston |