
|
|||||
|
 | |
| |
| |
| |
| |
| |
|
Gene: ZNF668 |
Gene summary for ZNF668 |
| Gene information | Species | Human | Gene symbol | ZNF668 | Gene ID | 79759 |
| Gene name | zinc finger protein 668 | |
| Gene Alias | ZNF668 | |
| Cytomap | 16p11.2 | |
| Gene Type | protein-coding | GO ID | GO:0000122 | UniProtAcc | A0A024QZD9 |
Top |
Malignant transformation analysis |
| Identification of the aberrant gene expression in precancerous and cancerous lesions by comparing the gene expression of stem-like cells in diseased tissues with normal stem cells |
| Entrez ID | Symbol | Replicates | Species | Organ | Tissue | Adj P-value | Log2FC | Malignancy |
| 79759 | ZNF668 | P28T-E | Human | Esophagus | ESCC | 1.51e-16 | 2.49e-01 | 0.1149 |
| 79759 | ZNF668 | P30T-E | Human | Esophagus | ESCC | 1.33e-15 | 4.46e-01 | 0.137 |
| 79759 | ZNF668 | P31T-E | Human | Esophagus | ESCC | 2.54e-06 | 1.08e-01 | 0.1251 |
| 79759 | ZNF668 | P32T-E | Human | Esophagus | ESCC | 6.32e-22 | 2.61e-01 | 0.1666 |
| 79759 | ZNF668 | P36T-E | Human | Esophagus | ESCC | 7.86e-07 | 1.83e-01 | 0.1187 |
| 79759 | ZNF668 | P37T-E | Human | Esophagus | ESCC | 5.15e-06 | 1.19e-01 | 0.1371 |
| 79759 | ZNF668 | P39T-E | Human | Esophagus | ESCC | 1.83e-07 | 9.61e-02 | 0.0894 |
| 79759 | ZNF668 | P40T-E | Human | Esophagus | ESCC | 6.02e-03 | 1.16e-01 | 0.109 |
| 79759 | ZNF668 | P42T-E | Human | Esophagus | ESCC | 1.06e-07 | 1.54e-01 | 0.1175 |
| 79759 | ZNF668 | P47T-E | Human | Esophagus | ESCC | 4.04e-08 | 1.16e-01 | 0.1067 |
| 79759 | ZNF668 | P48T-E | Human | Esophagus | ESCC | 2.63e-03 | 1.36e-01 | 0.0959 |
| 79759 | ZNF668 | P49T-E | Human | Esophagus | ESCC | 1.01e-09 | 5.57e-01 | 0.1768 |
| 79759 | ZNF668 | P52T-E | Human | Esophagus | ESCC | 1.18e-12 | 2.66e-01 | 0.1555 |
| 79759 | ZNF668 | P54T-E | Human | Esophagus | ESCC | 3.02e-03 | 1.01e-01 | 0.0975 |
| 79759 | ZNF668 | P57T-E | Human | Esophagus | ESCC | 7.34e-06 | 1.34e-01 | 0.0926 |
| 79759 | ZNF668 | P61T-E | Human | Esophagus | ESCC | 6.24e-10 | 1.35e-01 | 0.099 |
| 79759 | ZNF668 | P62T-E | Human | Esophagus | ESCC | 4.91e-25 | 3.36e-01 | 0.1302 |
| 79759 | ZNF668 | P65T-E | Human | Esophagus | ESCC | 5.73e-09 | 1.30e-01 | 0.0978 |
| 79759 | ZNF668 | P74T-E | Human | Esophagus | ESCC | 8.95e-06 | 2.14e-01 | 0.1479 |
| 79759 | ZNF668 | P75T-E | Human | Esophagus | ESCC | 4.93e-20 | 3.20e-01 | 0.1125 |
| Page: 1 2 3 |
| Tissue | Expression Dynamics | Abbreviation |
| Esophagus | 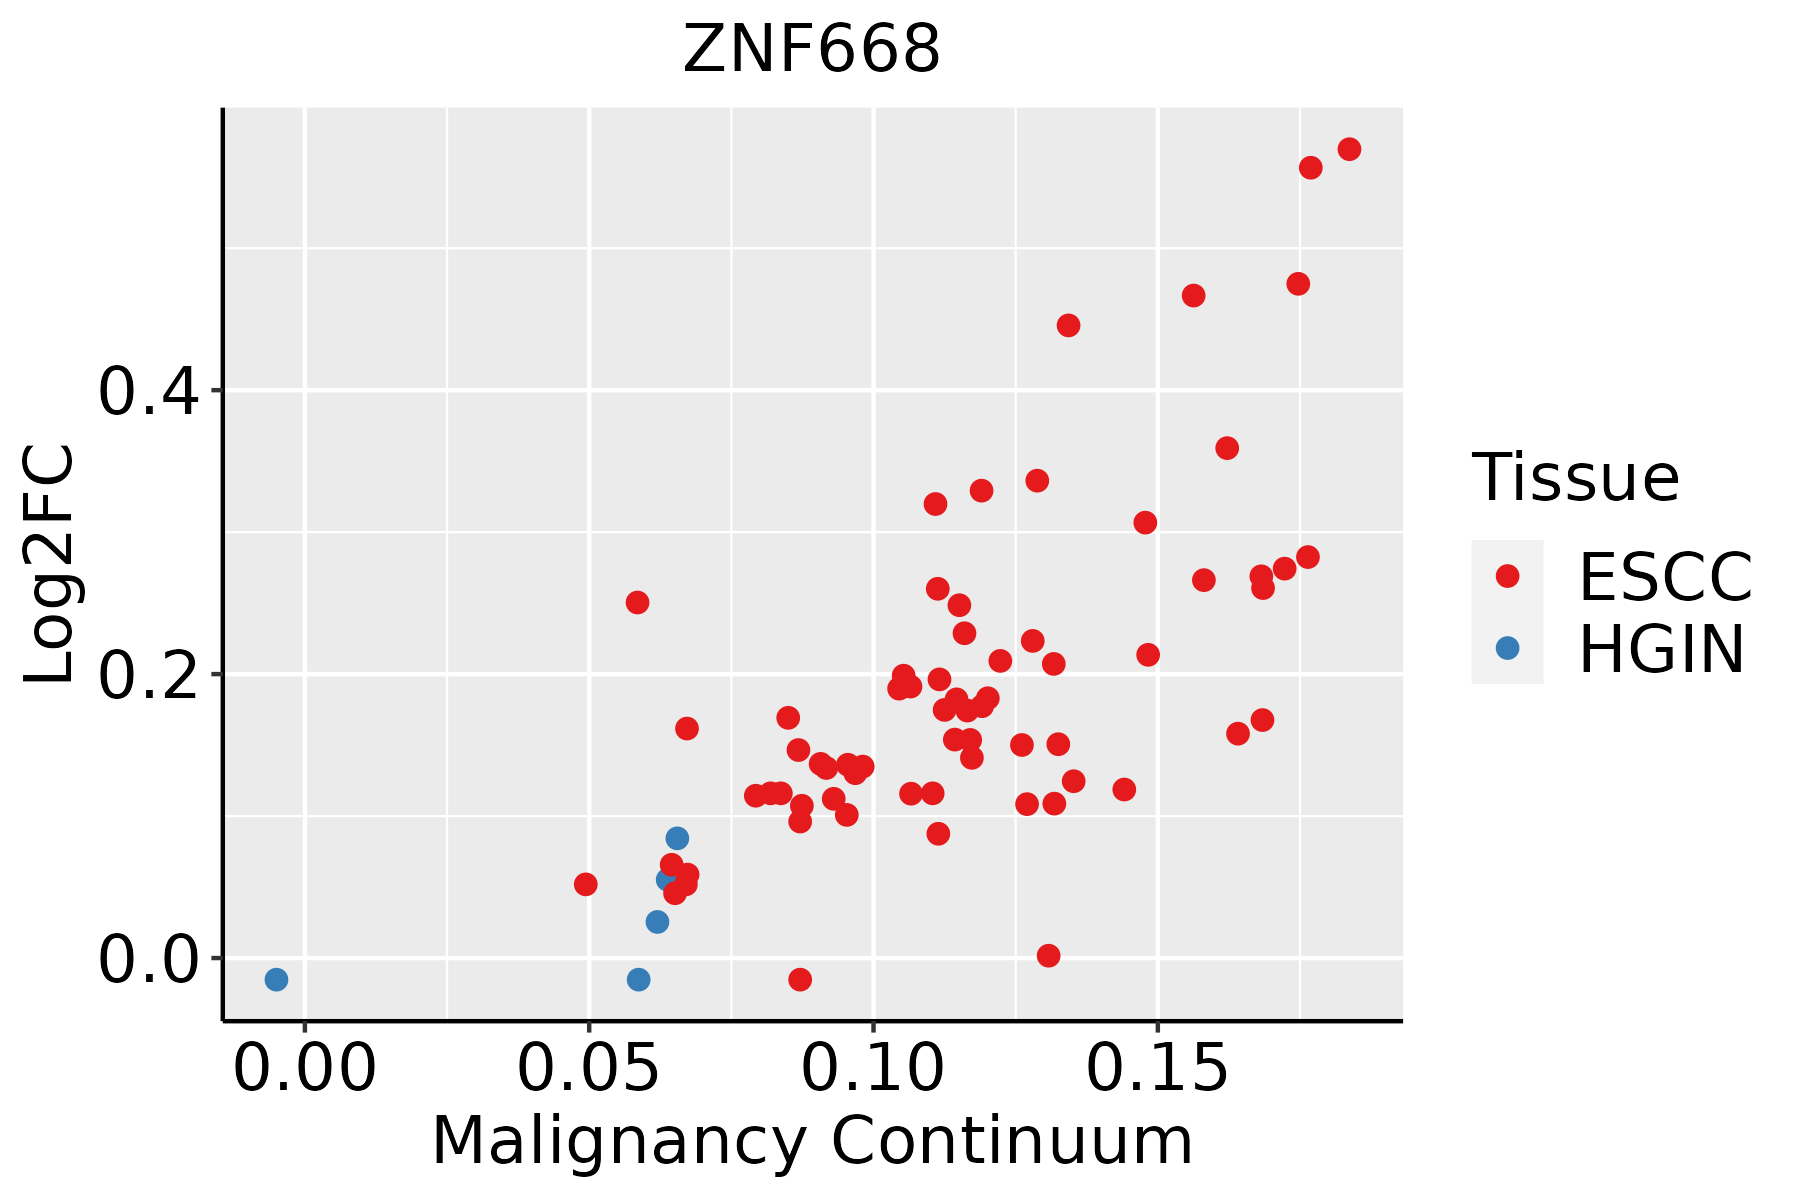 | ESCC: Esophageal squamous cell carcinoma |
| HGIN: High-grade intraepithelial neoplasias | ||
| LGIN: Low-grade intraepithelial neoplasias | ||
| Thyroid |  | ATC: Anaplastic thyroid cancer |
| HT: Hashimoto's thyroiditis | ||
| PTC: Papillary thyroid cancer |
| ∗log2FC in expression of this searched gene in stem-like cells from each diseased tissue sample relative to stem-like cells in normal samples in each tissue plotted against the malignancy continuum. Samples are colored based on if they are from different disease stage. |
Top |
Malignant transformation related pathway analysis |
| Find out the enriched GO biological processes and KEGG pathways involved in transition from healthy to precancer to cancer |
| Tissue | Disease Stage | Enriched GO biological Processes |
| Colorectum | AD |  |
| Colorectum | SER |  |
| Colorectum | MSS |  |
| Colorectum | MSI-H |  |
| Colorectum | FAP |  |
| ∗Top 15 enriched GO BP terms are showed in the bar plot of each disease state in each tissue. Each row represents a significant GO biological process which is colored according to the -log10(p.adjust). |
| Page: 1 2 3 4 5 6 7 8 9 |
| GO ID | Tissue | Disease Stage | Description | Gene Ratio | Bg Ratio | pvalue | p.adjust | Count |
| Page: 1 |
| Pathway ID | Tissue | Disease Stage | Description | Gene Ratio | Bg Ratio | pvalue | p.adjust | qvalue | Count |
| Page: 1 |
Top |
Cell-cell communication analysis |
| Identification of potential cell-cell interactions between two cell types and their ligand-receptor pairs for different disease states |
| Ligand | Receptor | LRpair | Pathway | Tissue | Disease Stage |
| Page: 1 |
Top |
Single-cell gene regulatory network inference analysis |
| Find out the significant the regulons (TFs) and the target genes of each regulon across cell types for different disease states |
| TF | Cell Type | Tissue | Disease Stage | Target Gene | RSS | Regulon Activity |
| ZNF668 | BAS | Lung | AIS | ZSCAN30,SNX15,AC018816.1, etc. | 0.00e+00 |  |
| ZNF668 | ABP | Lung | AIS | ZSCAN30,SNX15,AC018816.1, etc. | 1.87e-03 | |
| ZNF668 | BAS | Lung | IAC | ZSCAN30,SNX15,AC018816.1, etc. | 1.12e-03 |  |
| ZNF668 | ABP | Lung | MIAC | ZSCAN30,SNX15,AC018816.1, etc. | 1.88e-03 |  |
| ZNF668 | BAS | Lung | MIAC | ZSCAN30,SNX15,AC018816.1, etc. | 4.44e-16 | |
| ZNF668 | ECM | Oral cavity | LP | GPR1,HSD3B7,HTRA3, etc. | 3.73e-01 |  |
| ZNF668 | PERI | Stomach | ADJ | LINC01278,GCNT2,PMM1, etc. | 1.80e-02 |  |
| ZNF668 | SMC | Stomach | CAG | LINC01278,GCNT2,PMM1, etc. | 3.85e-02 |  |
| ZNF668 | MSC | Stomach | CAG with IM | LINC01278,GCNT2,PMM1, etc. | 1.18e-01 |  |
| ZNF668 | LYMEND | Stomach | SIM | LINC01278,GCNT2,PMM1, etc. | 1.89e-01 |  |
| ∗The dot plots of a searched regulon are shown for all cell subpopulations in each disease state of each tissue based on the regulon specific score inferred using pySCENIC and by calculating the average expression. |
| Page: 1 |
Top |
Somatic mutation of malignant transformation related genes |
| Annotation of somatic variants for genes involved in malignant transformation |
| Hugo Symbol | Variant Class | Variant Classification | dbSNP RS | HGVSc | HGVSp | HGVSp Short | SWISSPROT | BIOTYPE | SIFT | PolyPhen | Tumor Sample Barcode | Tissue | Histology | Sex | Age | Stage | Therapy Types | Drugs | Outcome |
| ZNF668 | SNV | Missense_Mutation | rs775410937 | c.1229N>T | p.Ser410Leu | p.S410L | Q96K58 | protein_coding | tolerated(0.05) | probably_damaging(0.998) | TCGA-E2-A15H-01 | Breast | breast invasive carcinoma | Female | <65 | I/II | Chemotherapy | herceptin | SD |
| ZNF668 | insertion | Nonsense_Mutation | novel | c.1710_1711insTATCTCTACTGAAAA | p.Thr570_Gln571insTyrLeuTyrTerLys | p.T570_Q571insYLY*K | Q96K58 | protein_coding | TCGA-A7-A0CG-01 | Breast | breast invasive carcinoma | Female | >=65 | I/II | Unknown | Unknown | SD | ||
| ZNF668 | insertion | In_Frame_Ins | novel | c.1708_1709insACATGGTGAAGC | p.Thr570delinsAsnMetValLysPro | p.T570delinsNMVKP | Q96K58 | protein_coding | TCGA-A7-A0CG-01 | Breast | breast invasive carcinoma | Female | >=65 | I/II | Unknown | Unknown | SD | ||
| ZNF668 | SNV | Missense_Mutation | c.958N>T | p.Arg320Cys | p.R320C | Q96K58 | protein_coding | deleterious(0) | probably_damaging(0.999) | TCGA-C5-A1BI-01 | Cervix | cervical & endocervical cancer | Female | <65 | III/IV | Chemotherapy | cisplatin | SD | |
| ZNF668 | SNV | Missense_Mutation | c.149G>C | p.Cys50Ser | p.C50S | Q96K58 | protein_coding | deleterious(0.01) | probably_damaging(0.99) | TCGA-Q1-A73O-01 | Cervix | cervical & endocervical cancer | Female | <65 | I/II | Chemotherapy | cisplatin | CR | |
| ZNF668 | SNV | Missense_Mutation | novel | c.1600N>A | p.Glu534Lys | p.E534K | Q96K58 | protein_coding | deleterious(0.05) | benign(0.003) | TCGA-VS-A959-01 | Cervix | cervical & endocervical cancer | Female | >=65 | I/II | Unknown | Unknown | SD |
| ZNF668 | SNV | Missense_Mutation | c.566G>A | p.Arg189Gln | p.R189Q | Q96K58 | protein_coding | deleterious(0.01) | possibly_damaging(0.899) | TCGA-4N-A93T-01 | Colorectum | colon adenocarcinoma | Male | >=65 | III/IV | Chemotherapy | xeloda | SD | |
| ZNF668 | SNV | Missense_Mutation | c.1154N>A | p.Arg385Gln | p.R385Q | Q96K58 | protein_coding | tolerated(0.06) | possibly_damaging(0.712) | TCGA-A6-2686-01 | Colorectum | colon adenocarcinoma | Female | >=65 | I/II | Unknown | Unknown | SD | |
| ZNF668 | SNV | Missense_Mutation | c.1655N>T | p.Thr552Met | p.T552M | Q96K58 | protein_coding | deleterious(0.01) | benign(0.057) | TCGA-AA-3715-01 | Colorectum | colon adenocarcinoma | Male | >=65 | I/II | Unknown | Unknown | PD | |
| ZNF668 | SNV | Missense_Mutation | rs763330703 | c.1777N>T | p.Arg593Cys | p.R593C | Q96K58 | protein_coding | tolerated(0.08) | probably_damaging(0.996) | TCGA-AA-A02R-01 | Colorectum | colon adenocarcinoma | Female | >=65 | I/II | Unknown | Unknown | PD |
| Page: 1 2 3 4 5 6 7 8 |
Top |
Related drugs of malignant transformation related genes |
| Identification of chemicals and drugs interact with genes involved in malignant transfromation |
| (DGIdb 4.0) |
| Entrez ID | Symbol | Category | Interaction Types | Drug Claim Name | Drug Name | PMIDs |
| Page: 1 |

Copyright 2023-Present -The University of Texas Health Science Center at Houston |