
|
|||||
|
 | |
| |
| |
| |
| |
| |
|
Gene: ZNF414 |
Gene summary for ZNF414 |
| Gene information | Species | Human | Gene symbol | ZNF414 | Gene ID | 84330 |
| Gene name | zinc finger protein 414 | |
| Gene Alias | ZFP414 | |
| Cytomap | 19p13.2 | |
| Gene Type | protein-coding | GO ID | GO:0006139 | UniProtAcc | Q96IQ9 |
Top |
Malignant transformation analysis |
| Identification of the aberrant gene expression in precancerous and cancerous lesions by comparing the gene expression of stem-like cells in diseased tissues with normal stem cells |
| Entrez ID | Symbol | Replicates | Species | Organ | Tissue | Adj P-value | Log2FC | Malignancy |
| 84330 | ZNF414 | P26T-E | Human | Esophagus | ESCC | 3.58e-28 | 5.03e-01 | 0.1276 |
| 84330 | ZNF414 | P27T-E | Human | Esophagus | ESCC | 1.85e-18 | 3.22e-01 | 0.1055 |
| 84330 | ZNF414 | P28T-E | Human | Esophagus | ESCC | 1.35e-23 | 3.80e-01 | 0.1149 |
| 84330 | ZNF414 | P30T-E | Human | Esophagus | ESCC | 1.72e-15 | 4.19e-01 | 0.137 |
| 84330 | ZNF414 | P31T-E | Human | Esophagus | ESCC | 5.79e-16 | 2.71e-01 | 0.1251 |
| 84330 | ZNF414 | P32T-E | Human | Esophagus | ESCC | 7.31e-14 | 2.54e-01 | 0.1666 |
| 84330 | ZNF414 | P36T-E | Human | Esophagus | ESCC | 9.86e-13 | 3.03e-01 | 0.1187 |
| 84330 | ZNF414 | P37T-E | Human | Esophagus | ESCC | 2.04e-14 | 2.86e-01 | 0.1371 |
| 84330 | ZNF414 | P38T-E | Human | Esophagus | ESCC | 5.18e-03 | 1.53e-01 | 0.127 |
| 84330 | ZNF414 | P39T-E | Human | Esophagus | ESCC | 8.40e-04 | 1.01e-01 | 0.0894 |
| 84330 | ZNF414 | P40T-E | Human | Esophagus | ESCC | 7.96e-15 | 3.90e-01 | 0.109 |
| 84330 | ZNF414 | P42T-E | Human | Esophagus | ESCC | 3.67e-21 | 5.29e-01 | 0.1175 |
| 84330 | ZNF414 | P44T-E | Human | Esophagus | ESCC | 5.62e-06 | 1.91e-01 | 0.1096 |
| 84330 | ZNF414 | P47T-E | Human | Esophagus | ESCC | 3.89e-12 | 1.90e-01 | 0.1067 |
| 84330 | ZNF414 | P48T-E | Human | Esophagus | ESCC | 4.40e-09 | 2.10e-01 | 0.0959 |
| 84330 | ZNF414 | P49T-E | Human | Esophagus | ESCC | 2.24e-09 | 5.11e-01 | 0.1768 |
| 84330 | ZNF414 | P52T-E | Human | Esophagus | ESCC | 4.24e-18 | 3.12e-01 | 0.1555 |
| 84330 | ZNF414 | P54T-E | Human | Esophagus | ESCC | 3.86e-09 | 2.22e-01 | 0.0975 |
| 84330 | ZNF414 | P57T-E | Human | Esophagus | ESCC | 9.44e-07 | 1.34e-01 | 0.0926 |
| 84330 | ZNF414 | P61T-E | Human | Esophagus | ESCC | 9.26e-15 | 2.84e-01 | 0.099 |
| Page: 1 2 3 4 |
| Tissue | Expression Dynamics | Abbreviation |
| Esophagus |  | ESCC: Esophageal squamous cell carcinoma |
| HGIN: High-grade intraepithelial neoplasias | ||
| LGIN: Low-grade intraepithelial neoplasias | ||
| Oral Cavity | 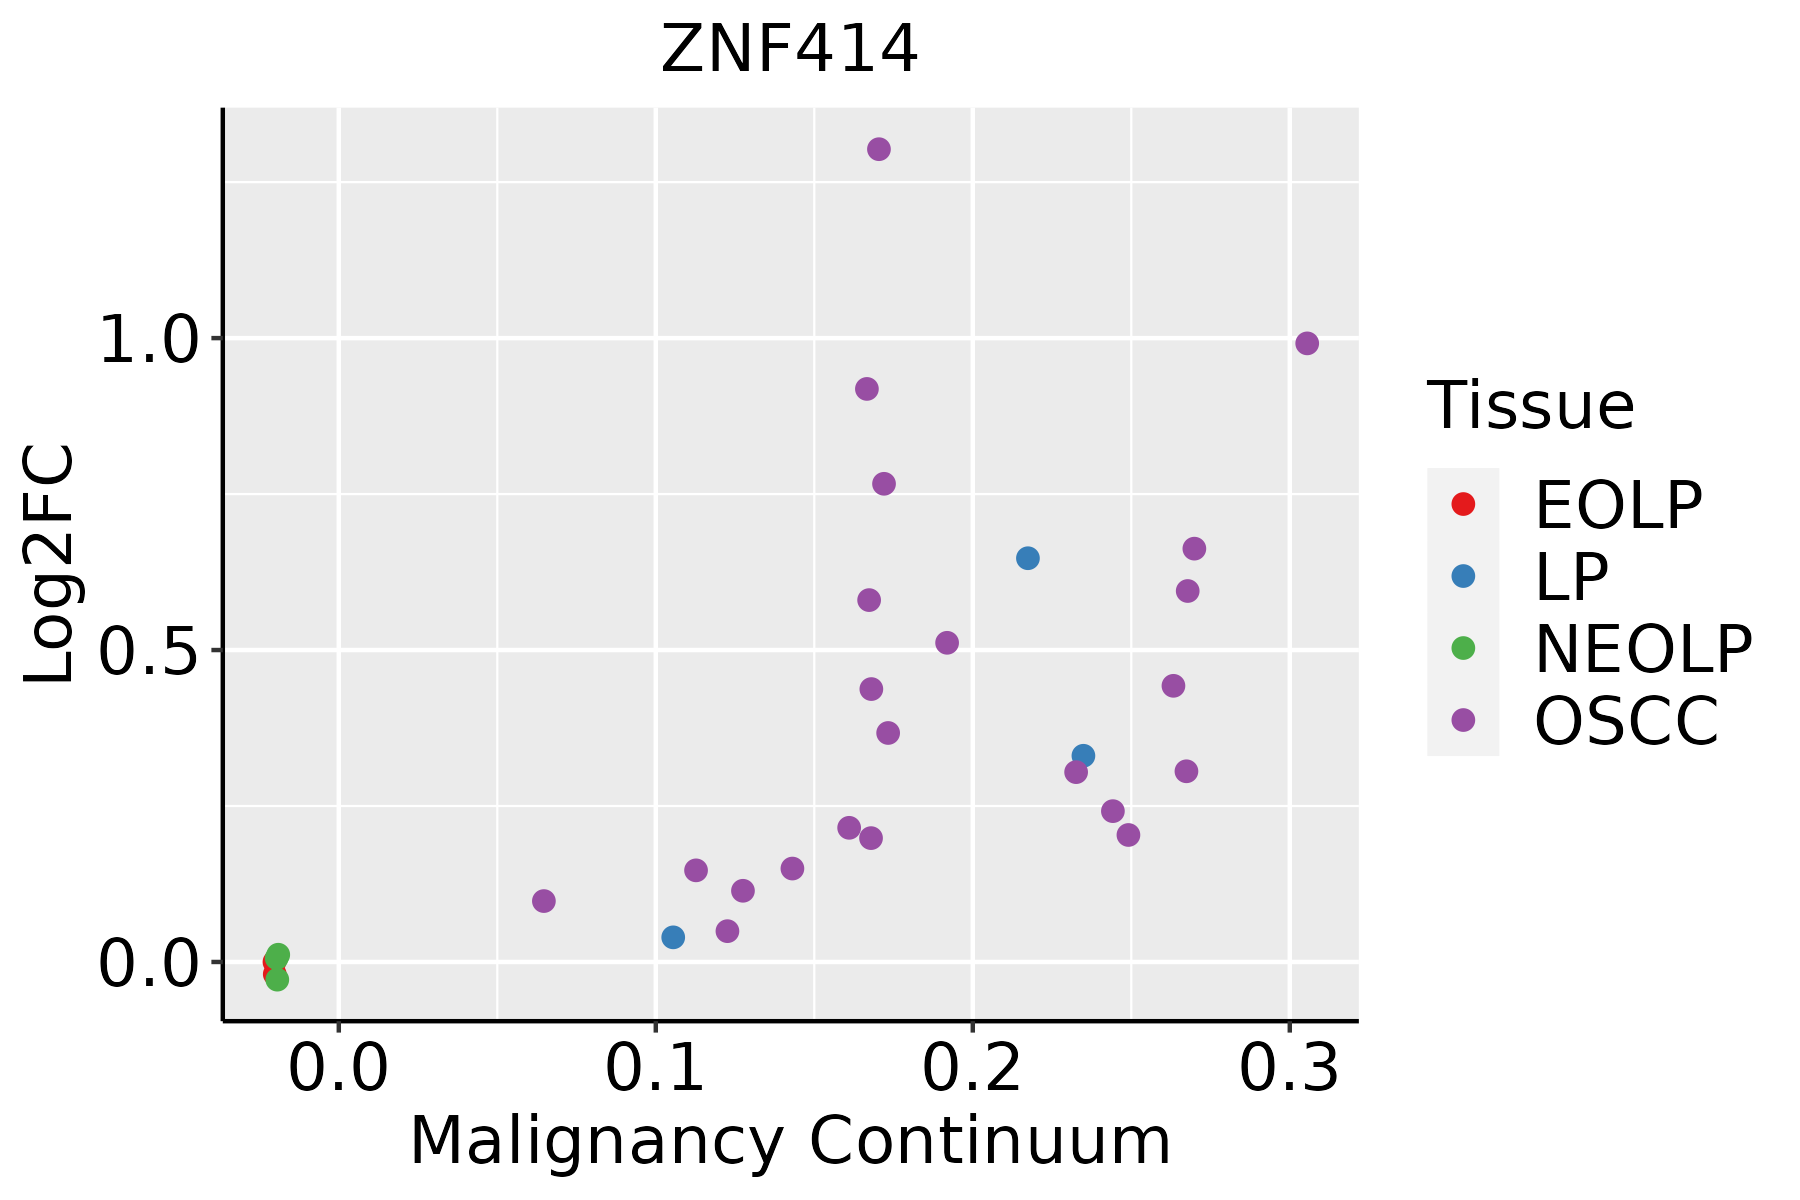 | EOLP: Erosive Oral lichen planus |
| LP: leukoplakia | ||
| NEOLP: Non-erosive oral lichen planus | ||
| OSCC: Oral squamous cell carcinoma | ||
| Skin | 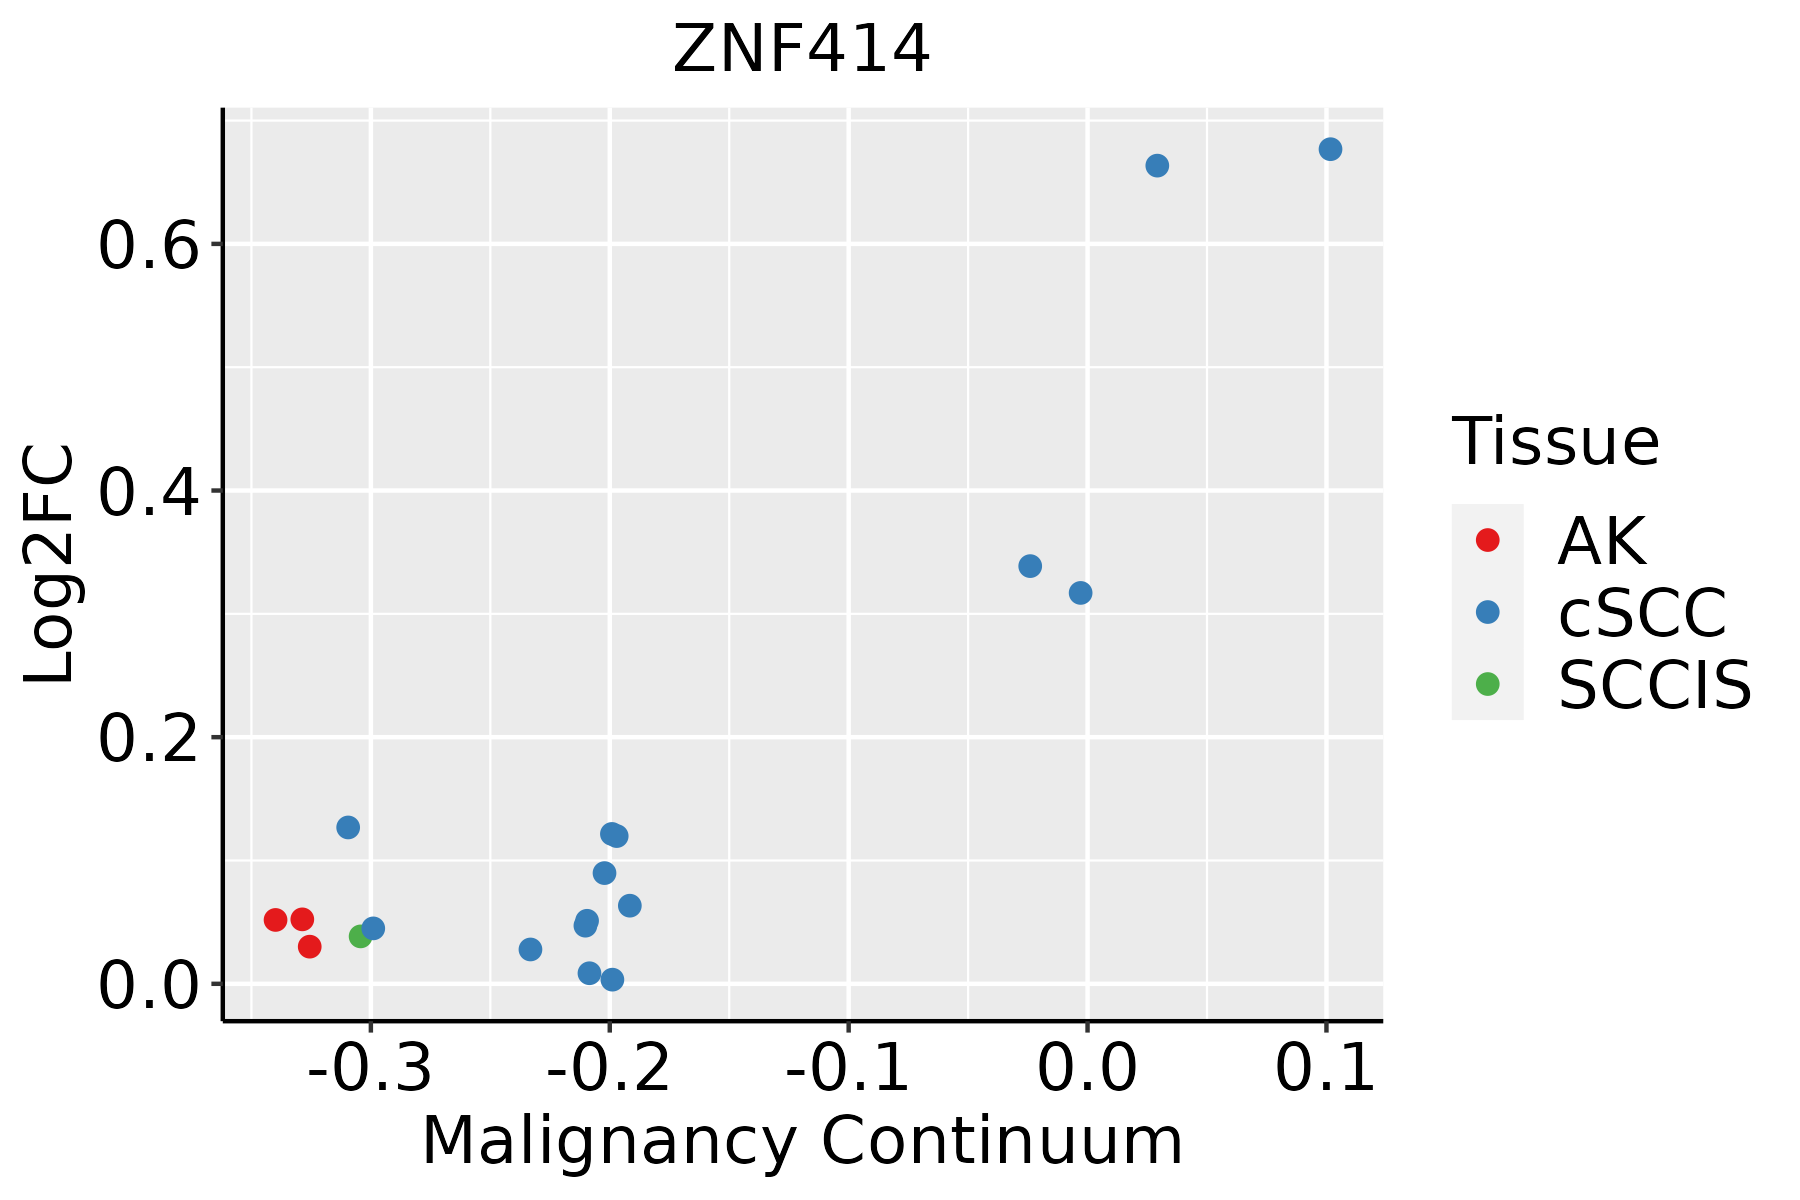 | AK: Actinic keratosis |
| cSCC: Cutaneous squamous cell carcinoma | ||
| SCCIS:squamous cell carcinoma in situ |
| ∗log2FC in expression of this searched gene in stem-like cells from each diseased tissue sample relative to stem-like cells in normal samples in each tissue plotted against the malignancy continuum. Samples are colored based on if they are from different disease stage. |
Top |
Malignant transformation related pathway analysis |
| Find out the enriched GO biological processes and KEGG pathways involved in transition from healthy to precancer to cancer |
| Tissue | Disease Stage | Enriched GO biological Processes |
| Colorectum | AD |  |
| Colorectum | SER |  |
| Colorectum | MSS |  |
| Colorectum | MSI-H |  |
| Colorectum | FAP |  |
| ∗Top 15 enriched GO BP terms are showed in the bar plot of each disease state in each tissue. Each row represents a significant GO biological process which is colored according to the -log10(p.adjust). |
| Page: 1 2 3 4 5 6 7 8 9 |
| GO ID | Tissue | Disease Stage | Description | Gene Ratio | Bg Ratio | pvalue | p.adjust | Count |
| Page: 1 |
| Pathway ID | Tissue | Disease Stage | Description | Gene Ratio | Bg Ratio | pvalue | p.adjust | qvalue | Count |
| Page: 1 |
Top |
Cell-cell communication analysis |
| Identification of potential cell-cell interactions between two cell types and their ligand-receptor pairs for different disease states |
| Ligand | Receptor | LRpair | Pathway | Tissue | Disease Stage |
| Page: 1 |
Top |
Single-cell gene regulatory network inference analysis |
| Find out the significant the regulons (TFs) and the target genes of each regulon across cell types for different disease states |
| TF | Cell Type | Tissue | Disease Stage | Target Gene | RSS | Regulon Activity |
| ZNF414 | GDT | Cervix | ADJ | ISG15,LINC00892,IFI27, etc. | 1.33e-01 |  |
| ZNF414 | CD8TEREX | Cervix | CC | ISG15,LINC00892,IFI27, etc. | 4.74e-02 |  |
| ZNF414 | CD8TCM | Cervix | CC | ISG15,LINC00892,IFI27, etc. | 1.04e-01 | |
| ZNF414 | GDT | Cervix | CC | ISG15,LINC00892,IFI27, etc. | 2.01e-01 | |
| ZNF414 | CD8TEXINT | Cervix | CC | ISG15,LINC00892,IFI27, etc. | 1.45e-01 | |
| ZNF414 | GDT | Cervix | Healthy | ISG15,LINC00892,IFI27, etc. | 2.89e-01 |  |
| ZNF414 | CD8TEREX | Cervix | Healthy | ISG15,LINC00892,IFI27, etc. | 3.22e-02 | |
| ZNF414 | CD8TEXINT | Cervix | Healthy | ISG15,LINC00892,IFI27, etc. | 2.28e-02 | |
| ZNF414 | GDT | Cervix | HSIL_HPV | ISG15,LINC00892,IFI27, etc. | 3.42e-01 |  |
| ZNF414 | GDT | Cervix | N_HPV | ISG15,LINC00892,IFI27, etc. | 2.46e-01 |  |
| ∗The dot plots of a searched regulon are shown for all cell subpopulations in each disease state of each tissue based on the regulon specific score inferred using pySCENIC and by calculating the average expression. |
| Page: 1 2 |
Top |
Somatic mutation of malignant transformation related genes |
| Annotation of somatic variants for genes involved in malignant transformation |
| Hugo Symbol | Variant Class | Variant Classification | dbSNP RS | HGVSc | HGVSp | HGVSp Short | SWISSPROT | BIOTYPE | SIFT | PolyPhen | Tumor Sample Barcode | Tissue | Histology | Sex | Age | Stage | Therapy Types | Drugs | Outcome |
| ZNF414 | SNV | Missense_Mutation | novel | c.1139N>T | p.Ser380Leu | p.S380L | Q96IQ9 | protein_coding | tolerated(0.06) | benign(0.003) | TCGA-BH-A0B6-01 | Breast | breast invasive carcinoma | Female | <65 | I/II | Unknown | Unknown | SD |
| ZNF414 | SNV | Missense_Mutation | rs763516794 | c.437G>A | p.Arg146His | p.R146H | Q96IQ9 | protein_coding | tolerated(0.28) | probably_damaging(0.989) | TCGA-D8-A1Y3-01 | Breast | breast invasive carcinoma | Female | <65 | III/IV | Chemotherapy | doxorubicine+cyclophosphamide | SD |
| ZNF414 | SNV | Missense_Mutation | rs188164067 | c.304N>T | p.Arg102Cys | p.R102C | Q96IQ9 | protein_coding | deleterious(0) | probably_damaging(0.994) | TCGA-2W-A8YY-01 | Cervix | cervical & endocervical cancer | Female | <65 | I/II | Chemotherapy | cisplatin | CR |
| ZNF414 | SNV | Missense_Mutation | rs762887348 | c.125N>T | p.Ser42Leu | p.S42L | Q96IQ9 | protein_coding | tolerated_low_confidence(0.13) | benign(0) | TCGA-A6-5661-01 | Colorectum | colon adenocarcinoma | Female | >=65 | I/II | Unknown | Unknown | SD |
| ZNF414 | SNV | Missense_Mutation | c.903N>T | p.Gln301His | p.Q301H | Q96IQ9 | protein_coding | tolerated(0.08) | probably_damaging(0.986) | TCGA-AZ-6598-01 | Colorectum | colon adenocarcinoma | Female | >=65 | I/II | Unknown | Unknown | SD | |
| ZNF414 | SNV | Missense_Mutation | c.542G>A | p.Cys181Tyr | p.C181Y | Q96IQ9 | protein_coding | deleterious(0) | probably_damaging(0.995) | TCGA-CM-5868-01 | Colorectum | colon adenocarcinoma | Female | <65 | I/II | Chemotherapy | fluorouracil | SD | |
| ZNF414 | SNV | Missense_Mutation | novel | c.296C>A | p.Pro99His | p.P99H | Q96IQ9 | protein_coding | deleterious(0.05) | possibly_damaging(0.739) | TCGA-AP-A1DK-01 | Endometrium | uterine corpus endometrioid carcinoma | Female | <65 | I/II | Unknown | Unknown | SD |
| ZNF414 | SNV | Missense_Mutation | rs762887348 | c.125N>T | p.Ser42Leu | p.S42L | Q96IQ9 | protein_coding | tolerated_low_confidence(0.13) | benign(0) | TCGA-AP-A1DV-01 | Endometrium | uterine corpus endometrioid carcinoma | Female | <65 | I/II | Unknown | Unknown | SD |
| ZNF414 | SNV | Missense_Mutation | novel | c.1123N>A | p.Val375Met | p.V375M | Q96IQ9 | protein_coding | tolerated(0.17) | possibly_damaging(0.656) | TCGA-BK-A13B-01 | Endometrium | uterine corpus endometrioid carcinoma | Female | <65 | I/II | Unknown | Unknown | PD |
| ZNF414 | SNV | Missense_Mutation | novel | c.477G>A | p.Met159Ile | p.M159I | Q96IQ9 | protein_coding | deleterious(0) | probably_damaging(0.922) | TCGA-EY-A5W2-01 | Endometrium | uterine corpus endometrioid carcinoma | Female | >=65 | I/II | Unknown | Unknown | SD |
| Page: 1 2 |
Top |
Related drugs of malignant transformation related genes |
| Identification of chemicals and drugs interact with genes involved in malignant transfromation |
| (DGIdb 4.0) |
| Entrez ID | Symbol | Category | Interaction Types | Drug Claim Name | Drug Name | PMIDs |
| Page: 1 |

Copyright 2023-Present -The University of Texas Health Science Center at Houston |