
|
|||||
|
 | |
| |
| |
| |
| |
| |
|
Gene: ZNF362 |
Gene summary for ZNF362 |
| Gene information | Species | Human | Gene symbol | ZNF362 | Gene ID | 149076 |
| Gene name | zinc finger protein 362 | |
| Gene Alias | RN | |
| Cytomap | 1p35.1 | |
| Gene Type | protein-coding | GO ID | GO:0006139 | UniProtAcc | Q5T0B9 |
Top |
Malignant transformation analysis |
| Identification of the aberrant gene expression in precancerous and cancerous lesions by comparing the gene expression of stem-like cells in diseased tissues with normal stem cells |
| Entrez ID | Symbol | Replicates | Species | Organ | Tissue | Adj P-value | Log2FC | Malignancy |
| 149076 | ZNF362 | P27T-E | Human | Esophagus | ESCC | 3.90e-10 | 2.09e-01 | 0.1055 |
| 149076 | ZNF362 | P28T-E | Human | Esophagus | ESCC | 1.86e-07 | 2.08e-01 | 0.1149 |
| 149076 | ZNF362 | P30T-E | Human | Esophagus | ESCC | 2.83e-13 | 3.18e-01 | 0.137 |
| 149076 | ZNF362 | P31T-E | Human | Esophagus | ESCC | 1.28e-19 | 2.84e-01 | 0.1251 |
| 149076 | ZNF362 | P32T-E | Human | Esophagus | ESCC | 1.50e-05 | 1.16e-01 | 0.1666 |
| 149076 | ZNF362 | P36T-E | Human | Esophagus | ESCC | 2.69e-05 | 2.55e-01 | 0.1187 |
| 149076 | ZNF362 | P37T-E | Human | Esophagus | ESCC | 4.52e-04 | 2.09e-01 | 0.1371 |
| 149076 | ZNF362 | P42T-E | Human | Esophagus | ESCC | 3.29e-10 | 2.60e-01 | 0.1175 |
| 149076 | ZNF362 | P44T-E | Human | Esophagus | ESCC | 6.15e-06 | 1.53e-01 | 0.1096 |
| 149076 | ZNF362 | P48T-E | Human | Esophagus | ESCC | 1.11e-09 | 1.49e-01 | 0.0959 |
| 149076 | ZNF362 | P52T-E | Human | Esophagus | ESCC | 1.20e-04 | 1.07e-01 | 0.1555 |
| 149076 | ZNF362 | P54T-E | Human | Esophagus | ESCC | 2.41e-10 | 1.73e-01 | 0.0975 |
| 149076 | ZNF362 | P57T-E | Human | Esophagus | ESCC | 2.61e-13 | 2.83e-01 | 0.0926 |
| 149076 | ZNF362 | P61T-E | Human | Esophagus | ESCC | 7.21e-10 | 3.39e-01 | 0.099 |
| 149076 | ZNF362 | P62T-E | Human | Esophagus | ESCC | 2.84e-12 | 2.54e-01 | 0.1302 |
| 149076 | ZNF362 | P65T-E | Human | Esophagus | ESCC | 1.94e-10 | 2.40e-01 | 0.0978 |
| 149076 | ZNF362 | P74T-E | Human | Esophagus | ESCC | 1.84e-06 | 2.29e-01 | 0.1479 |
| 149076 | ZNF362 | P75T-E | Human | Esophagus | ESCC | 1.34e-07 | 1.93e-01 | 0.1125 |
| 149076 | ZNF362 | P76T-E | Human | Esophagus | ESCC | 2.11e-13 | 1.88e-01 | 0.1207 |
| 149076 | ZNF362 | P79T-E | Human | Esophagus | ESCC | 4.64e-12 | 2.82e-01 | 0.1154 |
| Page: 1 2 3 |
| Tissue | Expression Dynamics | Abbreviation |
| Esophagus | 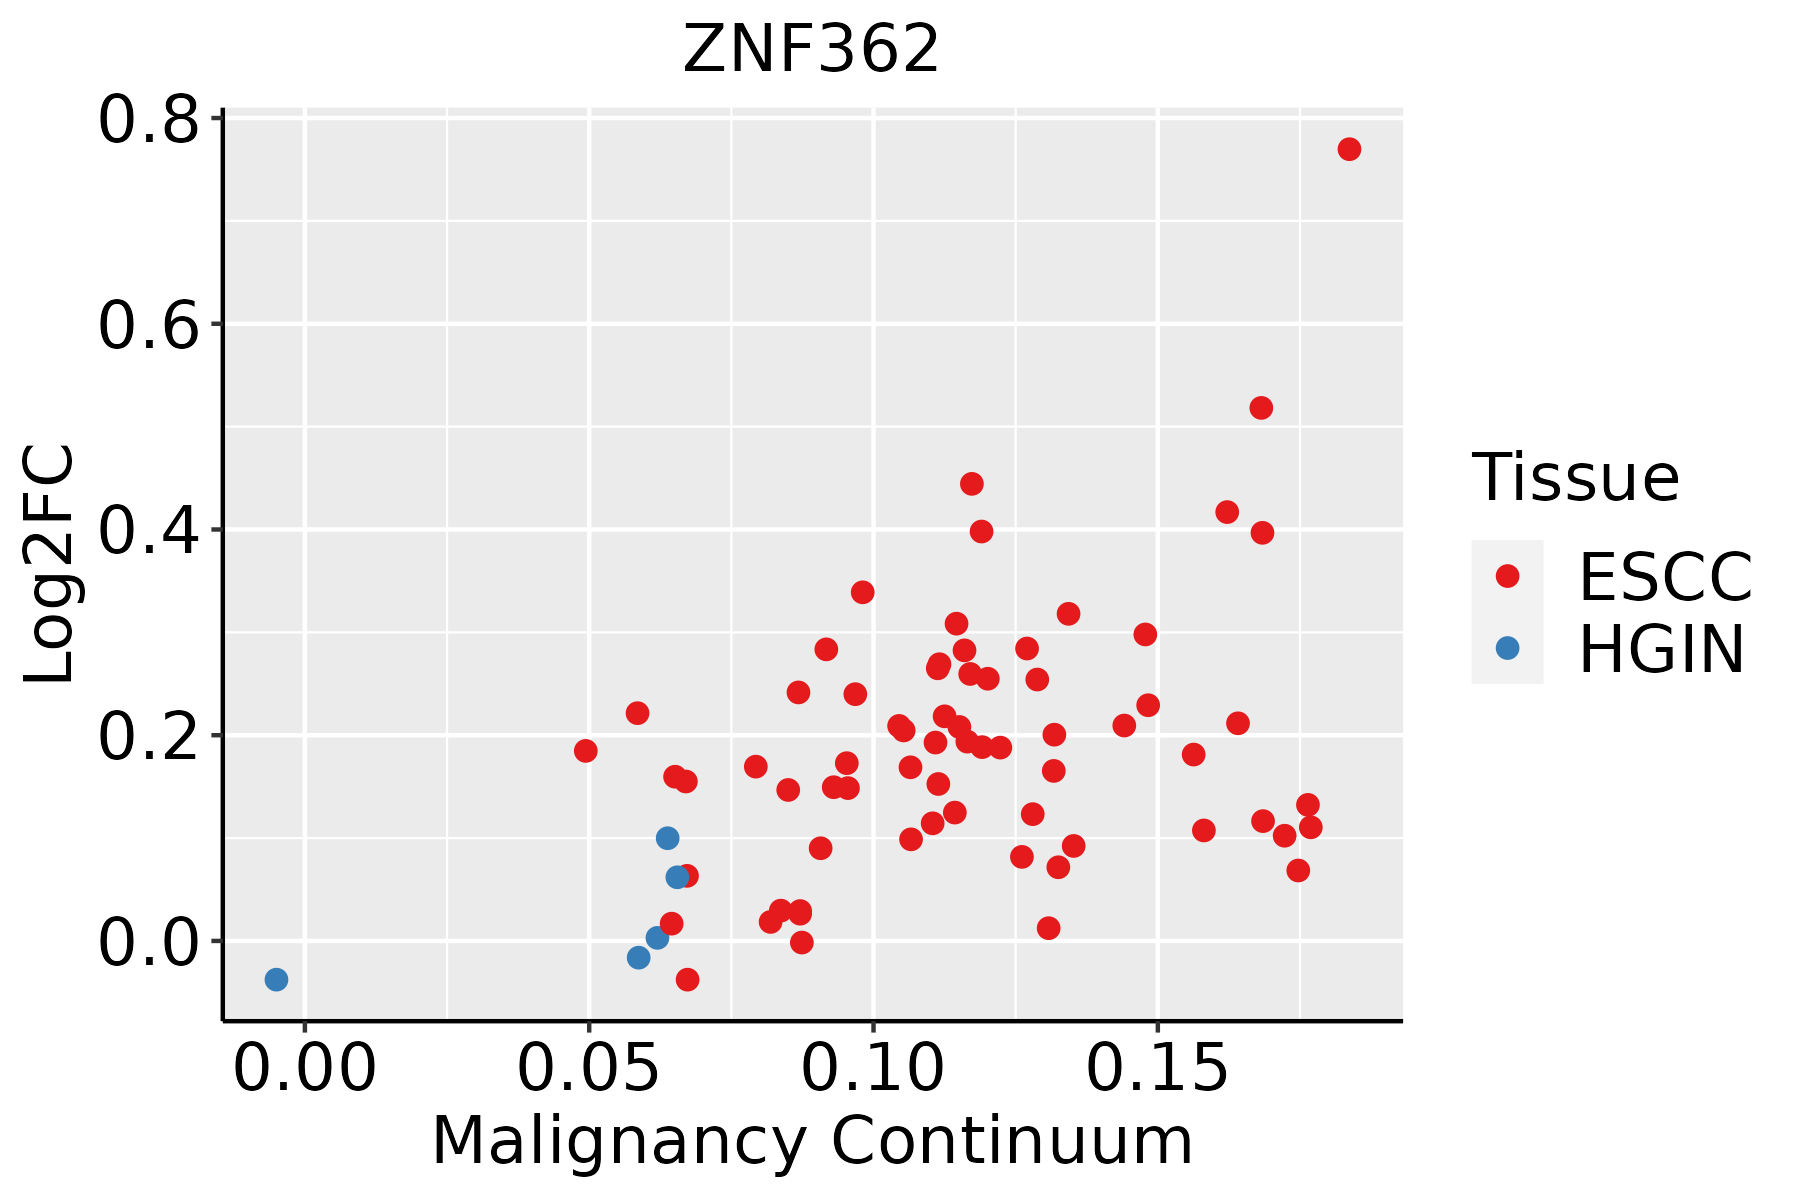 | ESCC: Esophageal squamous cell carcinoma |
| HGIN: High-grade intraepithelial neoplasias | ||
| LGIN: Low-grade intraepithelial neoplasias | ||
| Thyroid | 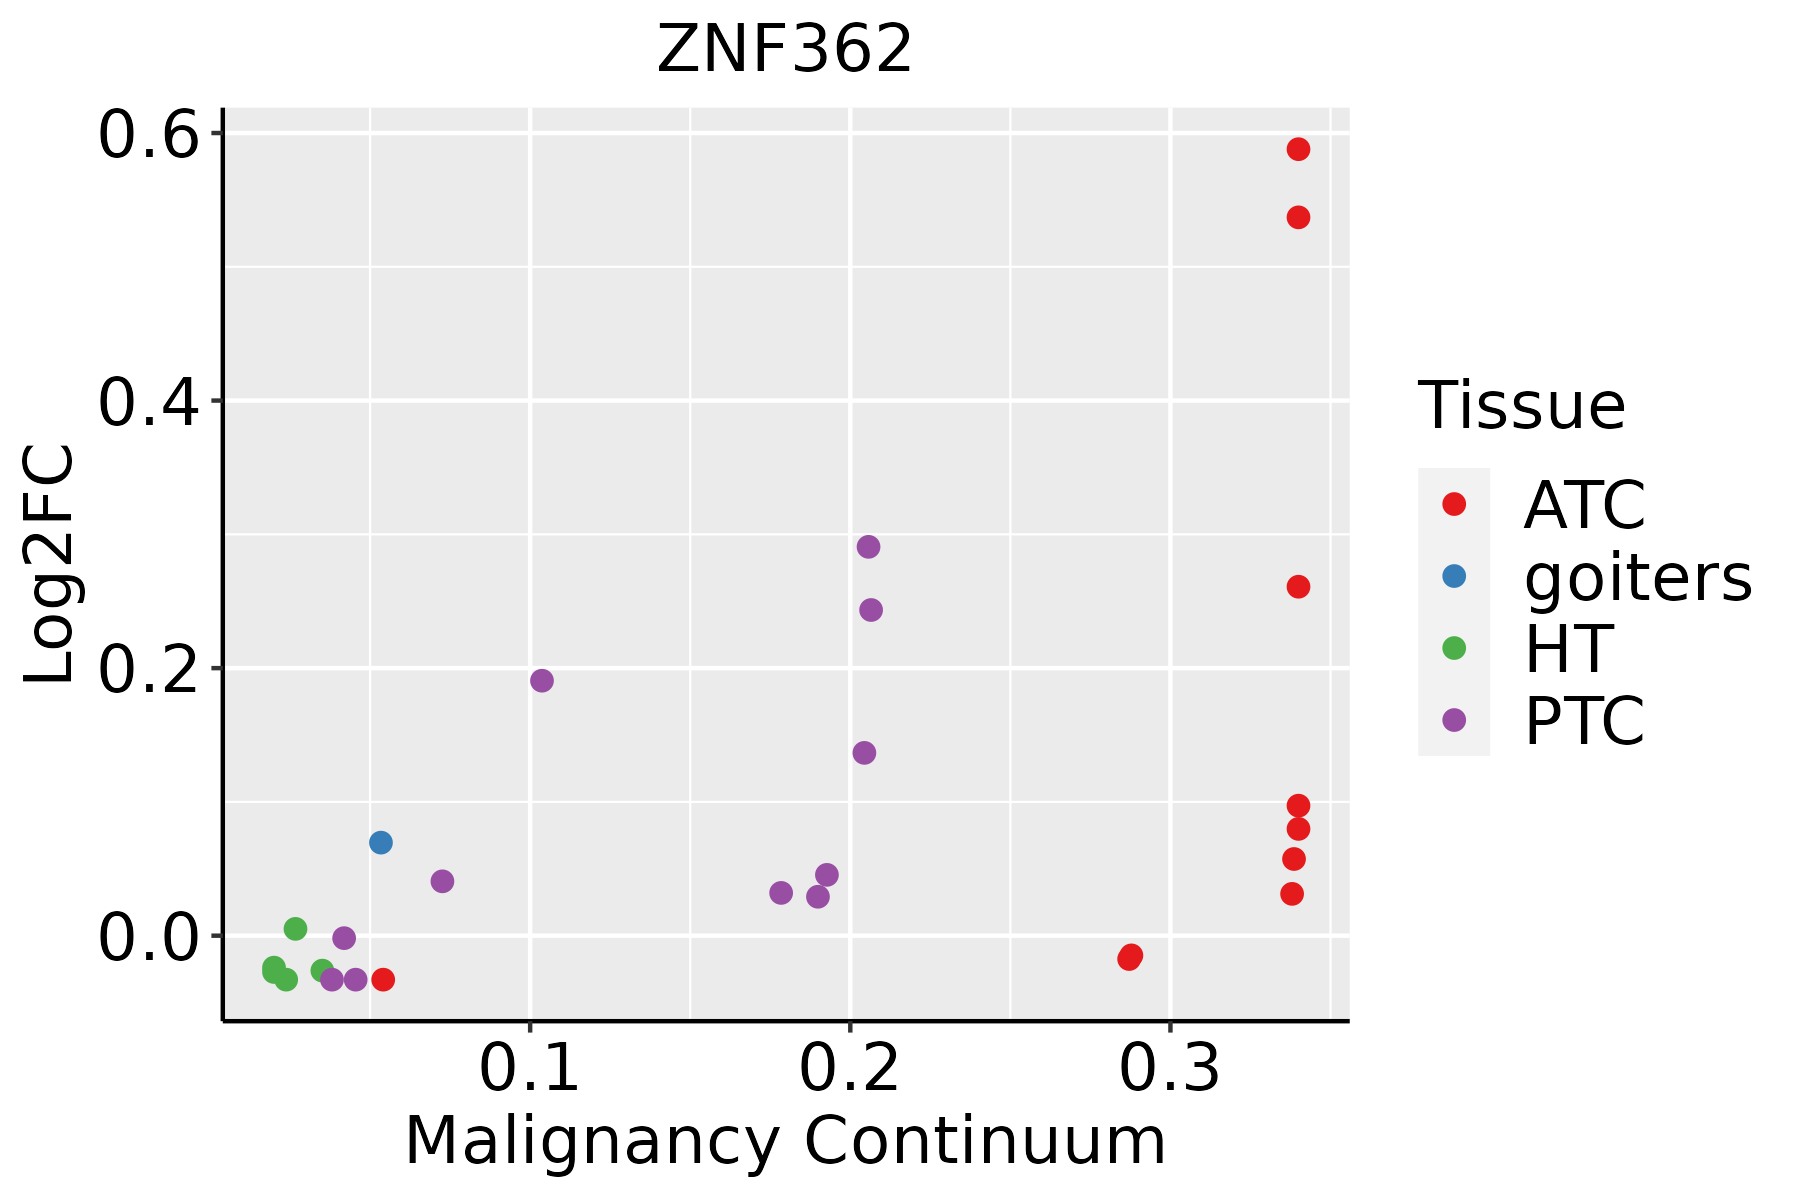 | ATC: Anaplastic thyroid cancer |
| HT: Hashimoto's thyroiditis | ||
| PTC: Papillary thyroid cancer |
| ∗log2FC in expression of this searched gene in stem-like cells from each diseased tissue sample relative to stem-like cells in normal samples in each tissue plotted against the malignancy continuum. Samples are colored based on if they are from different disease stage. |
Top |
Malignant transformation related pathway analysis |
| Find out the enriched GO biological processes and KEGG pathways involved in transition from healthy to precancer to cancer |
| Tissue | Disease Stage | Enriched GO biological Processes |
| Colorectum | AD |  |
| Colorectum | SER |  |
| Colorectum | MSS |  |
| Colorectum | MSI-H |  |
| Colorectum | FAP |  |
| ∗Top 15 enriched GO BP terms are showed in the bar plot of each disease state in each tissue. Each row represents a significant GO biological process which is colored according to the -log10(p.adjust). |
| Page: 1 2 3 4 5 6 7 8 9 |
| GO ID | Tissue | Disease Stage | Description | Gene Ratio | Bg Ratio | pvalue | p.adjust | Count |
| Page: 1 |
| Pathway ID | Tissue | Disease Stage | Description | Gene Ratio | Bg Ratio | pvalue | p.adjust | qvalue | Count |
| Page: 1 |
Top |
Cell-cell communication analysis |
| Identification of potential cell-cell interactions between two cell types and their ligand-receptor pairs for different disease states |
| Ligand | Receptor | LRpair | Pathway | Tissue | Disease Stage |
| Page: 1 |
Top |
Single-cell gene regulatory network inference analysis |
| Find out the significant the regulons (TFs) and the target genes of each regulon across cell types for different disease states |
| TF | Cell Type | Tissue | Disease Stage | Target Gene | RSS | Regulon Activity |
| ZNF362 | BAS | Breast | ADJ | AC116407.2,SAMHD1,CTSK, etc. | 6.28e-02 |  |
| ZNF362 | BAS | Breast | Precancer | AC116407.2,SAMHD1,CTSK, etc. | 4.38e-02 |  |
| ZNF362 | GDT | Cervix | ADJ | CEACAM1,NCS1,COL1A2, etc. | 3.44e-02 |  |
| ZNF362 | CD8TEFF | Cervix | ADJ | CEACAM1,NCS1,COL1A2, etc. | 1.88e-02 | |
| ZNF362 | STM | Colorectum | Healthy | VSNL1,NOVA1,FGF12, etc. | 1.85e-01 |  |
| ZNF362 | CFIB | Colorectum | Healthy | MUSK,CFH,MTERF1, etc. | 1.83e-01 | |
| ZNF362 | NK | Lung | ADJ | TTC13,BCOR,AL121935.1, etc. | 2.20e-01 |  |
| ZNF362 | NK | Oral cavity | ADJ | PRKD3,INPP5F,ZMYM2, etc. | 3.09e-02 |  |
| ZNF362 | CD8TEXINT | Oral cavity | Healthy | PRKD3,INPP5F,ZMYM2, etc. | 9.83e-03 |  |
| ZNF362 | MDSCs | Oral cavity | Healthy | PRKD3,INPP5F,ZMYM2, etc. | 3.10e-03 | |
| ∗The dot plots of a searched regulon are shown for all cell subpopulations in each disease state of each tissue based on the regulon specific score inferred using pySCENIC and by calculating the average expression. |
| Page: 1 2 3 |
Top |
Somatic mutation of malignant transformation related genes |
| Annotation of somatic variants for genes involved in malignant transformation |
| Hugo Symbol | Variant Class | Variant Classification | dbSNP RS | HGVSc | HGVSp | HGVSp Short | SWISSPROT | BIOTYPE | SIFT | PolyPhen | Tumor Sample Barcode | Tissue | Histology | Sex | Age | Stage | Therapy Types | Drugs | Outcome |
| ZNF362 | SNV | Missense_Mutation | rs767611931 | c.614N>T | p.Pro205Leu | p.P205L | Q5T0B9 | protein_coding | tolerated(0.42) | benign(0.212) | TCGA-BH-A0HA-01 | Breast | breast invasive carcinoma | Female | <65 | I/II | Unknown | Unknown | SD |
| ZNF362 | SNV | Missense_Mutation | c.962N>T | p.Ala321Val | p.A321V | Q5T0B9 | protein_coding | deleterious(0) | probably_damaging(0.992) | TCGA-BH-A0HF-01 | Breast | breast invasive carcinoma | Female | >=65 | I/II | Hormone Therapy | arimidex | SD | |
| ZNF362 | SNV | Missense_Mutation | novel | c.883N>T | p.Leu295Phe | p.L295F | Q5T0B9 | protein_coding | deleterious(0) | benign(0.22) | TCGA-VS-A8Q9-01 | Cervix | cervical & endocervical cancer | Female | >=65 | I/II | Unknown | Unknown | SD |
| ZNF362 | SNV | Missense_Mutation | novel | c.478N>C | p.Ser160Pro | p.S160P | Q5T0B9 | protein_coding | tolerated(0.16) | benign(0.26) | TCGA-5M-AAT6-01 | Colorectum | colon adenocarcinoma | Female | <65 | III/IV | Unknown | Unknown | PD |
| ZNF362 | SNV | Missense_Mutation | c.536T>A | p.Ile179Asn | p.I179N | Q5T0B9 | protein_coding | tolerated(0.58) | benign(0.011) | TCGA-A6-5665-01 | Colorectum | colon adenocarcinoma | Female | >=65 | I/II | Unknown | Unknown | PD | |
| ZNF362 | SNV | Missense_Mutation | c.1213C>T | p.Pro405Ser | p.P405S | Q5T0B9 | protein_coding | deleterious_low_confidence(0) | probably_damaging(0.968) | TCGA-AA-A022-01 | Colorectum | colon adenocarcinoma | Female | >=65 | I/II | Unknown | Unknown | SD | |
| ZNF362 | SNV | Missense_Mutation | rs377378847 | c.1060G>A | p.Ala354Thr | p.A354T | Q5T0B9 | protein_coding | tolerated(0.13) | benign(0.102) | TCGA-DM-A28K-01 | Colorectum | colon adenocarcinoma | Male | >=65 | I/II | Unknown | Unknown | SD |
| ZNF362 | SNV | Missense_Mutation | c.696C>G | p.Cys232Trp | p.C232W | Q5T0B9 | protein_coding | deleterious(0) | probably_damaging(0.984) | TCGA-EI-6507-01 | Colorectum | rectum adenocarcinoma | Male | <65 | I/II | Unknown | Unknown | SD | |
| ZNF362 | deletion | Frame_Shift_Del | c.611delG | p.Gly204ValfsTer6 | p.G204Vfs*6 | Q5T0B9 | protein_coding | TCGA-AZ-4615-01 | Colorectum | colon adenocarcinoma | Male | >=65 | III/IV | Chemotherapy | xeloda | PD | |||
| ZNF362 | SNV | Missense_Mutation | rs756484246 | c.547G>A | p.Gly183Ser | p.G183S | Q5T0B9 | protein_coding | tolerated(0.28) | benign(0.001) | TCGA-A5-A1OF-01 | Endometrium | uterine corpus endometrioid carcinoma | Female | <65 | I/II | Unknown | Unknown | SD |
| Page: 1 2 3 4 5 |
Top |
Related drugs of malignant transformation related genes |
| Identification of chemicals and drugs interact with genes involved in malignant transfromation |
| (DGIdb 4.0) |
| Entrez ID | Symbol | Category | Interaction Types | Drug Claim Name | Drug Name | PMIDs |
| Page: 1 |

Copyright 2023-Present -The University of Texas Health Science Center at Houston |