
|
|||||
|
 | |
| |
| |
| |
| |
| |
|
Gene: ZNF267 |
Gene summary for ZNF267 |
| Gene information | Species | Human | Gene symbol | ZNF267 | Gene ID | 10308 |
| Gene name | zinc finger protein 267 | |
| Gene Alias | HZF2 | |
| Cytomap | 16p11.2 | |
| Gene Type | protein-coding | GO ID | GO:0006139 | UniProtAcc | Q14586 |
Top |
Malignant transformation analysis |
| Identification of the aberrant gene expression in precancerous and cancerous lesions by comparing the gene expression of stem-like cells in diseased tissues with normal stem cells |
| Entrez ID | Symbol | Replicates | Species | Organ | Tissue | Adj P-value | Log2FC | Malignancy |
| 10308 | ZNF267 | P20T-E | Human | Esophagus | ESCC | 4.17e-16 | 4.10e-01 | 0.1124 |
| 10308 | ZNF267 | P21T-E | Human | Esophagus | ESCC | 8.49e-14 | 4.28e-01 | 0.1617 |
| 10308 | ZNF267 | P22T-E | Human | Esophagus | ESCC | 1.73e-07 | 2.29e-01 | 0.1236 |
| 10308 | ZNF267 | P23T-E | Human | Esophagus | ESCC | 2.53e-13 | 5.04e-01 | 0.108 |
| 10308 | ZNF267 | P24T-E | Human | Esophagus | ESCC | 3.43e-12 | 3.95e-01 | 0.1287 |
| 10308 | ZNF267 | P26T-E | Human | Esophagus | ESCC | 2.13e-27 | 6.81e-01 | 0.1276 |
| 10308 | ZNF267 | P27T-E | Human | Esophagus | ESCC | 9.33e-07 | 3.53e-01 | 0.1055 |
| 10308 | ZNF267 | P28T-E | Human | Esophagus | ESCC | 2.53e-17 | 5.18e-01 | 0.1149 |
| 10308 | ZNF267 | P30T-E | Human | Esophagus | ESCC | 1.08e-07 | 4.10e-01 | 0.137 |
| 10308 | ZNF267 | P31T-E | Human | Esophagus | ESCC | 1.28e-18 | 5.46e-01 | 0.1251 |
| 10308 | ZNF267 | P32T-E | Human | Esophagus | ESCC | 1.78e-20 | 4.85e-01 | 0.1666 |
| 10308 | ZNF267 | P36T-E | Human | Esophagus | ESCC | 3.19e-15 | 5.45e-01 | 0.1187 |
| 10308 | ZNF267 | P37T-E | Human | Esophagus | ESCC | 1.81e-20 | 4.37e-01 | 0.1371 |
| 10308 | ZNF267 | P39T-E | Human | Esophagus | ESCC | 1.53e-07 | 2.45e-01 | 0.0894 |
| 10308 | ZNF267 | P40T-E | Human | Esophagus | ESCC | 4.53e-18 | 5.79e-01 | 0.109 |
| 10308 | ZNF267 | P42T-E | Human | Esophagus | ESCC | 1.97e-11 | 4.51e-01 | 0.1175 |
| 10308 | ZNF267 | P44T-E | Human | Esophagus | ESCC | 8.07e-13 | 2.55e-01 | 0.1096 |
| 10308 | ZNF267 | P47T-E | Human | Esophagus | ESCC | 3.26e-16 | 4.11e-01 | 0.1067 |
| 10308 | ZNF267 | P48T-E | Human | Esophagus | ESCC | 5.82e-16 | 4.91e-01 | 0.0959 |
| 10308 | ZNF267 | P49T-E | Human | Esophagus | ESCC | 3.52e-11 | 1.06e+00 | 0.1768 |
| Page: 1 2 3 4 |
| Tissue | Expression Dynamics | Abbreviation |
| Esophagus | 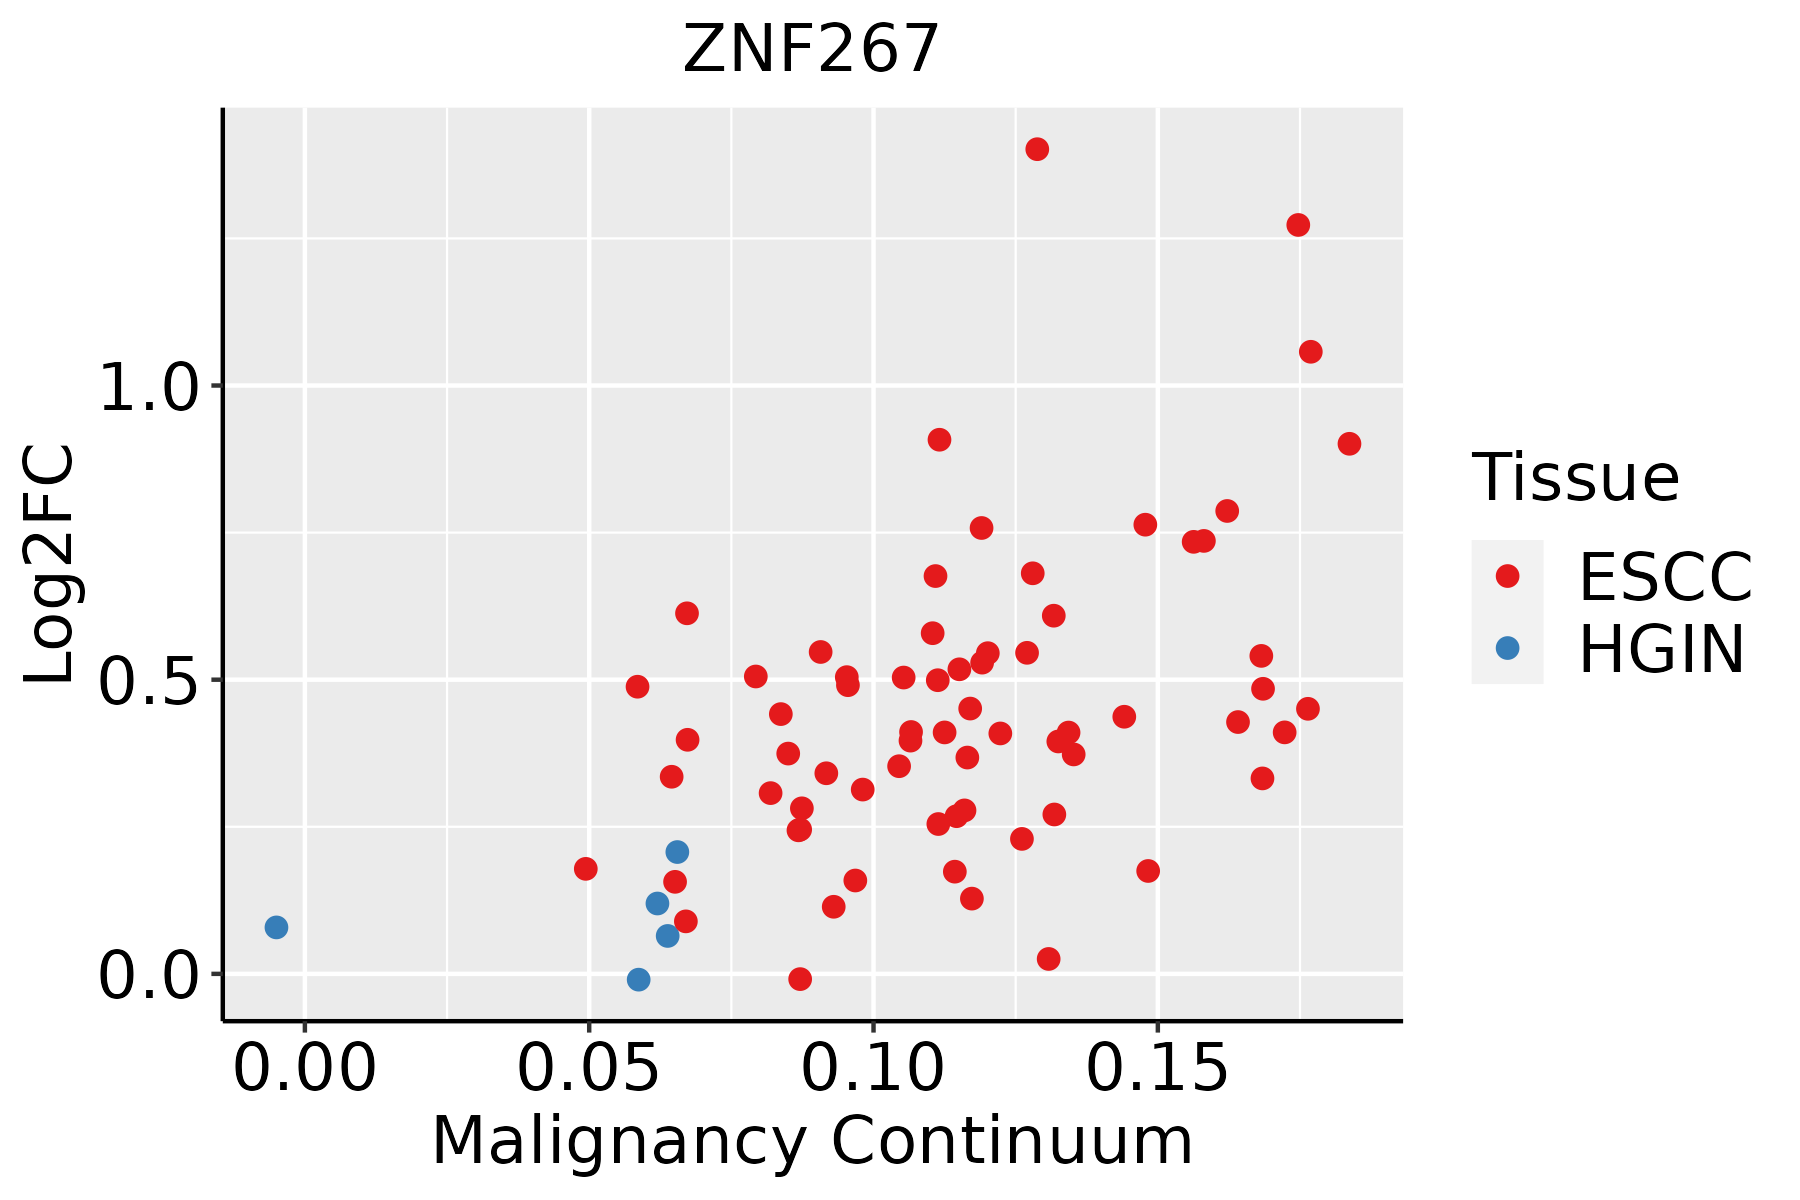 | ESCC: Esophageal squamous cell carcinoma |
| HGIN: High-grade intraepithelial neoplasias | ||
| LGIN: Low-grade intraepithelial neoplasias | ||
| Oral Cavity | 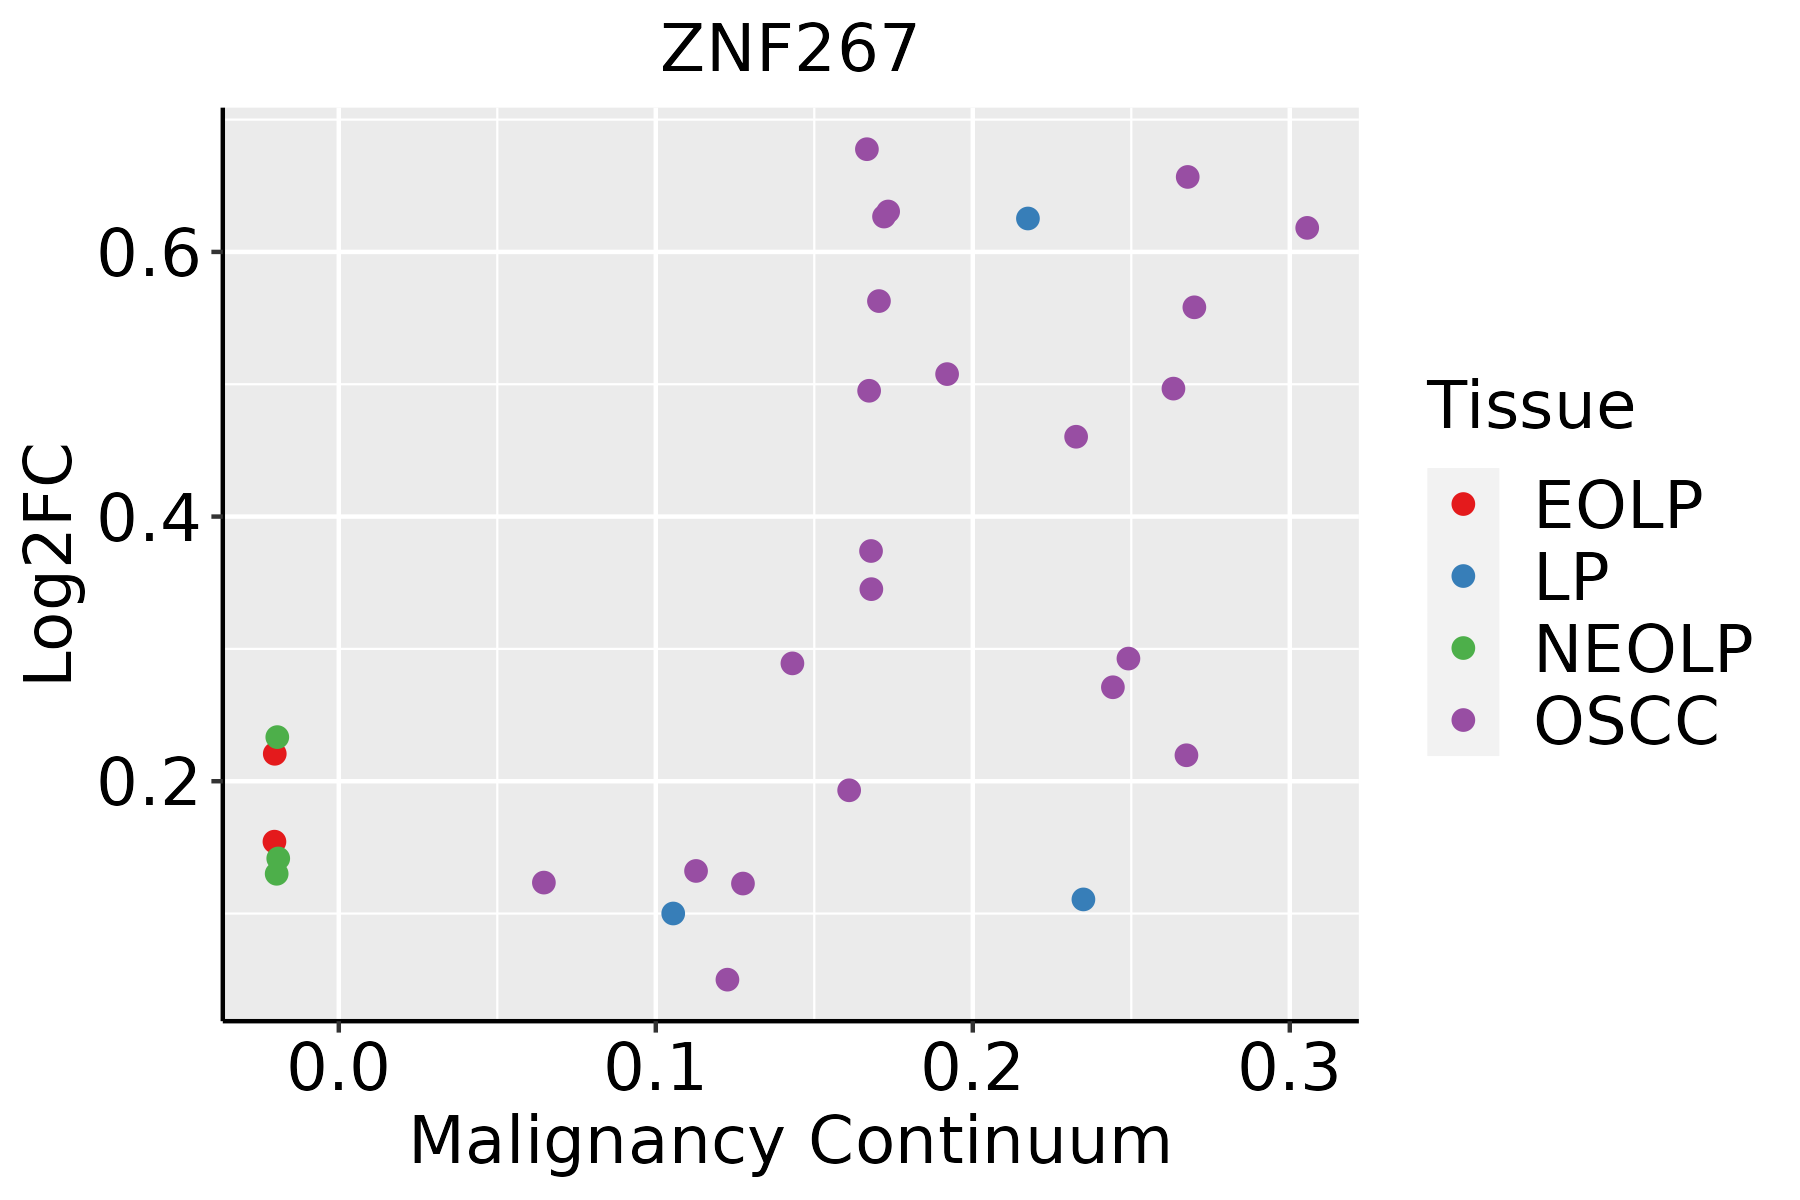 | EOLP: Erosive Oral lichen planus |
| LP: leukoplakia | ||
| NEOLP: Non-erosive oral lichen planus | ||
| OSCC: Oral squamous cell carcinoma |
| ∗log2FC in expression of this searched gene in stem-like cells from each diseased tissue sample relative to stem-like cells in normal samples in each tissue plotted against the malignancy continuum. Samples are colored based on if they are from different disease stage. |
Top |
Malignant transformation related pathway analysis |
| Find out the enriched GO biological processes and KEGG pathways involved in transition from healthy to precancer to cancer |
| Tissue | Disease Stage | Enriched GO biological Processes |
| Colorectum | AD |  |
| Colorectum | SER |  |
| Colorectum | MSS |  |
| Colorectum | MSI-H |  |
| Colorectum | FAP |  |
| ∗Top 15 enriched GO BP terms are showed in the bar plot of each disease state in each tissue. Each row represents a significant GO biological process which is colored according to the -log10(p.adjust). |
| Page: 1 2 3 4 5 6 7 8 9 |
| GO ID | Tissue | Disease Stage | Description | Gene Ratio | Bg Ratio | pvalue | p.adjust | Count |
| Page: 1 |
| Pathway ID | Tissue | Disease Stage | Description | Gene Ratio | Bg Ratio | pvalue | p.adjust | qvalue | Count |
| Page: 1 |
Top |
Cell-cell communication analysis |
| Identification of potential cell-cell interactions between two cell types and their ligand-receptor pairs for different disease states |
| Ligand | Receptor | LRpair | Pathway | Tissue | Disease Stage |
| Page: 1 |
Top |
Single-cell gene regulatory network inference analysis |
| Find out the significant the regulons (TFs) and the target genes of each regulon across cell types for different disease states |
| TF | Cell Type | Tissue | Disease Stage | Target Gene | RSS | Regulon Activity |
| ZNF267 | cDC | Lung | Healthy | GPR183,TIMP1,SOD2, etc. | 2.94e-03 |  |
| ZNF267 | NK | Stomach | ADJ | CXCL3,SPP1,IL8, etc. | 3.15e-02 |  |
| ZNF267 | M2MAC | Stomach | ADJ | CXCL3,SPP1,IL8, etc. | 1.59e-01 | |
| ZNF267 | CD8TEXP | Stomach | ADJ | CXCL3,SPP1,IL8, etc. | 1.42e-02 | |
| ZNF267 | TFH | Stomach | ADJ | CXCL3,SPP1,IL8, etc. | 3.23e-03 | |
| ZNF267 | MON | Stomach | ADJ | CXCL3,SPP1,IL8, etc. | 1.22e-05 | |
| ZNF267 | M2MAC | Stomach | CAG | CXCL3,SPP1,IL8, etc. | 1.22e-01 |  |
| ZNF267 | DC | Stomach | CAG with IM | CXCL3,SPP1,IL8, etc. | -2.22e-16 |  |
| ZNF267 | MAIT | Stomach | CAG with IM | CXCL3,SPP1,IL8, etc. | 4.74e-02 | |
| ZNF267 | M2MAC | Stomach | CAG with IM | CXCL3,SPP1,IL8, etc. | 0.00e+00 | |
| ∗The dot plots of a searched regulon are shown for all cell subpopulations in each disease state of each tissue based on the regulon specific score inferred using pySCENIC and by calculating the average expression. |
| Page: 1 2 3 |
Top |
Somatic mutation of malignant transformation related genes |
| Annotation of somatic variants for genes involved in malignant transformation |
| Hugo Symbol | Variant Class | Variant Classification | dbSNP RS | HGVSc | HGVSp | HGVSp Short | SWISSPROT | BIOTYPE | SIFT | PolyPhen | Tumor Sample Barcode | Tissue | Histology | Sex | Age | Stage | Therapy Types | Drugs | Outcome |
| ZNF267 | SNV | Missense_Mutation | rs754297644 | c.1283G>A | p.Arg428Gln | p.R428Q | Q14586 | protein_coding | tolerated(0.17) | benign(0.089) | TCGA-AN-A046-01 | Breast | breast invasive carcinoma | Female | >=65 | I/II | Unknown | Unknown | SD |
| ZNF267 | SNV | Missense_Mutation | c.1975N>A | p.Pro659Thr | p.P659T | Q14586 | protein_coding | deleterious(0.01) | probably_damaging(0.998) | TCGA-C8-A12W-01 | Breast | breast invasive carcinoma | Female | <65 | III/IV | Unknown | Unknown | SD | |
| ZNF267 | SNV | Missense_Mutation | novel | c.907N>A | p.Asp303Asn | p.D303N | Q14586 | protein_coding | deleterious(0.02) | benign(0.019) | TCGA-D8-A73U-01 | Breast | breast invasive carcinoma | Female | >=65 | I/II | Hormone Therapy | tamoxiphen | SD |
| ZNF267 | SNV | Missense_Mutation | c.1215G>C | p.Glu405Asp | p.E405D | Q14586 | protein_coding | deleterious(0) | benign(0.159) | TCGA-E2-A10C-01 | Breast | breast invasive carcinoma | Female | <65 | I/II | Chemotherapy | cytoxan | SD | |
| ZNF267 | SNV | Missense_Mutation | c.1409G>A | p.Ser470Asn | p.S470N | Q14586 | protein_coding | deleterious(0.02) | benign(0.001) | TCGA-E2-A10C-01 | Breast | breast invasive carcinoma | Female | <65 | I/II | Chemotherapy | cytoxan | SD | |
| ZNF267 | SNV | Missense_Mutation | c.1045N>G | p.Pro349Ala | p.P349A | Q14586 | protein_coding | deleterious(0.03) | benign(0) | TCGA-E9-A295-01 | Breast | breast invasive carcinoma | Female | >=65 | I/II | Hormone Therapy | tamoxiphen | SD | |
| ZNF267 | SNV | Missense_Mutation | novel | c.1309A>C | p.Lys437Gln | p.K437Q | Q14586 | protein_coding | deleterious(0.04) | benign(0.024) | TCGA-2W-A8YY-01 | Cervix | cervical & endocervical cancer | Female | <65 | I/II | Chemotherapy | cisplatin | CR |
| ZNF267 | SNV | Missense_Mutation | c.511C>T | p.His171Tyr | p.H171Y | Q14586 | protein_coding | tolerated(1) | benign(0.027) | TCGA-EK-A3GK-01 | Cervix | cervical & endocervical cancer | Female | <65 | I/II | Unknown | Unknown | SD | |
| ZNF267 | SNV | Missense_Mutation | novel | c.2123N>A | p.Arg708Lys | p.R708K | Q14586 | protein_coding | tolerated(0.47) | benign(0.089) | TCGA-HM-A4S6-01 | Cervix | cervical & endocervical cancer | Female | <65 | III/IV | Chemotherapy | cisplatin | CR |
| ZNF267 | SNV | Missense_Mutation | c.2180C>G | p.Ser727Cys | p.S727C | Q14586 | protein_coding | tolerated(0.23) | benign(0.001) | TCGA-Q1-A73O-01 | Cervix | cervical & endocervical cancer | Female | <65 | I/II | Chemotherapy | cisplatin | CR |
| Page: 1 2 3 4 5 6 7 8 9 10 11 12 |
Top |
Related drugs of malignant transformation related genes |
| Identification of chemicals and drugs interact with genes involved in malignant transfromation |
| (DGIdb 4.0) |
| Entrez ID | Symbol | Category | Interaction Types | Drug Claim Name | Drug Name | PMIDs |
| Page: 1 |

Copyright 2023-Present -The University of Texas Health Science Center at Houston |