
|
|||||
|
 | |
| |
| |
| |
| |
| |
|
Gene: ZNF146 |
Gene summary for ZNF146 |
| Gene information | Species | Human | Gene symbol | ZNF146 | Gene ID | 7705 |
| Gene name | zinc finger protein 146 | |
| Gene Alias | OZF | |
| Cytomap | 19q13.12 | |
| Gene Type | protein-coding | GO ID | GO:0006139 | UniProtAcc | Q15072 |
Top |
Malignant transformation analysis |
| Identification of the aberrant gene expression in precancerous and cancerous lesions by comparing the gene expression of stem-like cells in diseased tissues with normal stem cells |
| Entrez ID | Symbol | Replicates | Species | Organ | Tissue | Adj P-value | Log2FC | Malignancy |
| 7705 | ZNF146 | P19T-E | Human | Esophagus | ESCC | 4.50e-02 | 7.45e-01 | 0.1662 |
| 7705 | ZNF146 | P20T-E | Human | Esophagus | ESCC | 1.19e-18 | 3.48e-01 | 0.1124 |
| 7705 | ZNF146 | P21T-E | Human | Esophagus | ESCC | 1.66e-13 | 6.29e-02 | 0.1617 |
| 7705 | ZNF146 | P22T-E | Human | Esophagus | ESCC | 1.82e-27 | 4.48e-01 | 0.1236 |
| 7705 | ZNF146 | P23T-E | Human | Esophagus | ESCC | 2.04e-25 | 7.36e-01 | 0.108 |
| 7705 | ZNF146 | P24T-E | Human | Esophagus | ESCC | 4.86e-09 | 2.17e-01 | 0.1287 |
| 7705 | ZNF146 | P26T-E | Human | Esophagus | ESCC | 2.18e-26 | 4.63e-01 | 0.1276 |
| 7705 | ZNF146 | P27T-E | Human | Esophagus | ESCC | 2.79e-19 | 4.25e-01 | 0.1055 |
| 7705 | ZNF146 | P28T-E | Human | Esophagus | ESCC | 3.62e-19 | 3.78e-01 | 0.1149 |
| 7705 | ZNF146 | P30T-E | Human | Esophagus | ESCC | 3.07e-18 | 6.78e-01 | 0.137 |
| 7705 | ZNF146 | P31T-E | Human | Esophagus | ESCC | 7.93e-18 | 2.90e-01 | 0.1251 |
| 7705 | ZNF146 | P32T-E | Human | Esophagus | ESCC | 7.30e-24 | 3.95e-01 | 0.1666 |
| 7705 | ZNF146 | P36T-E | Human | Esophagus | ESCC | 9.68e-13 | 3.61e-01 | 0.1187 |
| 7705 | ZNF146 | P37T-E | Human | Esophagus | ESCC | 5.99e-20 | 3.31e-01 | 0.1371 |
| 7705 | ZNF146 | P38T-E | Human | Esophagus | ESCC | 2.81e-04 | 4.16e-01 | 0.127 |
| 7705 | ZNF146 | P39T-E | Human | Esophagus | ESCC | 5.77e-08 | 5.28e-02 | 0.0894 |
| 7705 | ZNF146 | P40T-E | Human | Esophagus | ESCC | 1.01e-05 | 9.60e-02 | 0.109 |
| 7705 | ZNF146 | P42T-E | Human | Esophagus | ESCC | 1.31e-13 | 3.23e-01 | 0.1175 |
| 7705 | ZNF146 | P44T-E | Human | Esophagus | ESCC | 8.15e-09 | 3.74e-01 | 0.1096 |
| 7705 | ZNF146 | P47T-E | Human | Esophagus | ESCC | 5.25e-16 | 1.83e-01 | 0.1067 |
| Page: 1 2 3 4 5 6 |
| Tissue | Expression Dynamics | Abbreviation |
| Esophagus | 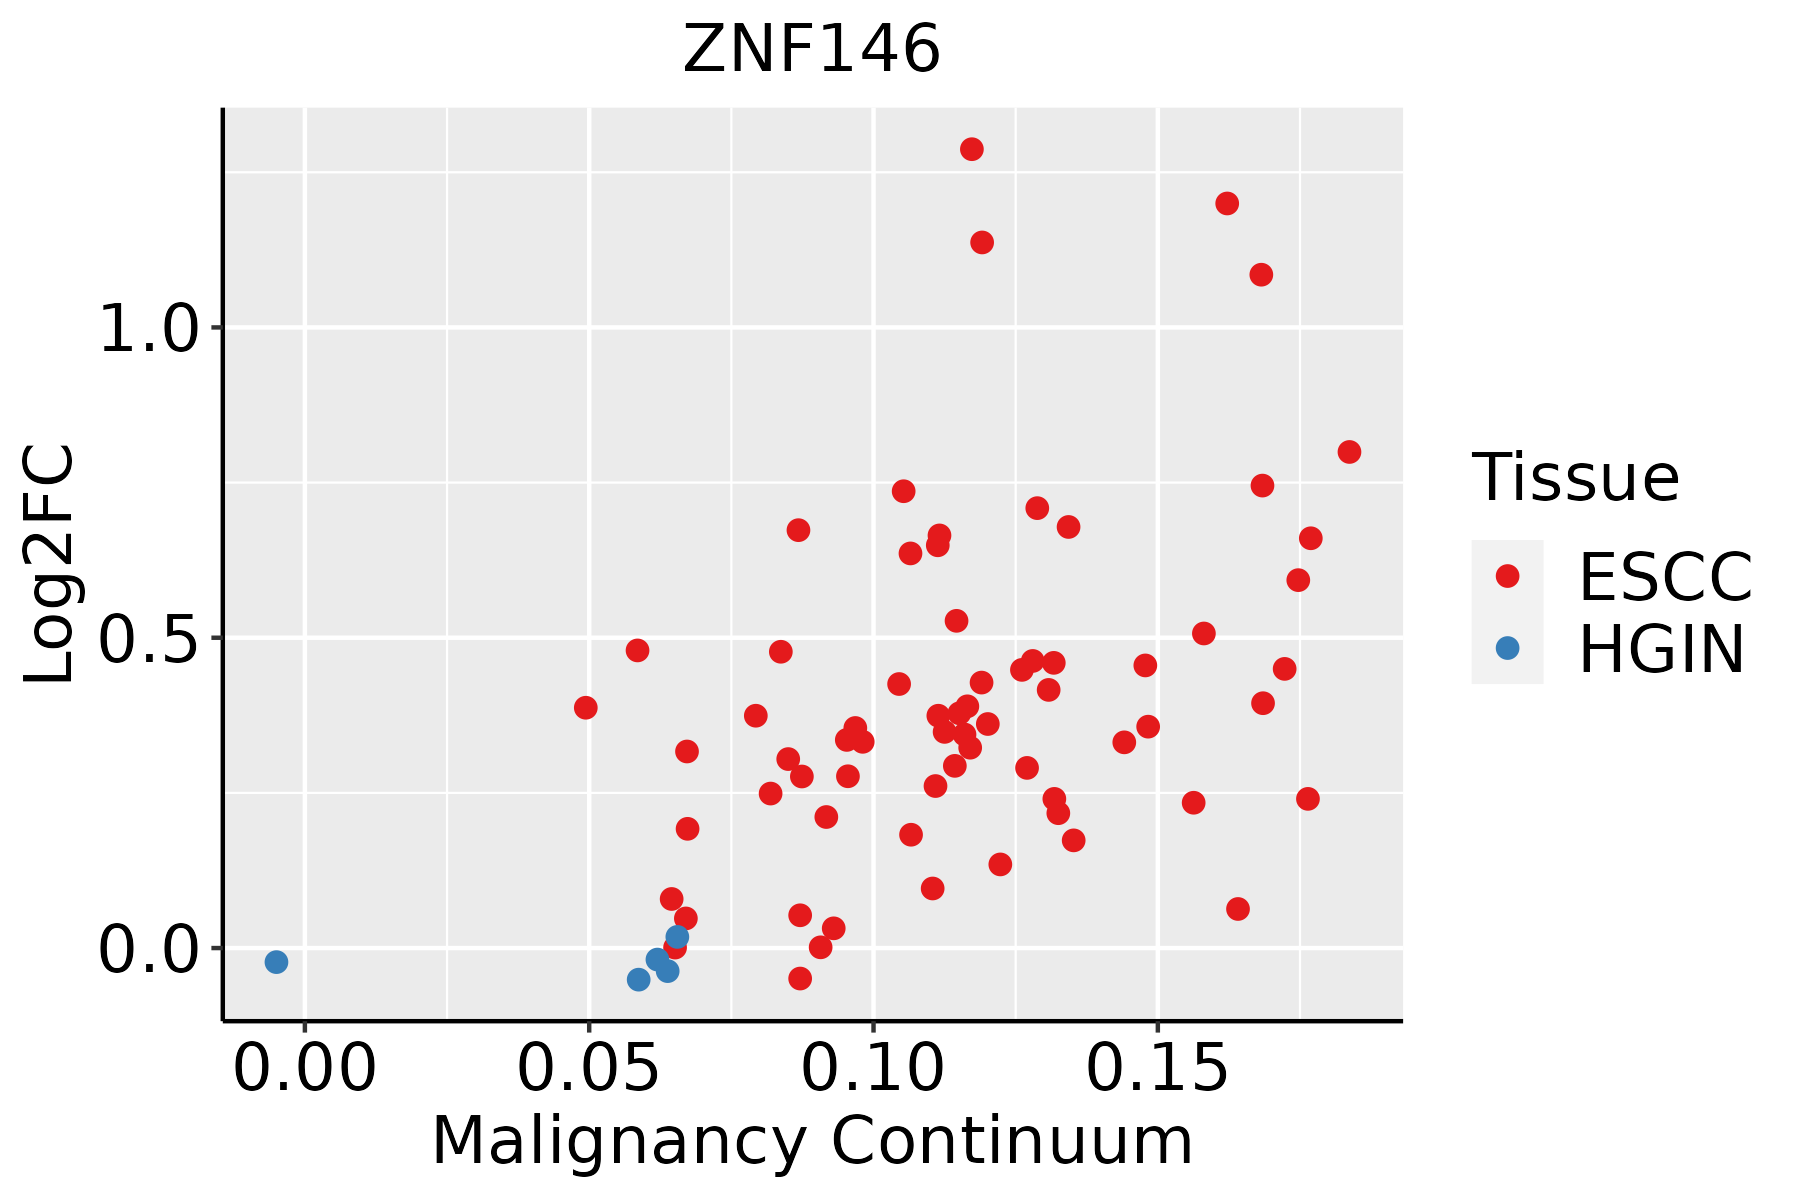 | ESCC: Esophageal squamous cell carcinoma |
| HGIN: High-grade intraepithelial neoplasias | ||
| LGIN: Low-grade intraepithelial neoplasias | ||
| Liver |  | HCC: Hepatocellular carcinoma |
| NAFLD: Non-alcoholic fatty liver disease | ||
| Oral Cavity |  | EOLP: Erosive Oral lichen planus |
| LP: leukoplakia | ||
| NEOLP: Non-erosive oral lichen planus | ||
| OSCC: Oral squamous cell carcinoma | ||
| Skin | 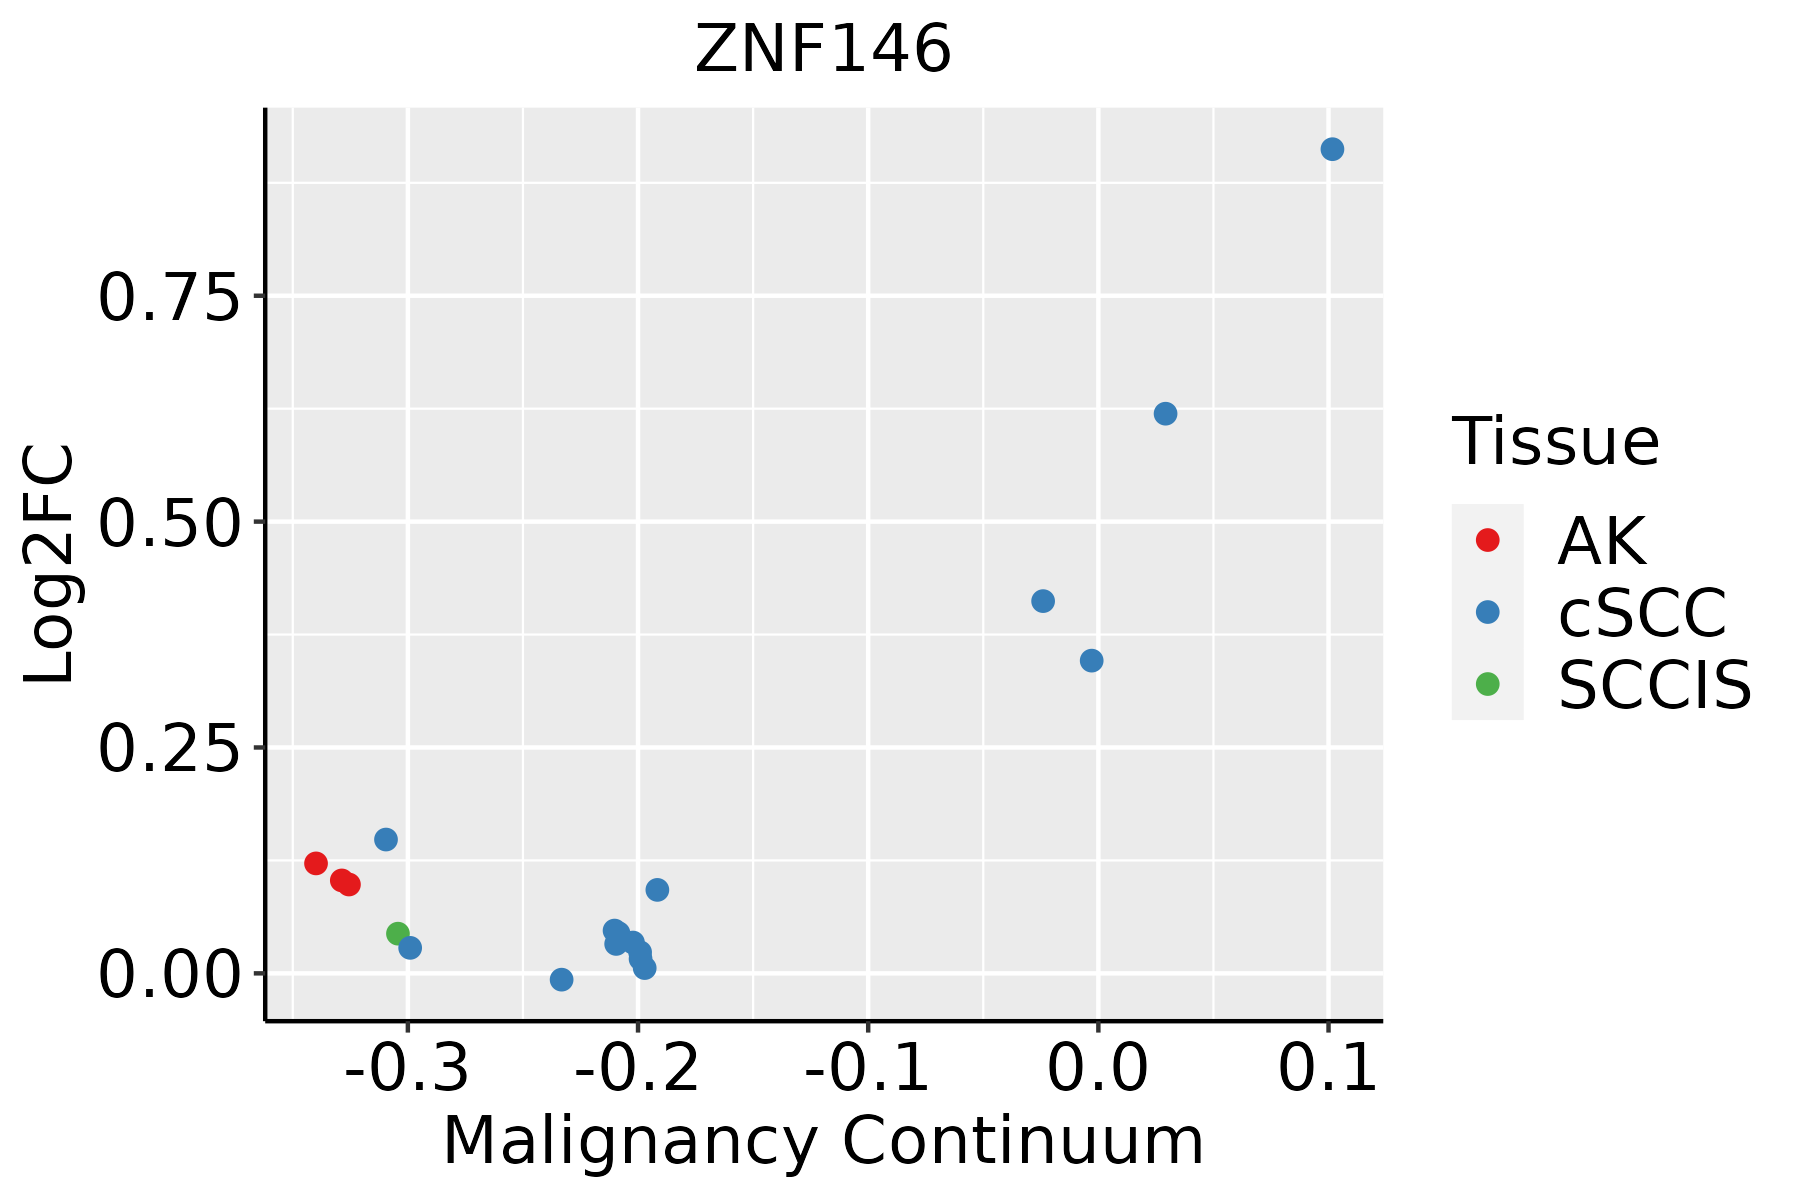 | AK: Actinic keratosis |
| cSCC: Cutaneous squamous cell carcinoma | ||
| SCCIS:squamous cell carcinoma in situ | ||
| Thyroid | 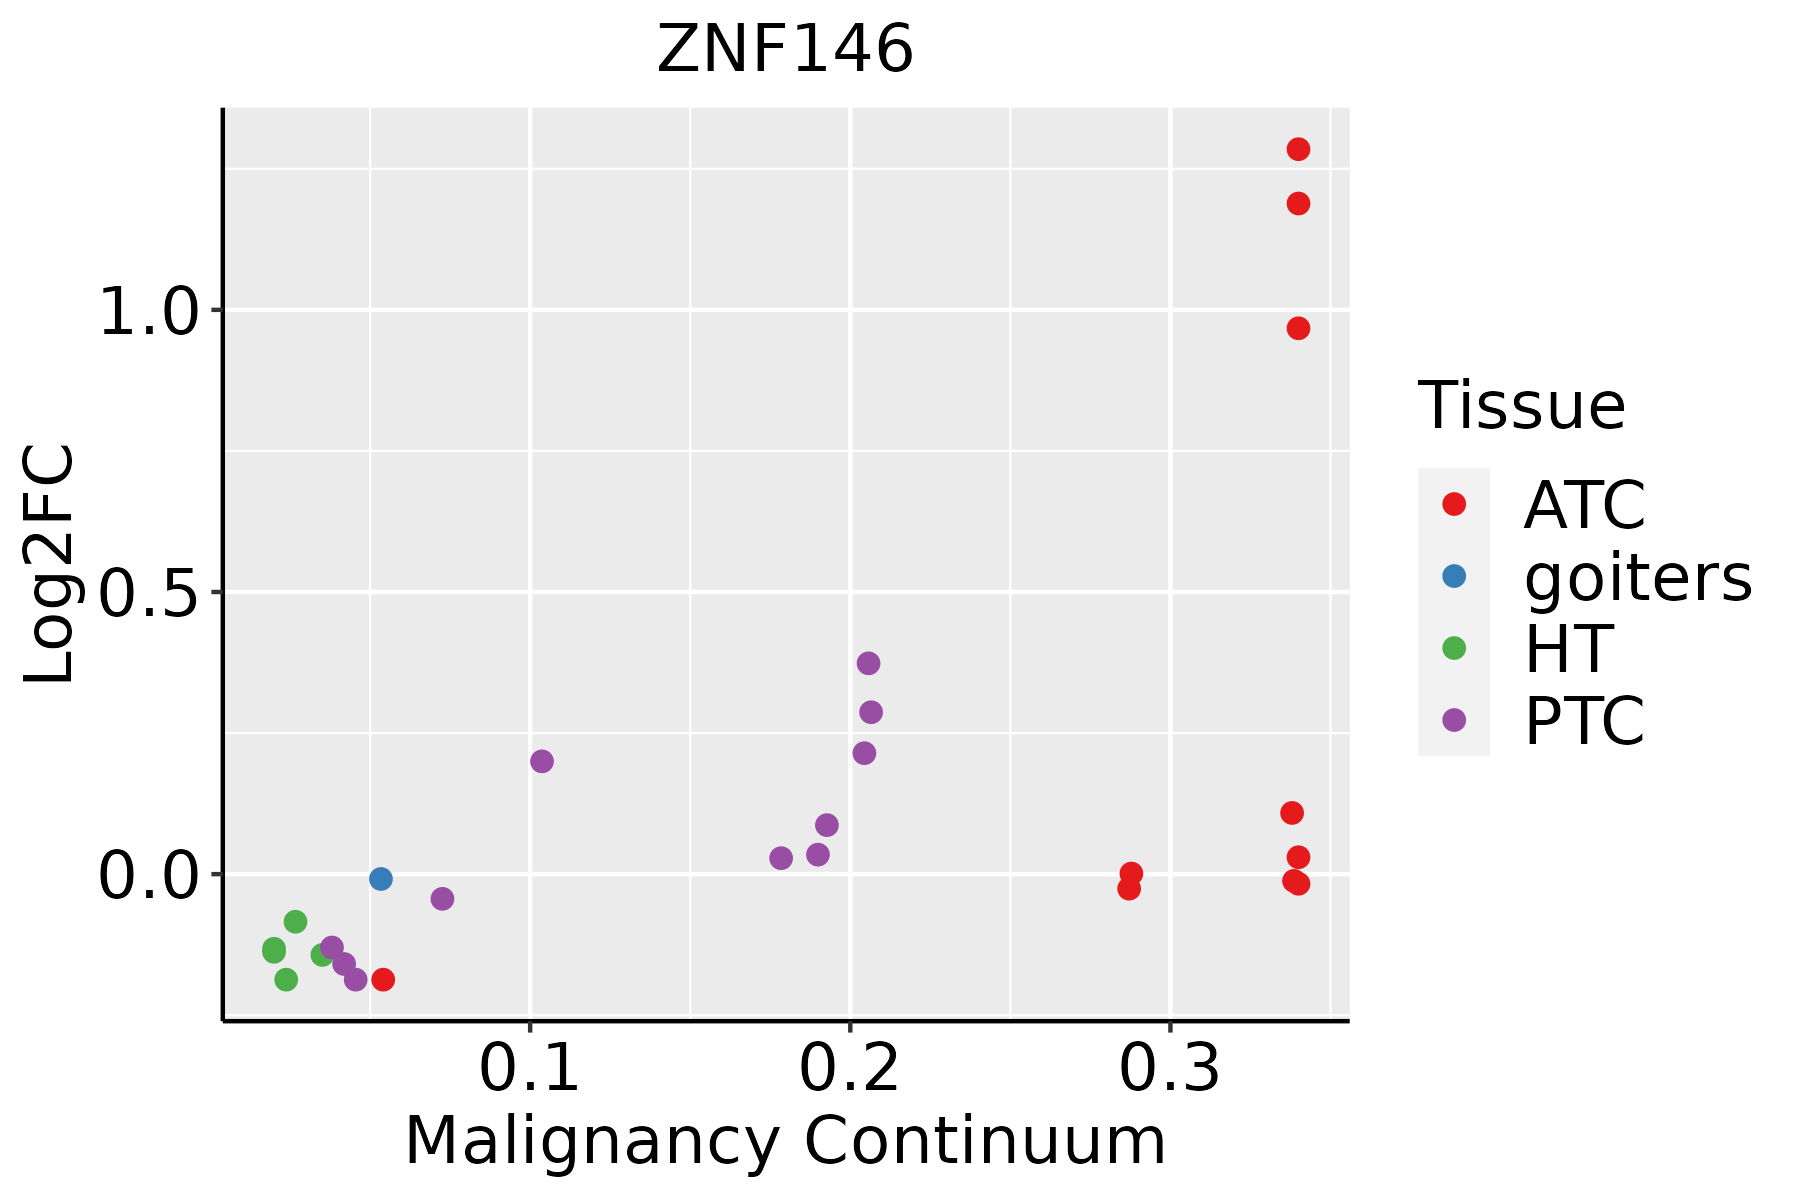 | ATC: Anaplastic thyroid cancer |
| HT: Hashimoto's thyroiditis | ||
| PTC: Papillary thyroid cancer |
| ∗log2FC in expression of this searched gene in stem-like cells from each diseased tissue sample relative to stem-like cells in normal samples in each tissue plotted against the malignancy continuum. Samples are colored based on if they are from different disease stage. |
Top |
Malignant transformation related pathway analysis |
| Find out the enriched GO biological processes and KEGG pathways involved in transition from healthy to precancer to cancer |
| Tissue | Disease Stage | Enriched GO biological Processes |
| Colorectum | AD |  |
| Colorectum | SER |  |
| Colorectum | MSS |  |
| Colorectum | MSI-H |  |
| Colorectum | FAP |  |
| ∗Top 15 enriched GO BP terms are showed in the bar plot of each disease state in each tissue. Each row represents a significant GO biological process which is colored according to the -log10(p.adjust). |
| Page: 1 2 3 4 5 6 7 8 9 |
| GO ID | Tissue | Disease Stage | Description | Gene Ratio | Bg Ratio | pvalue | p.adjust | Count |
| Page: 1 |
| Pathway ID | Tissue | Disease Stage | Description | Gene Ratio | Bg Ratio | pvalue | p.adjust | qvalue | Count |
| Page: 1 |
Top |
Cell-cell communication analysis |
| Identification of potential cell-cell interactions between two cell types and their ligand-receptor pairs for different disease states |
| Ligand | Receptor | LRpair | Pathway | Tissue | Disease Stage |
| Page: 1 |
Top |
Single-cell gene regulatory network inference analysis |
| Find out the significant the regulons (TFs) and the target genes of each regulon across cell types for different disease states |
| TF | Cell Type | Tissue | Disease Stage | Target Gene | RSS | Regulon Activity |
| ZNF146 | DIFF | Esophagus | ESCC | LINC00665,LSM14A,ZNF302, etc. | -4.44e-16 |  |
| ZNF146 | GOB | Esophagus | ESCC | LINC00665,LSM14A,ZNF302, etc. | 6.38e-03 | |
| ZNF146 | PERI | Esophagus | ADJ | FADS1,ZNF717,ZNF274, etc. | 9.49e-02 |  |
| ZNF146 | PERI | Esophagus | Healthy | FADS1,ZNF717,ZNF274, etc. | 6.88e-02 |  |
| ZNF146 | PLA | Thyroid | ADJ | PASK,NCALD,PAICS, etc. | 1.96e-02 |  |
| ZNF146 | TH1 | Thyroid | ADJ | PASK,NCALD,PAICS, etc. | 2.33e-02 | |
| ZNF146 | pDC | Thyroid | ADJ | PASK,NCALD,PAICS, etc. | 5.56e-03 | |
| ZNF146 | GC | Thyroid | ADJ | PASK,NCALD,PAICS, etc. | 0.00e+00 | |
| ZNF146 | pDC | Thyroid | ATC | PASK,NCALD,PAICS, etc. | 1.42e-02 |  |
| ZNF146 | BN | Thyroid | ATC | PASK,NCALD,PAICS, etc. | 1.12e-01 | |
| ∗The dot plots of a searched regulon are shown for all cell subpopulations in each disease state of each tissue based on the regulon specific score inferred using pySCENIC and by calculating the average expression. |
| Page: 1 2 |
Top |
Somatic mutation of malignant transformation related genes |
| Annotation of somatic variants for genes involved in malignant transformation |
| Hugo Symbol | Variant Class | Variant Classification | dbSNP RS | HGVSc | HGVSp | HGVSp Short | SWISSPROT | BIOTYPE | SIFT | PolyPhen | Tumor Sample Barcode | Tissue | Histology | Sex | Age | Stage | Therapy Types | Drugs | Outcome |
| ZNF146 | SNV | Missense_Mutation | c.769N>G | p.Leu257Val | p.L257V | Q15072 | protein_coding | tolerated(0.52) | possibly_damaging(0.469) | TCGA-AC-A23H-01 | Breast | breast invasive carcinoma | Female | >=65 | I/II | Unknown | Unknown | PD | |
| ZNF146 | SNV | Missense_Mutation | c.323N>T | p.Ala108Val | p.A108V | Q15072 | protein_coding | deleterious(0.02) | probably_damaging(0.989) | TCGA-BH-A0HF-01 | Breast | breast invasive carcinoma | Female | >=65 | I/II | Hormone Therapy | arimidex | SD | |
| ZNF146 | SNV | Missense_Mutation | c.266N>T | p.Thr89Met | p.T89M | Q15072 | protein_coding | tolerated(0.13) | benign(0.007) | TCGA-A6-2686-01 | Colorectum | colon adenocarcinoma | Female | >=65 | I/II | Unknown | Unknown | SD | |
| ZNF146 | SNV | Missense_Mutation | c.737G>A | p.Gly246Glu | p.G246E | Q15072 | protein_coding | deleterious(0.02) | probably_damaging(1) | TCGA-D5-6931-01 | Colorectum | colon adenocarcinoma | Male | >=65 | III/IV | Unknown | Unknown | SD | |
| ZNF146 | SNV | Missense_Mutation | c.217G>A | p.Glu73Lys | p.E73K | Q15072 | protein_coding | tolerated(0.53) | benign(0) | TCGA-F5-6814-01 | Colorectum | rectum adenocarcinoma | Male | <65 | I/II | Unknown | Unknown | SD | |
| ZNF146 | SNV | Missense_Mutation | c.386T>C | p.Val129Ala | p.V129A | Q15072 | protein_coding | tolerated(0.16) | benign(0.254) | TCGA-A5-A0G2-01 | Endometrium | uterine corpus endometrioid carcinoma | Female | <65 | III/IV | Unknown | Unknown | SD | |
| ZNF146 | SNV | Missense_Mutation | novel | c.542A>G | p.Glu181Gly | p.E181G | Q15072 | protein_coding | deleterious(0) | probably_damaging(0.993) | TCGA-A5-A0G2-01 | Endometrium | uterine corpus endometrioid carcinoma | Female | <65 | III/IV | Unknown | Unknown | SD |
| ZNF146 | SNV | Missense_Mutation | novel | c.716C>A | p.Pro239His | p.P239H | Q15072 | protein_coding | deleterious(0) | probably_damaging(0.999) | TCGA-A5-A0G2-01 | Endometrium | uterine corpus endometrioid carcinoma | Female | <65 | III/IV | Unknown | Unknown | SD |
| ZNF146 | SNV | Missense_Mutation | novel | c.677C>T | p.Ser226Phe | p.S226F | Q15072 | protein_coding | tolerated(0.17) | probably_damaging(0.997) | TCGA-A5-A2K5-01 | Endometrium | uterine corpus endometrioid carcinoma | Female | >=65 | I/II | Unknown | Unknown | SD |
| ZNF146 | SNV | Missense_Mutation | novel | c.352C>T | p.His118Tyr | p.H118Y | Q15072 | protein_coding | deleterious(0) | possibly_damaging(0.649) | TCGA-AJ-A3EK-01 | Endometrium | uterine corpus endometrioid carcinoma | Female | <65 | I/II | Chemotherapy | carboplatin | CR |
| Page: 1 2 3 4 5 |
Top |
Related drugs of malignant transformation related genes |
| Identification of chemicals and drugs interact with genes involved in malignant transfromation |
| (DGIdb 4.0) |
| Entrez ID | Symbol | Category | Interaction Types | Drug Claim Name | Drug Name | PMIDs |
| Page: 1 |

Copyright 2023-Present -The University of Texas Health Science Center at Houston |