| Tissue | Expression Dynamics | Abbreviation |
| Colorectum (GSE201348) |  | FAP: Familial adenomatous polyposis |
| CRC: Colorectal cancer |
| Colorectum (HTA11) | 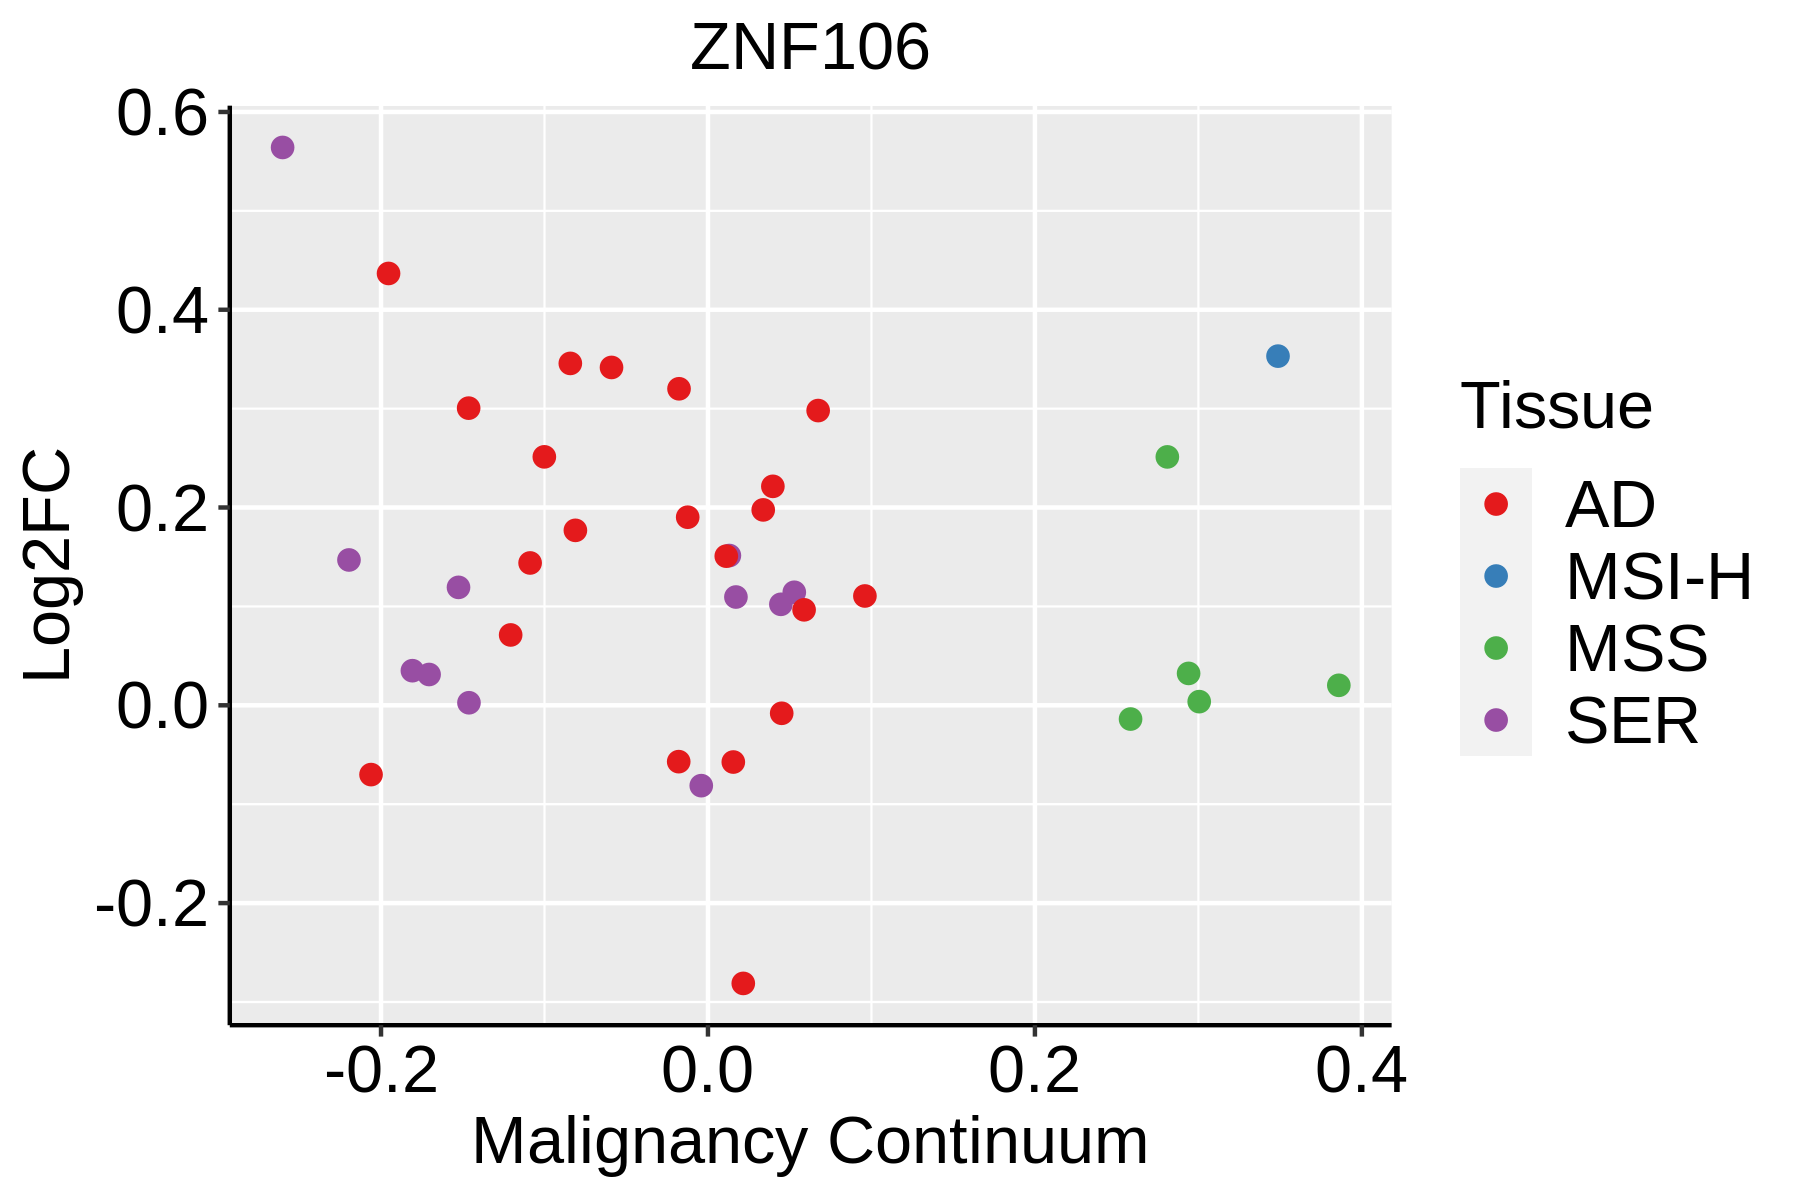 | AD: Adenomas |
| SER: Sessile serrated lesions |
| MSI-H: Microsatellite-high colorectal cancer |
| MSS: Microsatellite stable colorectal cancer |
| Esophagus | 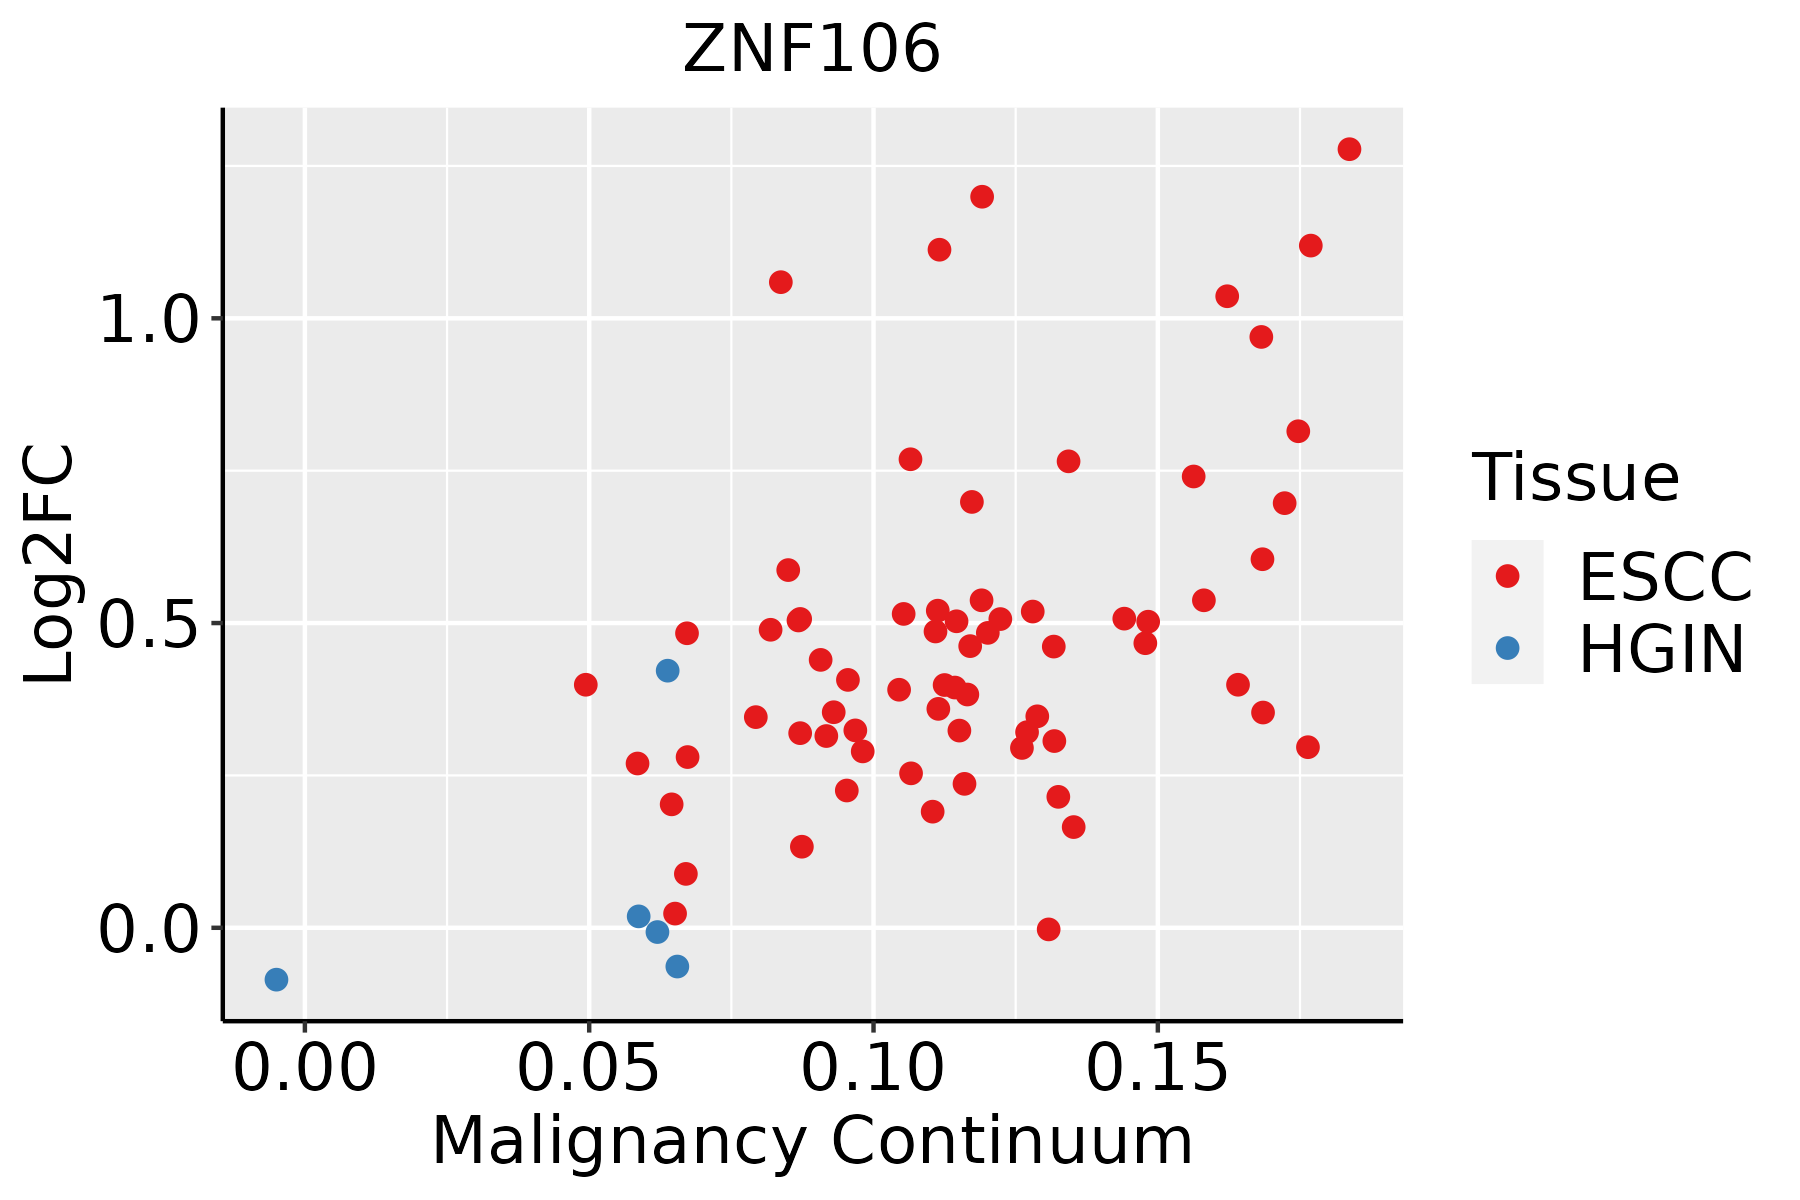 | ESCC: Esophageal squamous cell carcinoma |
| HGIN: High-grade intraepithelial neoplasias |
| LGIN: Low-grade intraepithelial neoplasias |
| Liver |  | HCC: Hepatocellular carcinoma |
| NAFLD: Non-alcoholic fatty liver disease |
| Oral Cavity |  | EOLP: Erosive Oral lichen planus |
| LP: leukoplakia |
| NEOLP: Non-erosive oral lichen planus |
| OSCC: Oral squamous cell carcinoma |
| Prostate |  | BPH: Benign Prostatic Hyperplasia |
| Skin | 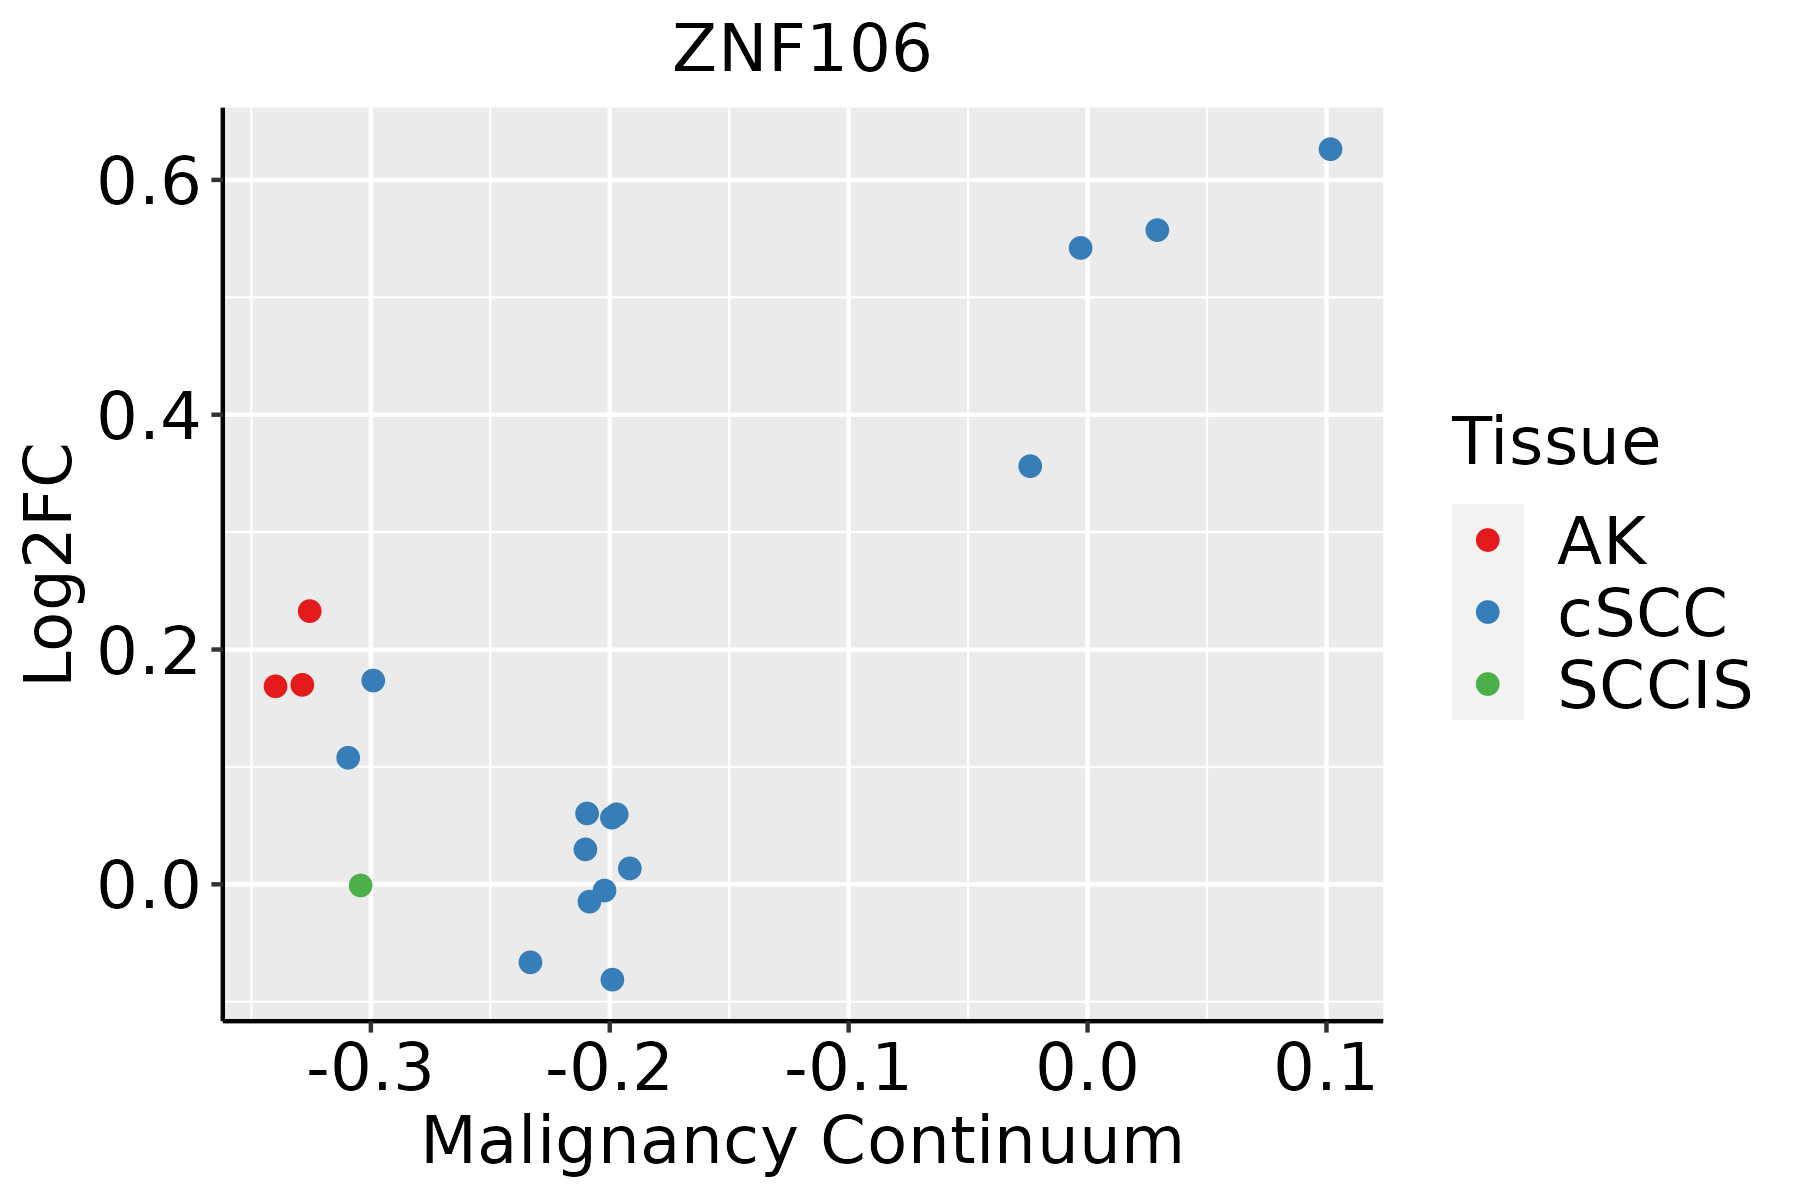 | AK: Actinic keratosis |
| cSCC: Cutaneous squamous cell carcinoma |
| SCCIS:squamous cell carcinoma in situ |
| Thyroid | 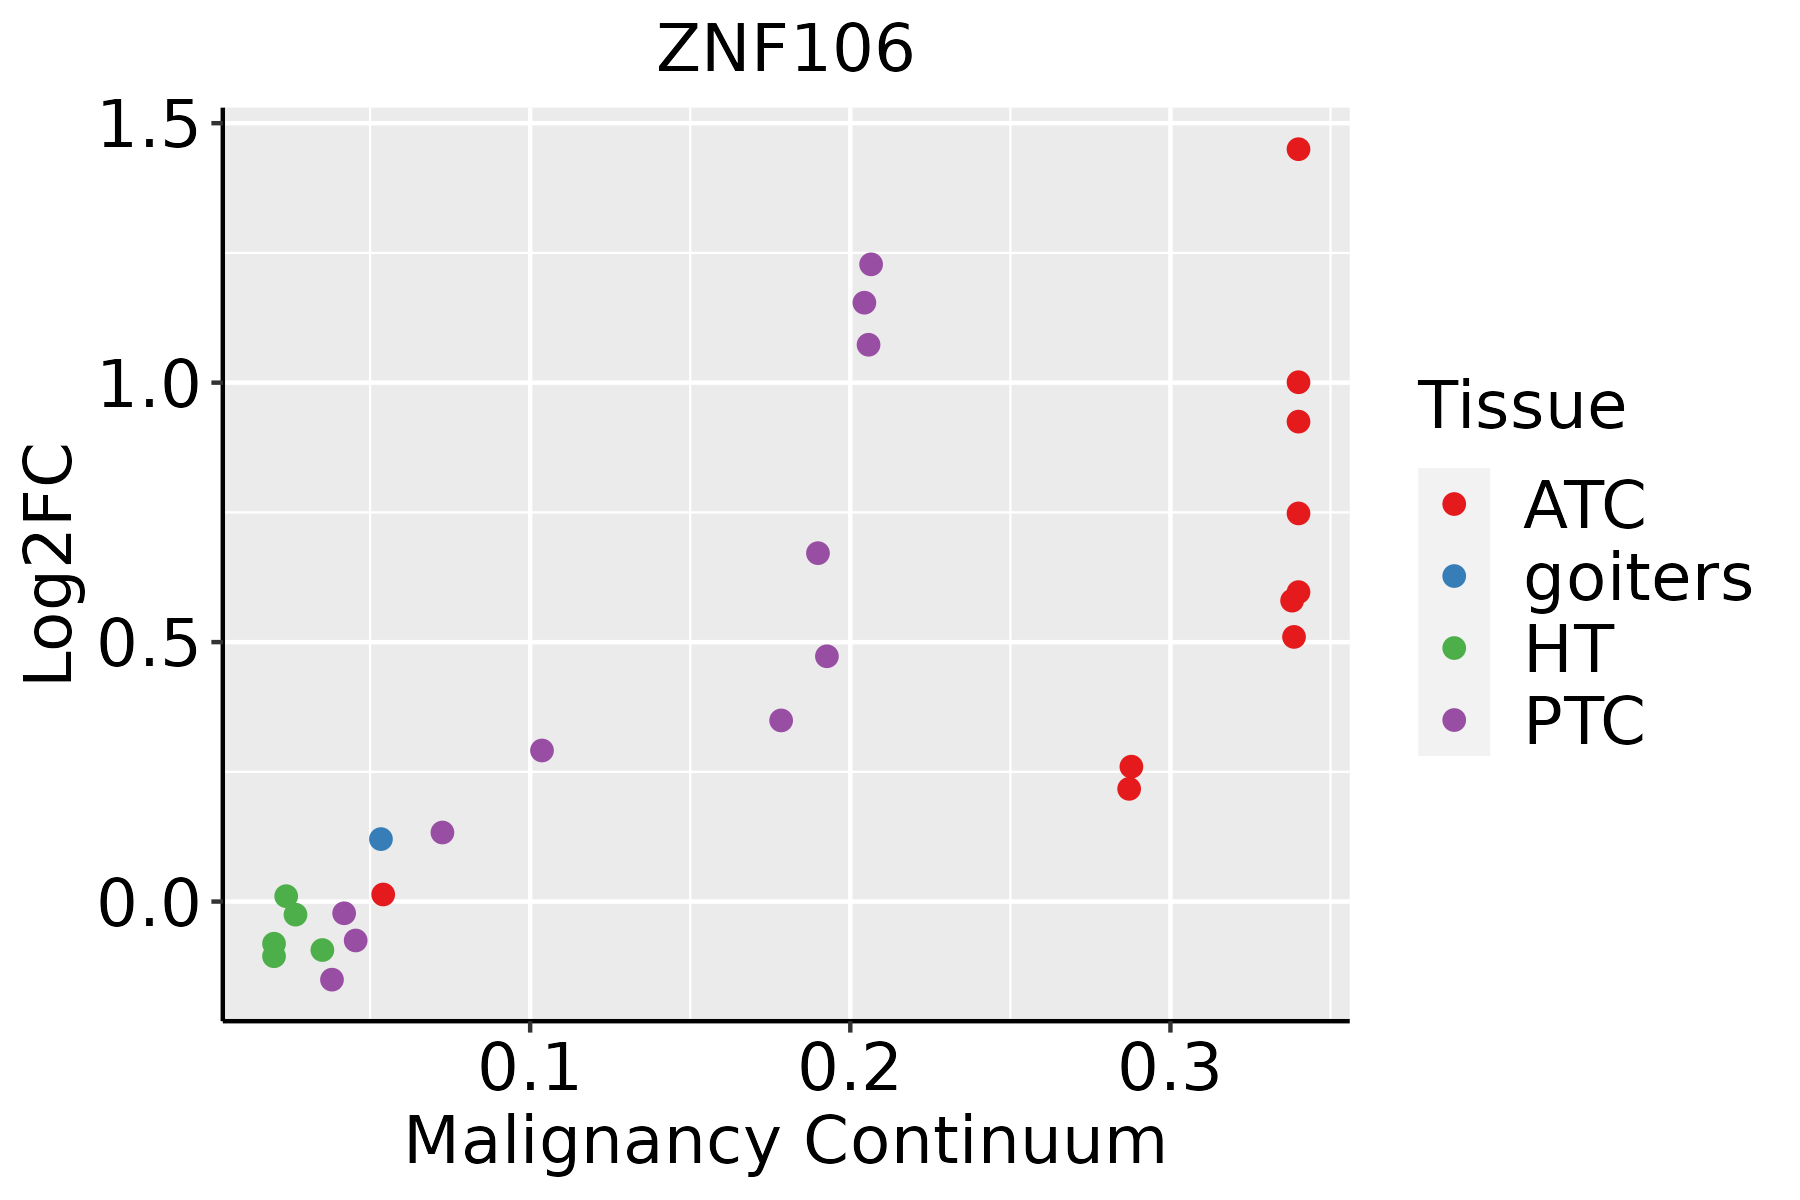 | ATC: Anaplastic thyroid cancer |
| HT: Hashimoto's thyroiditis |
| PTC: Papillary thyroid cancer |
| GO ID | Tissue | Disease Stage | Description | Gene Ratio | Bg Ratio | pvalue | p.adjust | Count |
| GO:0032868 | Colorectum | AD | response to insulin | 91/3918 | 264/18723 | 2.02e-07 | 8.48e-06 | 91 |
| GO:1901653 | Colorectum | AD | cellular response to peptide | 114/3918 | 359/18723 | 8.32e-07 | 2.88e-05 | 114 |
| GO:0032869 | Colorectum | AD | cellular response to insulin stimulus | 72/3918 | 203/18723 | 1.10e-06 | 3.68e-05 | 72 |
| GO:0071375 | Colorectum | AD | cellular response to peptide hormone stimulus | 95/3918 | 290/18723 | 1.50e-06 | 4.66e-05 | 95 |
| GO:0043434 | Colorectum | AD | response to peptide hormone | 126/3918 | 414/18723 | 2.70e-06 | 7.86e-05 | 126 |
| GO:00434343 | Colorectum | FAP | response to peptide hormone | 100/2622 | 414/18723 | 1.74e-08 | 1.84e-06 | 100 |
| GO:19016533 | Colorectum | FAP | cellular response to peptide | 89/2622 | 359/18723 | 2.93e-08 | 2.64e-06 | 89 |
| GO:00713753 | Colorectum | FAP | cellular response to peptide hormone stimulus | 75/2622 | 290/18723 | 5.60e-08 | 4.29e-06 | 75 |
| GO:00328683 | Colorectum | FAP | response to insulin | 68/2622 | 264/18723 | 2.71e-07 | 1.55e-05 | 68 |
| GO:00328693 | Colorectum | FAP | cellular response to insulin stimulus | 54/2622 | 203/18723 | 1.54e-06 | 6.59e-05 | 54 |
| GO:0008286 | Colorectum | FAP | insulin receptor signaling pathway | 28/2622 | 116/18723 | 2.37e-03 | 1.89e-02 | 28 |
| GO:00434344 | Colorectum | CRC | response to peptide hormone | 76/2078 | 414/18723 | 6.67e-06 | 2.56e-04 | 76 |
| GO:00328684 | Colorectum | CRC | response to insulin | 53/2078 | 264/18723 | 1.30e-05 | 4.17e-04 | 53 |
| GO:00328694 | Colorectum | CRC | cellular response to insulin stimulus | 42/2078 | 203/18723 | 4.79e-05 | 1.12e-03 | 42 |
| GO:00713754 | Colorectum | CRC | cellular response to peptide hormone stimulus | 55/2078 | 290/18723 | 4.82e-05 | 1.12e-03 | 55 |
| GO:19016534 | Colorectum | CRC | cellular response to peptide | 64/2078 | 359/18723 | 8.54e-05 | 1.75e-03 | 64 |
| GO:00082861 | Colorectum | CRC | insulin receptor signaling pathway | 23/2078 | 116/18723 | 4.02e-03 | 3.33e-02 | 23 |
| GO:190165319 | Esophagus | ESCC | cellular response to peptide | 208/8552 | 359/18723 | 1.68e-06 | 2.01e-05 | 208 |
| GO:0043434111 | Esophagus | ESCC | response to peptide hormone | 234/8552 | 414/18723 | 4.93e-06 | 5.21e-05 | 234 |
| GO:003286918 | Esophagus | ESCC | cellular response to insulin stimulus | 124/8552 | 203/18723 | 6.63e-06 | 6.75e-05 | 124 |
| Hugo Symbol | Variant Class | Variant Classification | dbSNP RS | HGVSc | HGVSp | HGVSp Short | SWISSPROT | BIOTYPE | SIFT | PolyPhen | Tumor Sample Barcode | Tissue | Histology | Sex | Age | Stage | Therapy Types | Drugs | Outcome |
| ZNF106 | SNV | Missense_Mutation | | c.4483G>C | p.Glu1495Gln | p.E1495Q | Q9H2Y7 | protein_coding | tolerated(0.05) | probably_damaging(0.991) | TCGA-AC-A23H-01 | Breast | breast invasive carcinoma | Female | >=65 | I/II | Unknown | Unknown | PD |
| ZNF106 | SNV | Missense_Mutation | | c.281T>C | p.Ile94Thr | p.I94T | Q9H2Y7 | protein_coding | tolerated(0.7) | benign(0) | TCGA-AC-A23H-01 | Breast | breast invasive carcinoma | Female | >=65 | I/II | Unknown | Unknown | PD |
| ZNF106 | SNV | Missense_Mutation | novel | c.4655C>A | p.Thr1552Asn | p.T1552N | Q9H2Y7 | protein_coding | deleterious(0) | probably_damaging(0.999) | TCGA-AN-A046-01 | Breast | breast invasive carcinoma | Female | >=65 | I/II | Unknown | Unknown | SD |
| ZNF106 | SNV | Missense_Mutation | novel | c.1181C>A | p.Thr394Asn | p.T394N | Q9H2Y7 | protein_coding | tolerated_low_confidence(0.12) | benign(0) | TCGA-AN-A046-01 | Breast | breast invasive carcinoma | Female | >=65 | I/II | Unknown | Unknown | SD |
| ZNF106 | SNV | Missense_Mutation | rs574435008 | c.937G>A | p.Asp313Asn | p.D313N | Q9H2Y7 | protein_coding | tolerated(0.46) | benign(0.003) | TCGA-AN-A046-01 | Breast | breast invasive carcinoma | Female | >=65 | I/II | Unknown | Unknown | SD |
| ZNF106 | SNV | Missense_Mutation | | c.865N>A | p.Gly289Ser | p.G289S | Q9H2Y7 | protein_coding | tolerated(0.24) | benign(0.007) | TCGA-AO-A03R-01 | Breast | breast invasive carcinoma | Female | <65 | I/II | Chemotherapy | doxorubicin | SD |
| ZNF106 | SNV | Missense_Mutation | | c.1261N>A | p.Asp421Asn | p.D421N | Q9H2Y7 | protein_coding | tolerated(0.2) | benign(0.041) | TCGA-D8-A1J8-01 | Breast | breast invasive carcinoma | Female | >=65 | I/II | Hormone Therapy | nolvadex | SD |
| ZNF106 | SNV | Missense_Mutation | rs147629444 | c.512N>T | p.Ser171Phe | p.S171F | Q9H2Y7 | protein_coding | tolerated(0.05) | possibly_damaging(0.707) | TCGA-D8-A1JA-01 | Breast | breast invasive carcinoma | Female | <65 | III/IV | Chemotherapy | adriamycin | PD |
| ZNF106 | SNV | Missense_Mutation | | c.1122N>C | p.Met374Ile | p.M374I | Q9H2Y7 | protein_coding | tolerated(0.46) | benign(0) | TCGA-D8-A1JN-01 | Breast | breast invasive carcinoma | Female | >=65 | III/IV | Hormone Therapy | anastrozolum | SD |
| ZNF106 | SNV | Missense_Mutation | | c.2549C>G | p.Ser850Trp | p.S850W | Q9H2Y7 | protein_coding | deleterious(0) | probably_damaging(0.925) | TCGA-E2-A14X-01 | Breast | breast invasive carcinoma | Female | <65 | III/IV | Chemotherapy | doxorubicin | SD |


