
|
|||||
|
 | |
| |
| |
| |
| |
| |
|
Gene: ZFYVE27 |
Gene summary for ZFYVE27 |
| Gene information | Species | Human | Gene symbol | ZFYVE27 | Gene ID | 118813 |
| Gene name | zinc finger FYVE-type containing 27 | |
| Gene Alias | PROTRUDIN | |
| Cytomap | 10q24.2 | |
| Gene Type | protein-coding | GO ID | GO:0000902 | UniProtAcc | Q5T4F4 |
Top |
Malignant transformation analysis |
| Identification of the aberrant gene expression in precancerous and cancerous lesions by comparing the gene expression of stem-like cells in diseased tissues with normal stem cells |
| Entrez ID | Symbol | Replicates | Species | Organ | Tissue | Adj P-value | Log2FC | Malignancy |
| 118813 | ZFYVE27 | P15T-E | Human | Esophagus | ESCC | 3.83e-13 | 2.14e-01 | 0.1149 |
| 118813 | ZFYVE27 | P16T-E | Human | Esophagus | ESCC | 3.18e-22 | 3.34e-01 | 0.1153 |
| 118813 | ZFYVE27 | P20T-E | Human | Esophagus | ESCC | 8.18e-22 | 4.86e-01 | 0.1124 |
| 118813 | ZFYVE27 | P21T-E | Human | Esophagus | ESCC | 5.63e-15 | 2.61e-01 | 0.1617 |
| 118813 | ZFYVE27 | P22T-E | Human | Esophagus | ESCC | 3.38e-14 | 1.67e-01 | 0.1236 |
| 118813 | ZFYVE27 | P23T-E | Human | Esophagus | ESCC | 5.09e-19 | 4.69e-01 | 0.108 |
| 118813 | ZFYVE27 | P24T-E | Human | Esophagus | ESCC | 7.67e-08 | 1.82e-01 | 0.1287 |
| 118813 | ZFYVE27 | P26T-E | Human | Esophagus | ESCC | 9.48e-26 | 3.65e-01 | 0.1276 |
| 118813 | ZFYVE27 | P27T-E | Human | Esophagus | ESCC | 2.46e-25 | 4.26e-01 | 0.1055 |
| 118813 | ZFYVE27 | P28T-E | Human | Esophagus | ESCC | 4.82e-13 | 3.39e-01 | 0.1149 |
| 118813 | ZFYVE27 | P30T-E | Human | Esophagus | ESCC | 1.23e-22 | 5.58e-01 | 0.137 |
| 118813 | ZFYVE27 | P31T-E | Human | Esophagus | ESCC | 3.77e-14 | 2.22e-01 | 0.1251 |
| 118813 | ZFYVE27 | P32T-E | Human | Esophagus | ESCC | 3.82e-17 | 2.82e-01 | 0.1666 |
| 118813 | ZFYVE27 | P36T-E | Human | Esophagus | ESCC | 7.03e-19 | 5.44e-01 | 0.1187 |
| 118813 | ZFYVE27 | P37T-E | Human | Esophagus | ESCC | 5.16e-16 | 3.16e-01 | 0.1371 |
| 118813 | ZFYVE27 | P39T-E | Human | Esophagus | ESCC | 1.22e-18 | 2.79e-01 | 0.0894 |
| 118813 | ZFYVE27 | P40T-E | Human | Esophagus | ESCC | 1.66e-05 | 1.90e-01 | 0.109 |
| 118813 | ZFYVE27 | P42T-E | Human | Esophagus | ESCC | 1.72e-09 | 2.28e-01 | 0.1175 |
| 118813 | ZFYVE27 | P44T-E | Human | Esophagus | ESCC | 1.24e-06 | 2.26e-01 | 0.1096 |
| 118813 | ZFYVE27 | P47T-E | Human | Esophagus | ESCC | 4.54e-18 | 3.04e-01 | 0.1067 |
| Page: 1 2 3 4 5 |
| Tissue | Expression Dynamics | Abbreviation |
| Colorectum (GSE201348) | 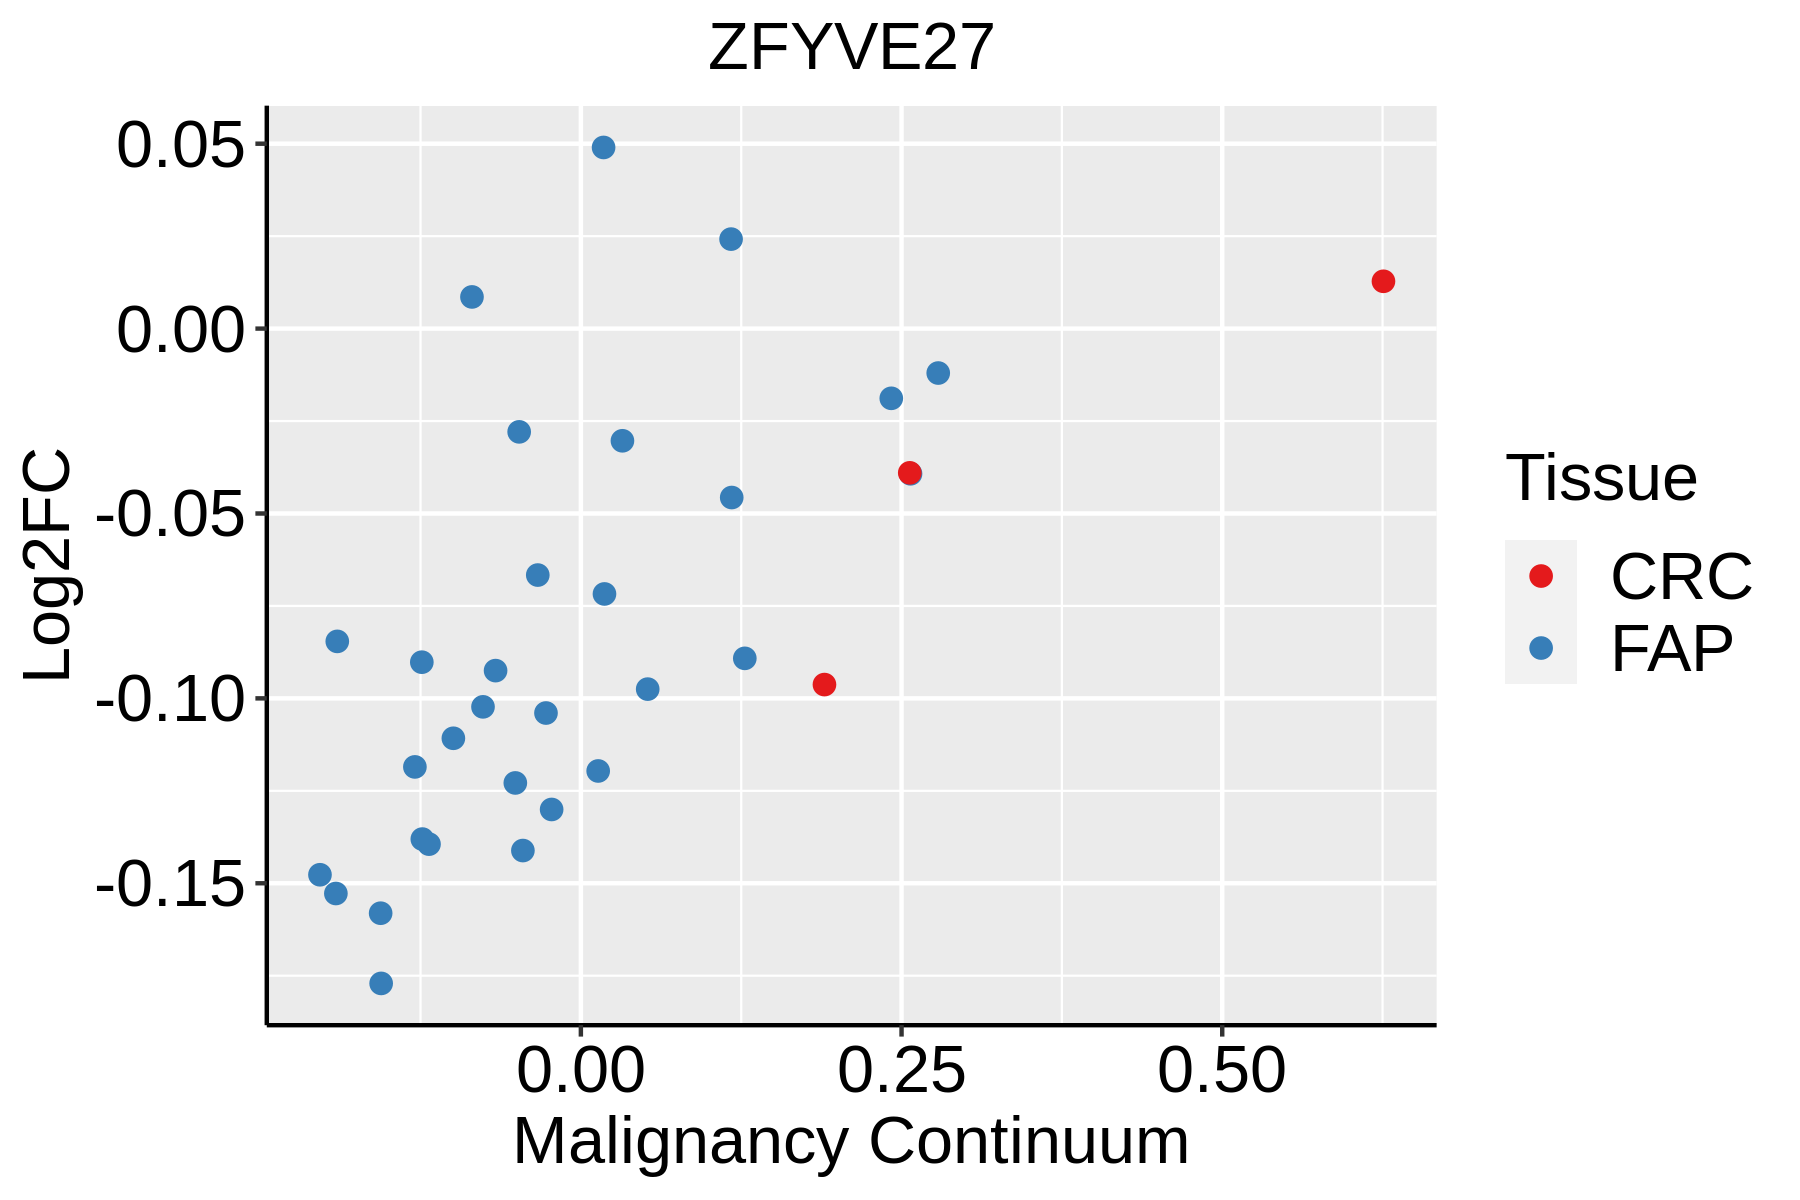 | FAP: Familial adenomatous polyposis |
| CRC: Colorectal cancer | ||
| Colorectum (HTA11) |  | AD: Adenomas |
| SER: Sessile serrated lesions | ||
| MSI-H: Microsatellite-high colorectal cancer | ||
| MSS: Microsatellite stable colorectal cancer | ||
| Esophagus | 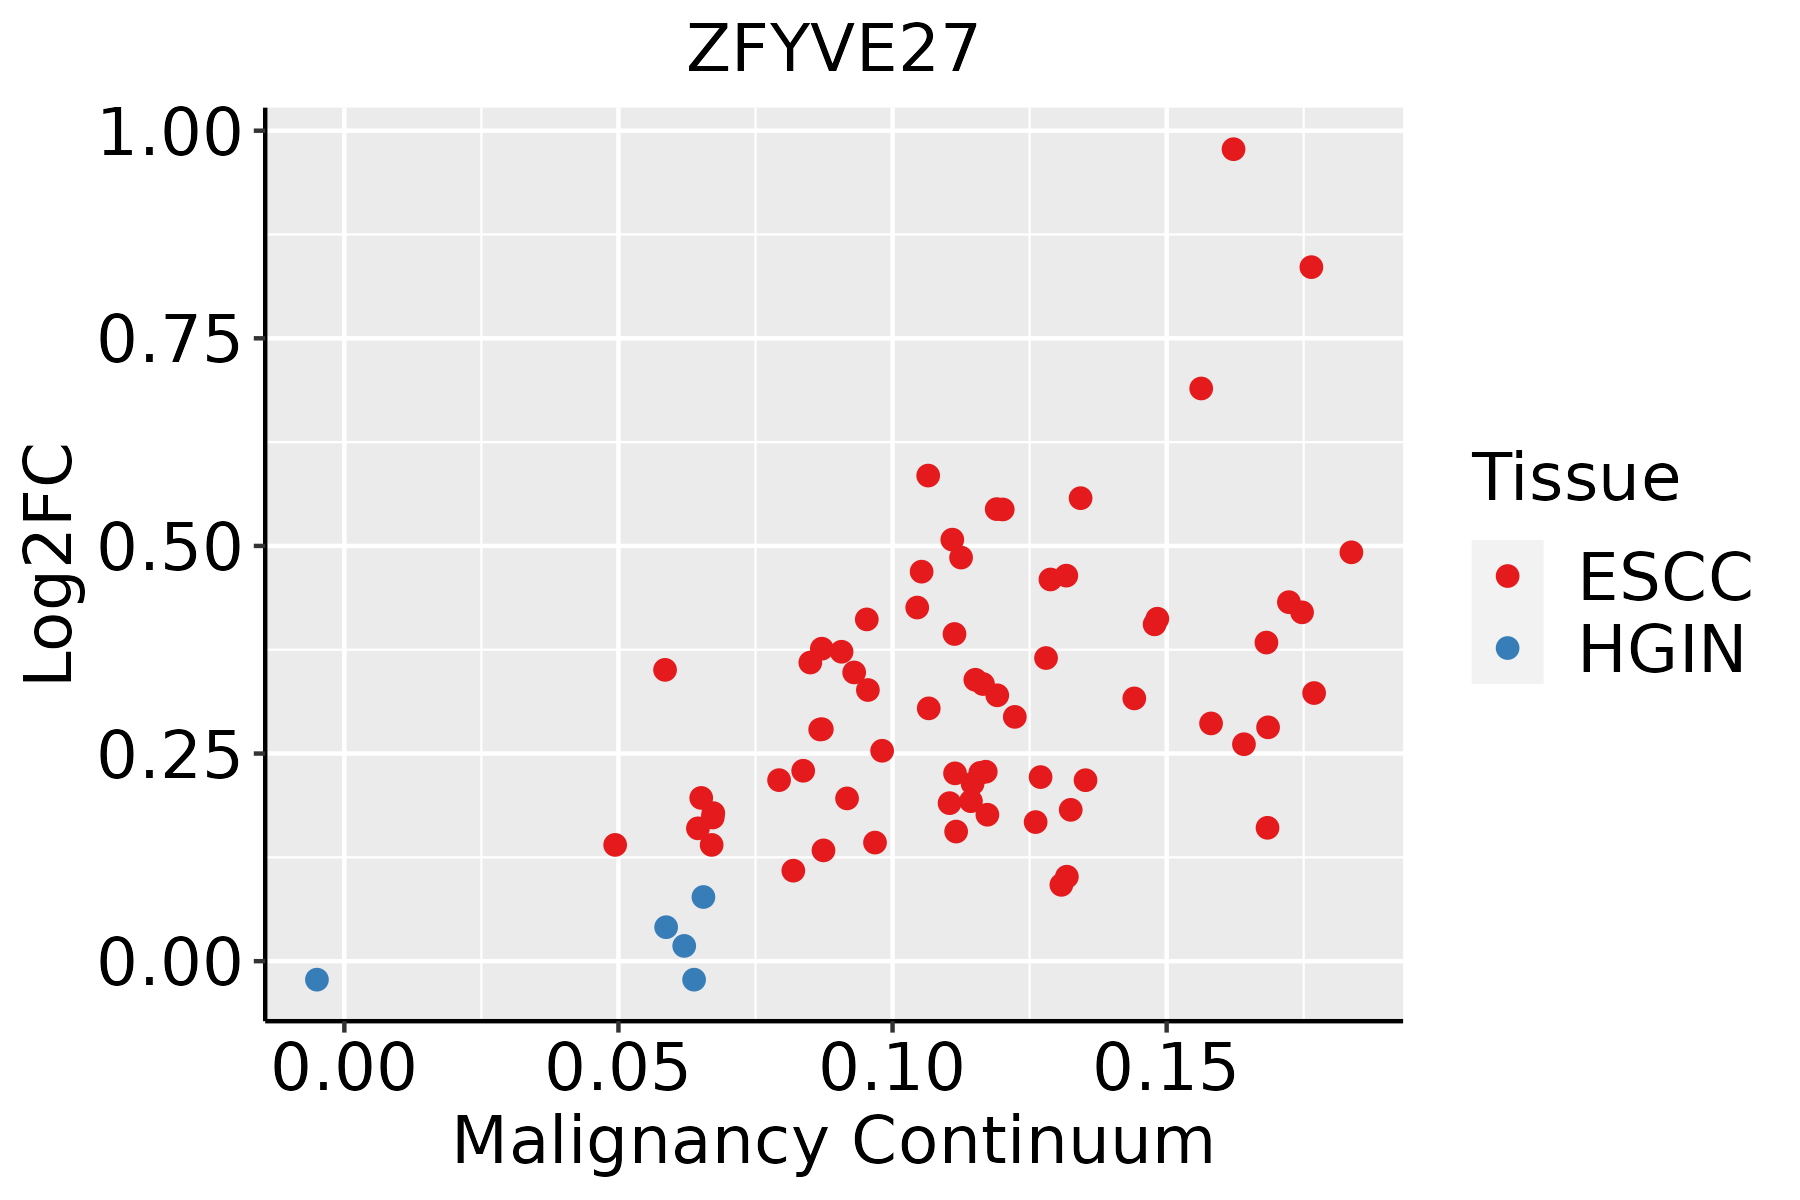 | ESCC: Esophageal squamous cell carcinoma |
| HGIN: High-grade intraepithelial neoplasias | ||
| LGIN: Low-grade intraepithelial neoplasias | ||
| Liver |  | HCC: Hepatocellular carcinoma |
| NAFLD: Non-alcoholic fatty liver disease | ||
| Oral Cavity | 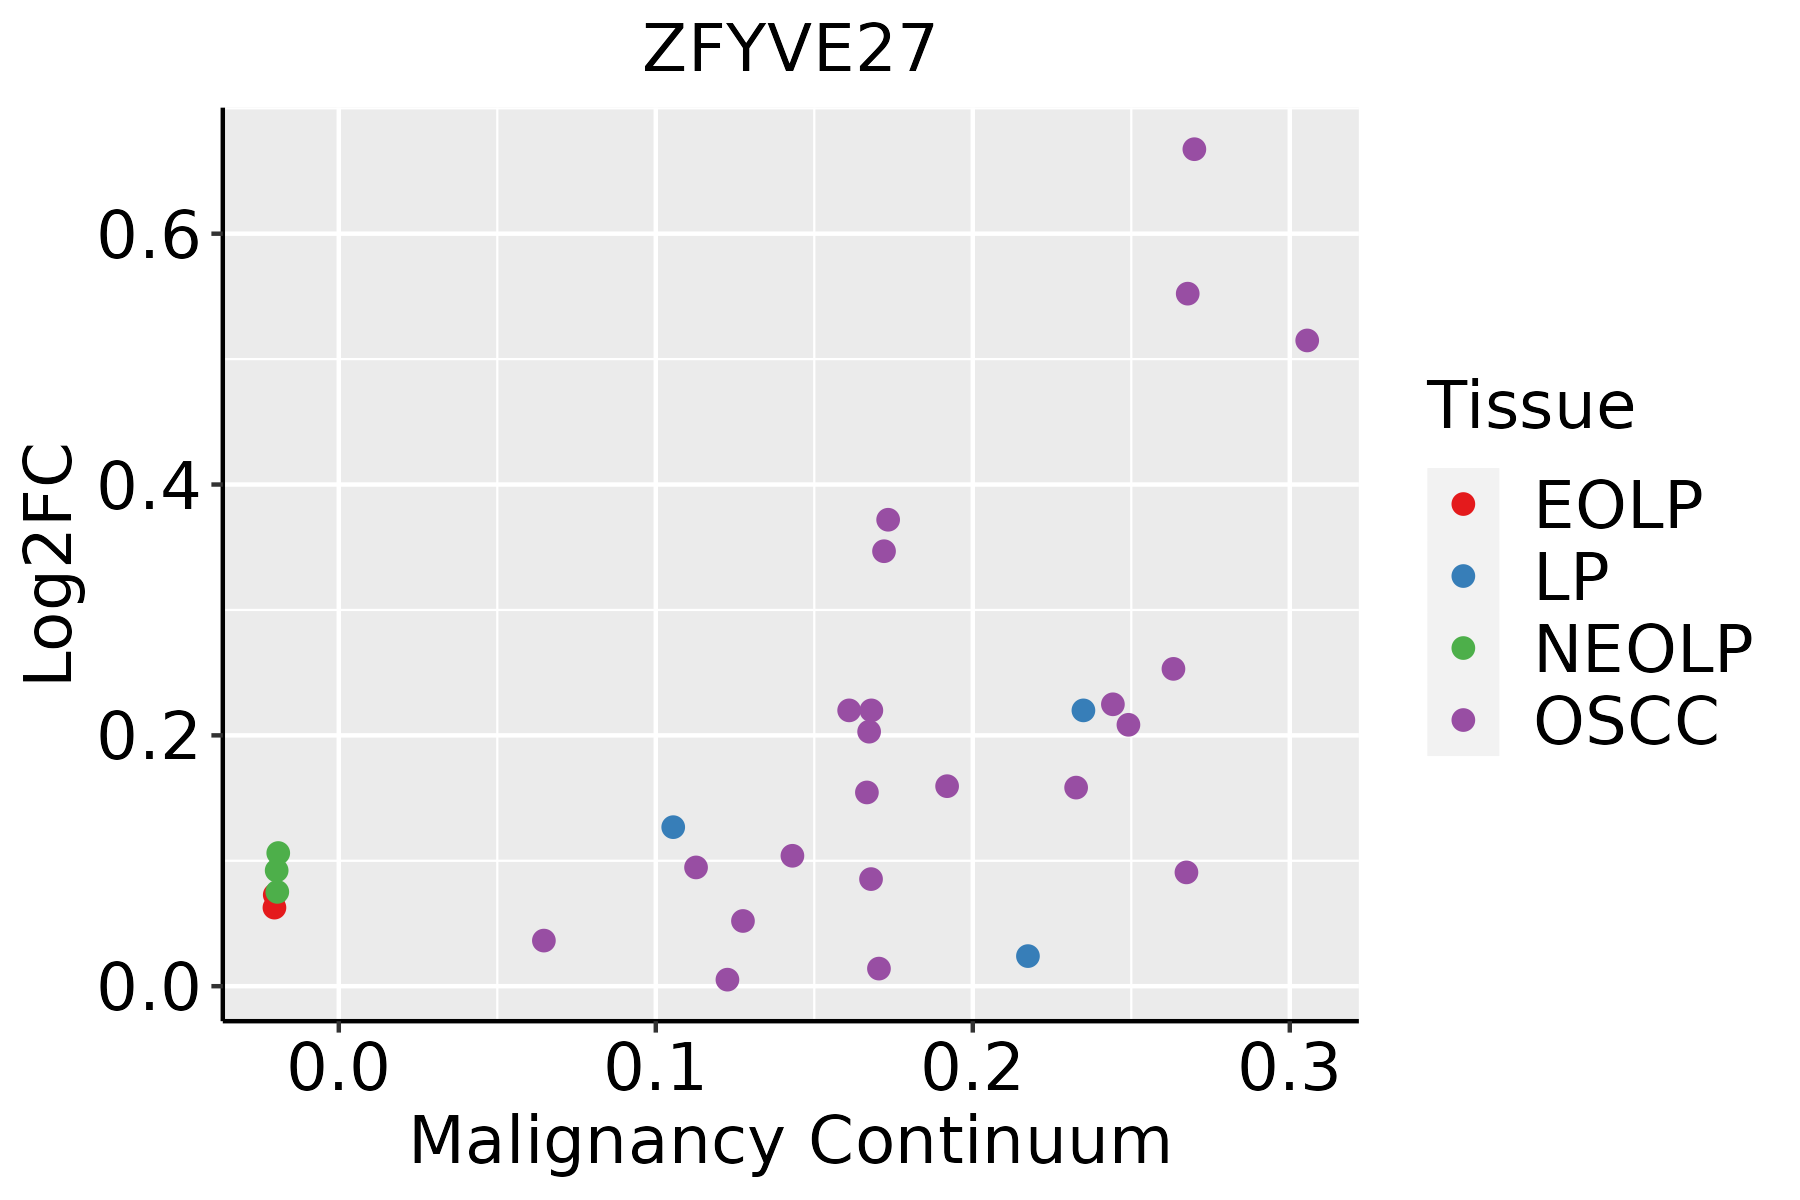 | EOLP: Erosive Oral lichen planus |
| LP: leukoplakia | ||
| NEOLP: Non-erosive oral lichen planus | ||
| OSCC: Oral squamous cell carcinoma |
| ∗log2FC in expression of this searched gene in stem-like cells from each diseased tissue sample relative to stem-like cells in normal samples in each tissue plotted against the malignancy continuum. Samples are colored based on if they are from different disease stage. |
Top |
Malignant transformation related pathway analysis |
| Find out the enriched GO biological processes and KEGG pathways involved in transition from healthy to precancer to cancer |
| Tissue | Disease Stage | Enriched GO biological Processes |
| Colorectum | AD |  |
| Colorectum | SER |  |
| Colorectum | MSS |  |
| Colorectum | MSI-H |  |
| Colorectum | FAP |  |
| ∗Top 15 enriched GO BP terms are showed in the bar plot of each disease state in each tissue. Each row represents a significant GO biological process which is colored according to the -log10(p.adjust). |
| Page: 1 2 3 4 5 6 7 8 9 |
| GO ID | Tissue | Disease Stage | Description | Gene Ratio | Bg Ratio | pvalue | p.adjust | Count |
| GO:0072659 | Colorectum | AD | protein localization to plasma membrane | 122/3918 | 284/18723 | 2.86e-17 | 1.49e-14 | 122 |
| GO:1990778 | Colorectum | AD | protein localization to cell periphery | 129/3918 | 333/18723 | 5.51e-14 | 1.15e-11 | 129 |
| GO:0032535 | Colorectum | AD | regulation of cellular component size | 142/3918 | 383/18723 | 1.74e-13 | 3.41e-11 | 142 |
| GO:0016049 | Colorectum | AD | cell growth | 143/3918 | 482/18723 | 2.83e-06 | 8.09e-05 | 143 |
| GO:0001558 | Colorectum | AD | regulation of cell growth | 124/3918 | 414/18723 | 7.67e-06 | 1.86e-04 | 124 |
| GO:0010975 | Colorectum | AD | regulation of neuron projection development | 129/3918 | 445/18723 | 2.88e-05 | 5.37e-04 | 129 |
| GO:0007409 | Colorectum | AD | axonogenesis | 122/3918 | 418/18723 | 3.36e-05 | 6.15e-04 | 122 |
| GO:0031346 | Colorectum | AD | positive regulation of cell projection organization | 104/3918 | 353/18723 | 8.26e-05 | 1.30e-03 | 104 |
| GO:0061564 | Colorectum | AD | axon development | 132/3918 | 467/18723 | 8.40e-05 | 1.31e-03 | 132 |
| GO:0030307 | Colorectum | AD | positive regulation of cell growth | 54/3918 | 166/18723 | 3.08e-04 | 3.69e-03 | 54 |
| GO:0010720 | Colorectum | AD | positive regulation of cell development | 87/3918 | 298/18723 | 4.17e-04 | 4.71e-03 | 87 |
| GO:0045927 | Colorectum | AD | positive regulation of growth | 77/3918 | 259/18723 | 4.82e-04 | 5.27e-03 | 77 |
| GO:0008361 | Colorectum | AD | regulation of cell size | 56/3918 | 181/18723 | 9.61e-04 | 9.07e-03 | 56 |
| GO:0050770 | Colorectum | AD | regulation of axonogenesis | 49/3918 | 154/18723 | 9.88e-04 | 9.28e-03 | 49 |
| GO:0007029 | Colorectum | AD | endoplasmic reticulum organization | 31/3918 | 87/18723 | 1.08e-03 | 1.00e-02 | 31 |
| GO:0045773 | Colorectum | AD | positive regulation of axon extension | 18/3918 | 42/18723 | 1.09e-03 | 1.01e-02 | 18 |
| GO:0048638 | Colorectum | AD | regulation of developmental growth | 92/3918 | 330/18723 | 1.48e-03 | 1.25e-02 | 92 |
| GO:0050767 | Colorectum | AD | regulation of neurogenesis | 99/3918 | 364/18723 | 2.35e-03 | 1.82e-02 | 99 |
| GO:0030516 | Colorectum | AD | regulation of axon extension | 32/3918 | 95/18723 | 2.59e-03 | 1.96e-02 | 32 |
| GO:0048588 | Colorectum | AD | developmental cell growth | 67/3918 | 234/18723 | 3.03e-03 | 2.25e-02 | 67 |
| Page: 1 2 3 4 5 6 7 8 9 |
| Pathway ID | Tissue | Disease Stage | Description | Gene Ratio | Bg Ratio | pvalue | p.adjust | qvalue | Count |
| hsa04144 | Colorectum | AD | Endocytosis | 111/2092 | 251/8465 | 5.95e-12 | 1.42e-10 | 9.08e-11 | 111 |
| hsa041441 | Colorectum | AD | Endocytosis | 111/2092 | 251/8465 | 5.95e-12 | 1.42e-10 | 9.08e-11 | 111 |
| hsa041442 | Colorectum | SER | Endocytosis | 81/1580 | 251/8465 | 1.14e-07 | 2.36e-06 | 1.71e-06 | 81 |
| hsa041443 | Colorectum | SER | Endocytosis | 81/1580 | 251/8465 | 1.14e-07 | 2.36e-06 | 1.71e-06 | 81 |
| hsa041444 | Colorectum | MSS | Endocytosis | 102/1875 | 251/8465 | 1.85e-11 | 4.43e-10 | 2.71e-10 | 102 |
| hsa041445 | Colorectum | MSS | Endocytosis | 102/1875 | 251/8465 | 1.85e-11 | 4.43e-10 | 2.71e-10 | 102 |
| hsa041446 | Colorectum | FAP | Endocytosis | 78/1404 | 251/8465 | 6.20e-09 | 2.96e-07 | 1.80e-07 | 78 |
| hsa041447 | Colorectum | FAP | Endocytosis | 78/1404 | 251/8465 | 6.20e-09 | 2.96e-07 | 1.80e-07 | 78 |
| hsa04144210 | Esophagus | ESCC | Endocytosis | 186/4205 | 251/8465 | 9.74e-16 | 4.66e-14 | 2.39e-14 | 186 |
| hsa0414437 | Esophagus | ESCC | Endocytosis | 186/4205 | 251/8465 | 9.74e-16 | 4.66e-14 | 2.39e-14 | 186 |
| hsa0414422 | Liver | HCC | Endocytosis | 178/4020 | 251/8465 | 2.03e-14 | 5.22e-13 | 2.91e-13 | 178 |
| hsa0414432 | Liver | HCC | Endocytosis | 178/4020 | 251/8465 | 2.03e-14 | 5.22e-13 | 2.91e-13 | 178 |
| hsa0414427 | Oral cavity | OSCC | Endocytosis | 174/3704 | 251/8465 | 9.42e-17 | 4.51e-15 | 2.29e-15 | 174 |
| hsa04144112 | Oral cavity | OSCC | Endocytosis | 174/3704 | 251/8465 | 9.42e-17 | 4.51e-15 | 2.29e-15 | 174 |
| Page: 1 |
Top |
Cell-cell communication analysis |
| Identification of potential cell-cell interactions between two cell types and their ligand-receptor pairs for different disease states |
| Ligand | Receptor | LRpair | Pathway | Tissue | Disease Stage |
| Page: 1 |
Top |
Single-cell gene regulatory network inference analysis |
| Find out the significant the regulons (TFs) and the target genes of each regulon across cell types for different disease states |
| TF | Cell Type | Tissue | Disease Stage | Target Gene | RSS | Regulon Activity |
| ∗The dot plots of a searched regulon are shown for all cell subpopulations in each disease state of each tissue based on the regulon specific score inferred using pySCENIC and by calculating the average expression. |
| Page: 1 |
Top |
Somatic mutation of malignant transformation related genes |
| Annotation of somatic variants for genes involved in malignant transformation |
| Hugo Symbol | Variant Class | Variant Classification | dbSNP RS | HGVSc | HGVSp | HGVSp Short | SWISSPROT | BIOTYPE | SIFT | PolyPhen | Tumor Sample Barcode | Tissue | Histology | Sex | Age | Stage | Therapy Types | Drugs | Outcome |
| ZFYVE27 | SNV | Missense_Mutation | novel | c.739C>T | p.Pro247Ser | p.P247S | Q5T4F4 | protein_coding | tolerated(0.39) | benign(0.075) | TCGA-AC-A23H-01 | Breast | breast invasive carcinoma | Female | >=65 | I/II | Unknown | Unknown | PD |
| ZFYVE27 | SNV | Missense_Mutation | rs758277807 | c.531N>C | p.Glu177Asp | p.E177D | Q5T4F4 | protein_coding | tolerated(0.41) | benign(0.068) | TCGA-C8-A1HJ-01 | Breast | breast invasive carcinoma | Female | <65 | I/II | Unknown | Unknown | SD |
| ZFYVE27 | insertion | Frame_Shift_Ins | novel | c.829_830insTCAATAATAATAATTGTAATAAAAA | p.Pro277LeufsTer16 | p.P277Lfs*16 | Q5T4F4 | protein_coding | TCGA-BH-A0AY-01 | Breast | breast invasive carcinoma | Female | <65 | I/II | Chemotherapy | SD | |||
| ZFYVE27 | SNV | Missense_Mutation | novel | c.686N>T | p.Ser229Phe | p.S229F | Q5T4F4 | protein_coding | tolerated(0.79) | benign(0.007) | TCGA-C5-A1BJ-01 | Cervix | cervical & endocervical cancer | Female | <65 | I/II | Unknown | Unknown | SD |
| ZFYVE27 | SNV | Missense_Mutation | rs368842487 | c.1067C>T | p.Thr356Met | p.T356M | Q5T4F4 | protein_coding | tolerated(0.07) | possibly_damaging(0.534) | TCGA-AA-3697-01 | Colorectum | colon adenocarcinoma | Male | >=65 | I/II | Unknown | Unknown | SD |
| ZFYVE27 | SNV | Missense_Mutation | rs772972223 | c.782N>T | p.Thr261Met | p.T261M | Q5T4F4 | protein_coding | deleterious(0.04) | possibly_damaging(0.87) | TCGA-AA-3864-01 | Colorectum | colon adenocarcinoma | Male | >=65 | I/II | Unknown | Unknown | SD |
| ZFYVE27 | SNV | Missense_Mutation | c.361N>A | p.Glu121Lys | p.E121K | Q5T4F4 | protein_coding | tolerated(0.07) | benign(0.178) | TCGA-AD-6889-01 | Colorectum | colon adenocarcinoma | Male | >=65 | I/II | Chemotherapy | xeloda | PD | |
| ZFYVE27 | SNV | Missense_Mutation | c.598N>T | p.Pro200Ser | p.P200S | Q5T4F4 | protein_coding | tolerated(0.1) | probably_damaging(0.998) | TCGA-AD-6889-01 | Colorectum | colon adenocarcinoma | Male | >=65 | I/II | Chemotherapy | xeloda | PD | |
| ZFYVE27 | SNV | Missense_Mutation | rs751379469 | c.538N>A | p.Val180Ile | p.V180I | Q5T4F4 | protein_coding | tolerated(0.12) | benign(0) | TCGA-AZ-4313-01 | Colorectum | colon adenocarcinoma | Female | <65 | I/II | Unknown | Unknown | SD |
| ZFYVE27 | SNV | Missense_Mutation | c.838N>A | p.Val280Met | p.V280M | Q5T4F4 | protein_coding | deleterious(0) | probably_damaging(0.999) | TCGA-CK-4951-01 | Colorectum | colon adenocarcinoma | Female | >=65 | I/II | Unknown | Unknown | PD |
| Page: 1 2 3 4 |
Top |
Related drugs of malignant transformation related genes |
| Identification of chemicals and drugs interact with genes involved in malignant transfromation |
| (DGIdb 4.0) |
| Entrez ID | Symbol | Category | Interaction Types | Drug Claim Name | Drug Name | PMIDs |
| Page: 1 |

Copyright 2023-Present -The University of Texas Health Science Center at Houston |