
|
|||||
|
 | |
| |
| |
| |
| |
| |
|
Gene: ZC3H11A |
Gene summary for ZC3H11A |
| Gene information | Species | Human | Gene symbol | ZC3H11A | Gene ID | 9877 |
| Gene name | zinc finger CCCH-type containing 11A | |
| Gene Alias | ZC3HDC11A | |
| Cytomap | 1q32.1 | |
| Gene Type | protein-coding | GO ID | GO:0006403 | UniProtAcc | O75152 |
Top |
Malignant transformation analysis |
| Identification of the aberrant gene expression in precancerous and cancerous lesions by comparing the gene expression of stem-like cells in diseased tissues with normal stem cells |
| Entrez ID | Symbol | Replicates | Species | Organ | Tissue | Adj P-value | Log2FC | Malignancy |
| 9877 | ZC3H11A | HTA11_10711_2000001011 | Human | Colorectum | AD | 6.48e-11 | 2.91e-01 | 0.0338 |
| 9877 | ZC3H11A | HTA11_7696_3000711011 | Human | Colorectum | AD | 7.11e-14 | 2.45e-01 | 0.0674 |
| 9877 | ZC3H11A | HTA11_6818_2000001011 | Human | Colorectum | AD | 6.25e-06 | 2.89e-01 | 0.0112 |
| 9877 | ZC3H11A | HTA11_7469_2000001011 | Human | Colorectum | AD | 4.71e-07 | 4.52e-01 | -0.0124 |
| 9877 | ZC3H11A | HTA11_6818_2000001021 | Human | Colorectum | AD | 1.54e-06 | 2.74e-01 | 0.0588 |
| 9877 | ZC3H11A | HTA11_99999970781_79442 | Human | Colorectum | MSS | 3.45e-30 | 5.23e-01 | 0.294 |
| 9877 | ZC3H11A | HTA11_99999965062_69753 | Human | Colorectum | MSI-H | 1.91e-08 | 8.45e-01 | 0.3487 |
| 9877 | ZC3H11A | HTA11_99999965104_69814 | Human | Colorectum | MSS | 1.96e-16 | 4.06e-01 | 0.281 |
| 9877 | ZC3H11A | HTA11_99999971662_82457 | Human | Colorectum | MSS | 4.61e-27 | 5.29e-01 | 0.3859 |
| 9877 | ZC3H11A | HTA11_99999973899_84307 | Human | Colorectum | MSS | 2.22e-05 | 2.66e-01 | 0.2585 |
| 9877 | ZC3H11A | HTA11_99999974143_84620 | Human | Colorectum | MSS | 1.73e-12 | 2.57e-01 | 0.3005 |
| 9877 | ZC3H11A | LZE4T | Human | Esophagus | ESCC | 7.56e-12 | 1.50e-01 | 0.0811 |
| 9877 | ZC3H11A | LZE7T | Human | Esophagus | ESCC | 4.73e-04 | 6.89e-02 | 0.0667 |
| 9877 | ZC3H11A | LZE8T | Human | Esophagus | ESCC | 2.12e-05 | -1.26e-01 | 0.067 |
| 9877 | ZC3H11A | LZE20T | Human | Esophagus | ESCC | 3.35e-04 | -1.18e-01 | 0.0662 |
| 9877 | ZC3H11A | LZE24T | Human | Esophagus | ESCC | 5.05e-10 | -3.28e-03 | 0.0596 |
| 9877 | ZC3H11A | P1T-E | Human | Esophagus | ESCC | 2.64e-10 | 6.28e-01 | 0.0875 |
| 9877 | ZC3H11A | P2T-E | Human | Esophagus | ESCC | 3.90e-51 | 1.07e+00 | 0.1177 |
| 9877 | ZC3H11A | P4T-E | Human | Esophagus | ESCC | 6.20e-30 | 5.59e-01 | 0.1323 |
| 9877 | ZC3H11A | P5T-E | Human | Esophagus | ESCC | 1.04e-21 | 4.12e-01 | 0.1327 |
| Page: 1 2 3 4 5 6 7 8 9 |
| Tissue | Expression Dynamics | Abbreviation |
| Colorectum (GSE201348) |  | FAP: Familial adenomatous polyposis |
| CRC: Colorectal cancer | ||
| Colorectum (HTA11) |  | AD: Adenomas |
| SER: Sessile serrated lesions | ||
| MSI-H: Microsatellite-high colorectal cancer | ||
| MSS: Microsatellite stable colorectal cancer | ||
| Esophagus |  | ESCC: Esophageal squamous cell carcinoma |
| HGIN: High-grade intraepithelial neoplasias | ||
| LGIN: Low-grade intraepithelial neoplasias | ||
| Liver | 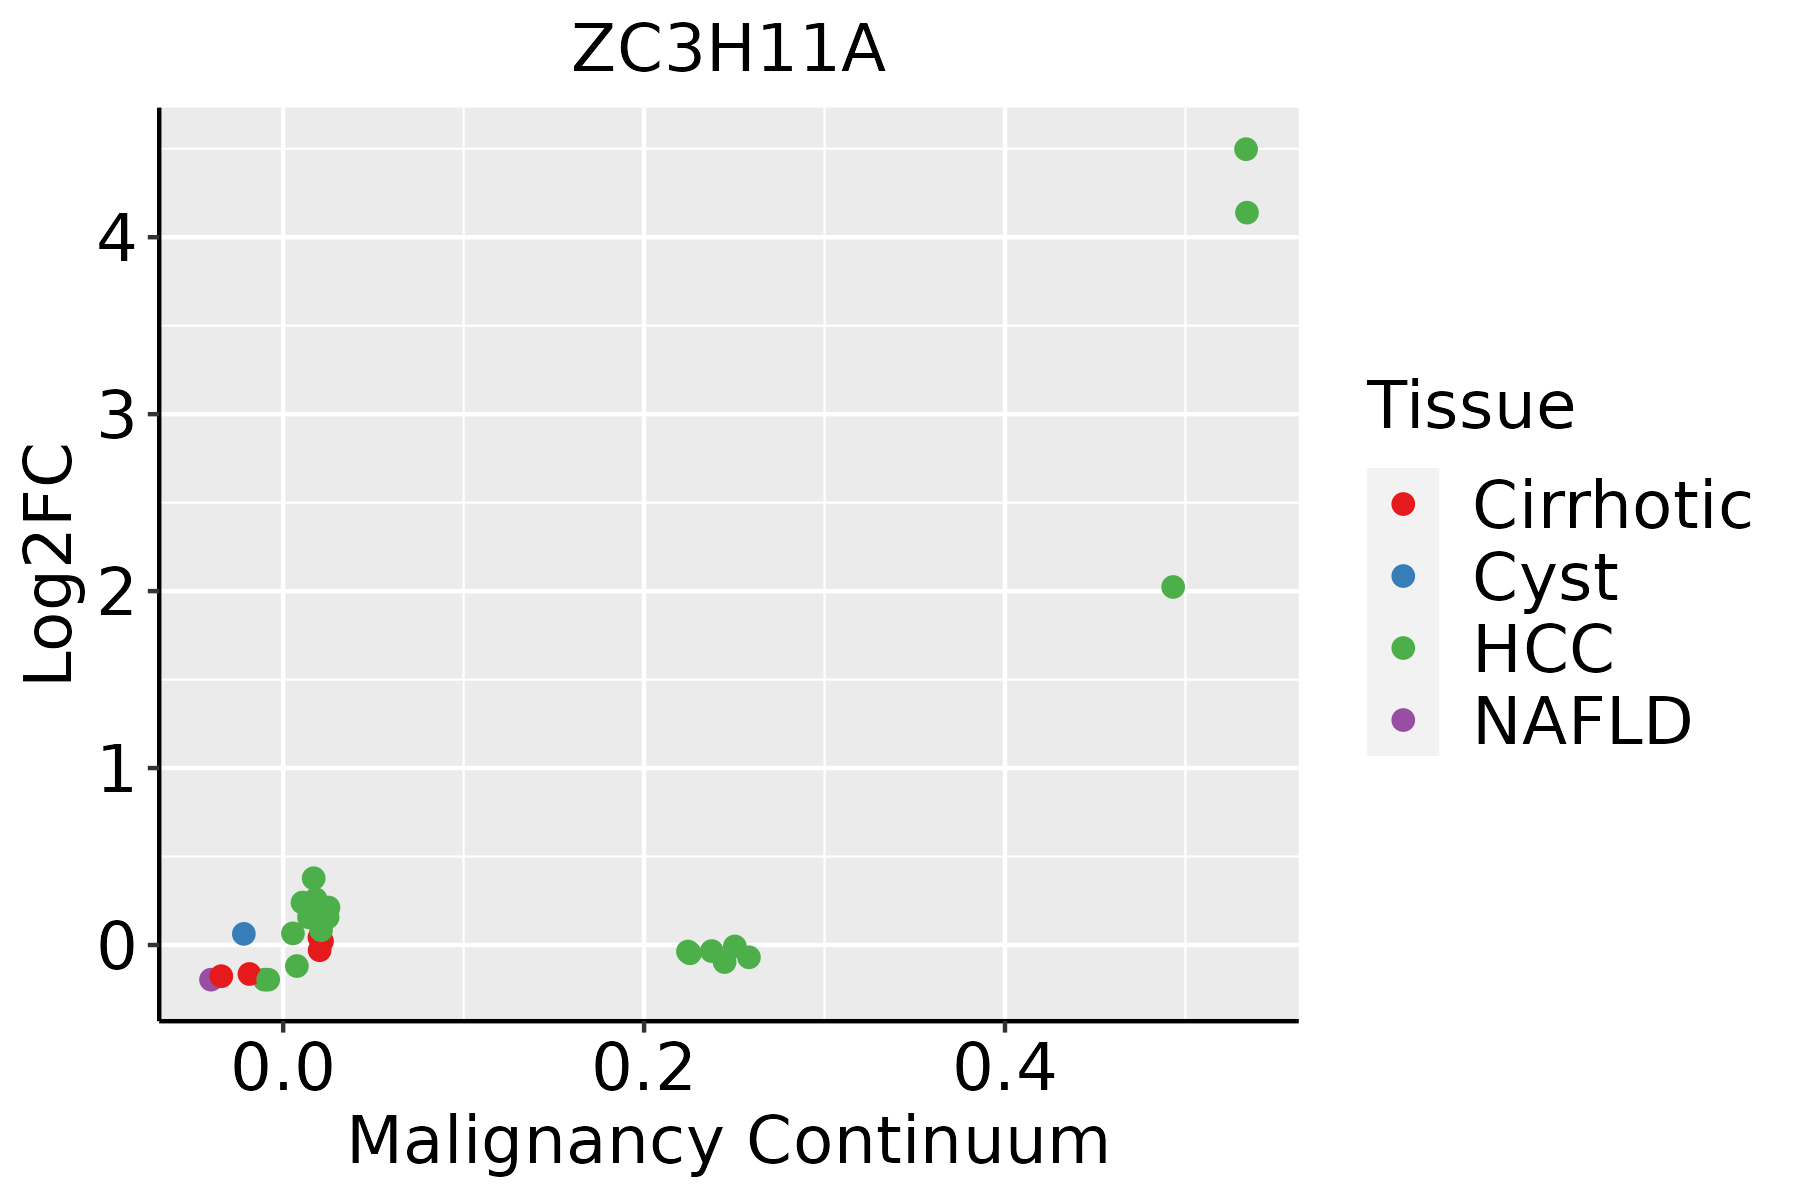 | HCC: Hepatocellular carcinoma |
| NAFLD: Non-alcoholic fatty liver disease | ||
| Oral Cavity | 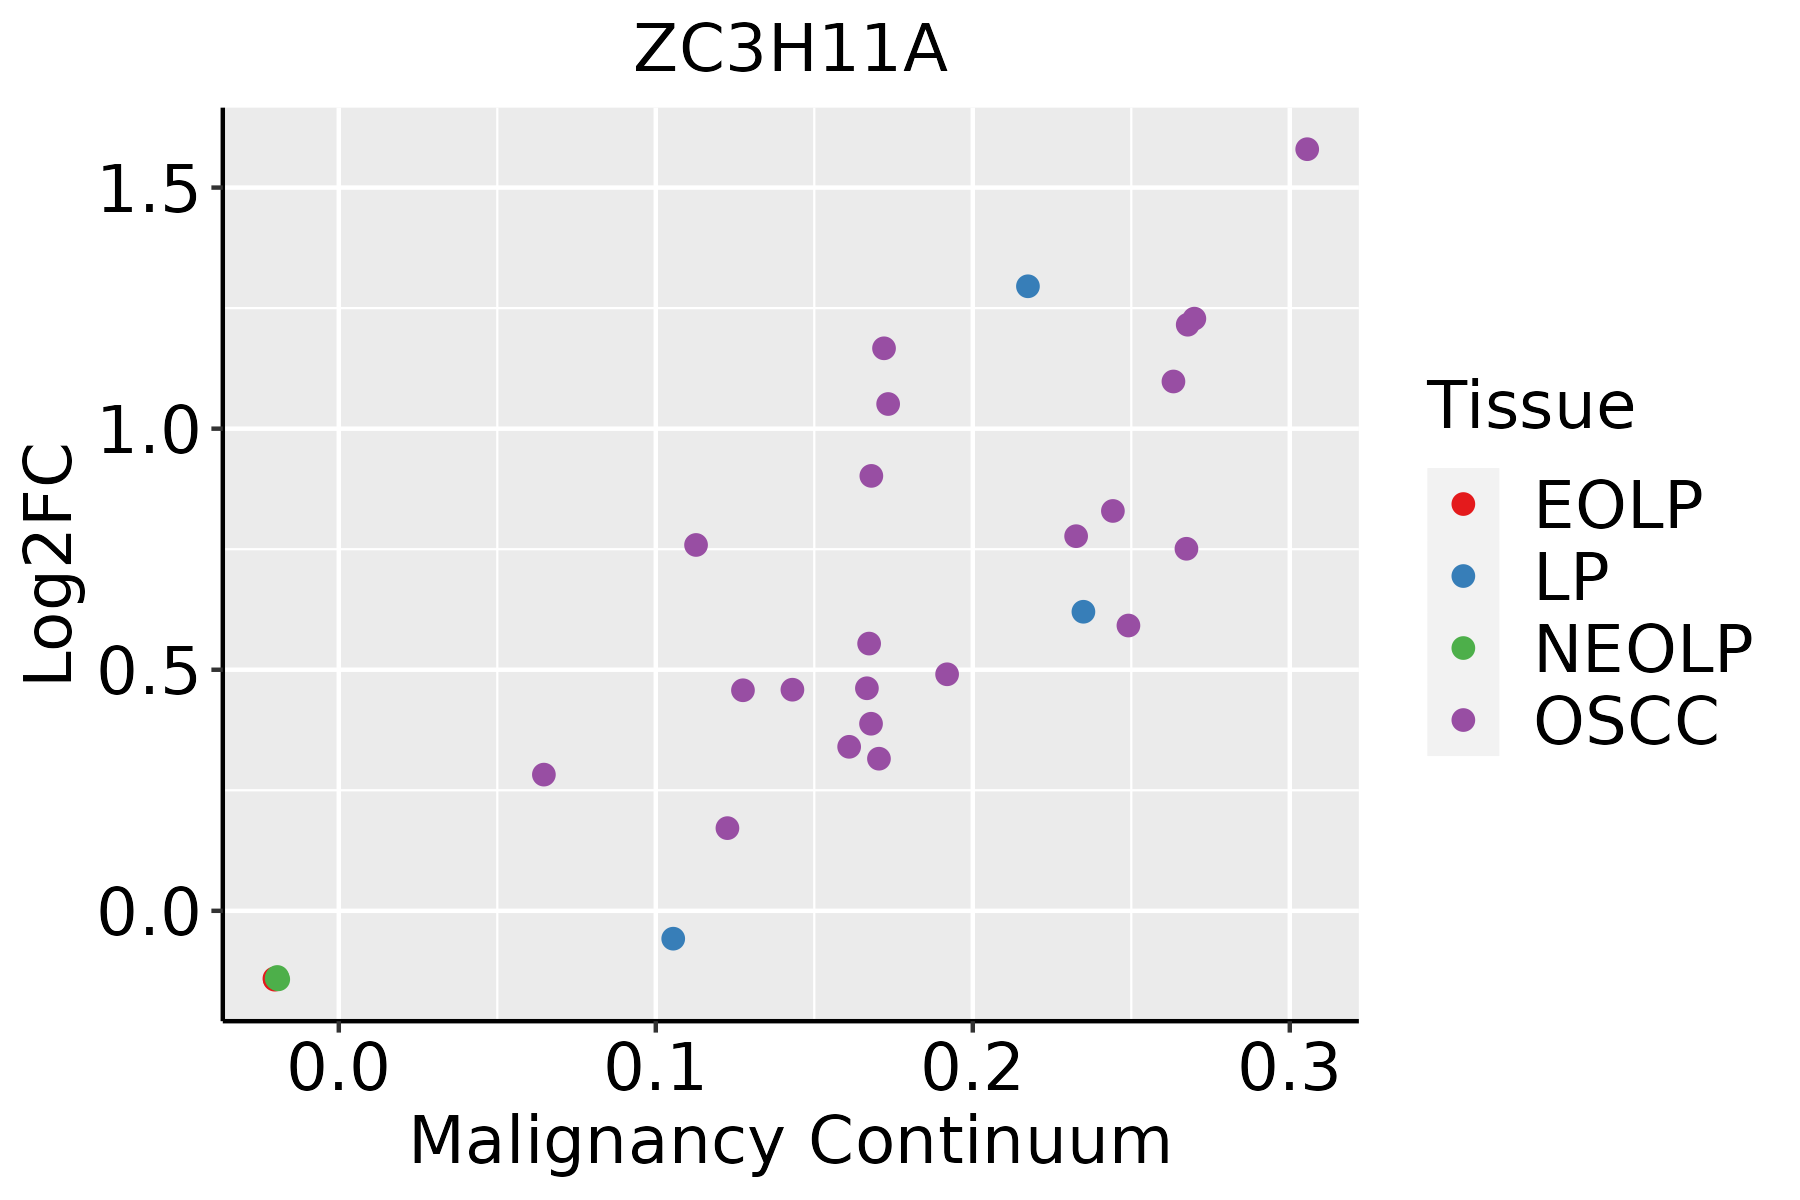 | EOLP: Erosive Oral lichen planus |
| LP: leukoplakia | ||
| NEOLP: Non-erosive oral lichen planus | ||
| OSCC: Oral squamous cell carcinoma | ||
| Prostate | 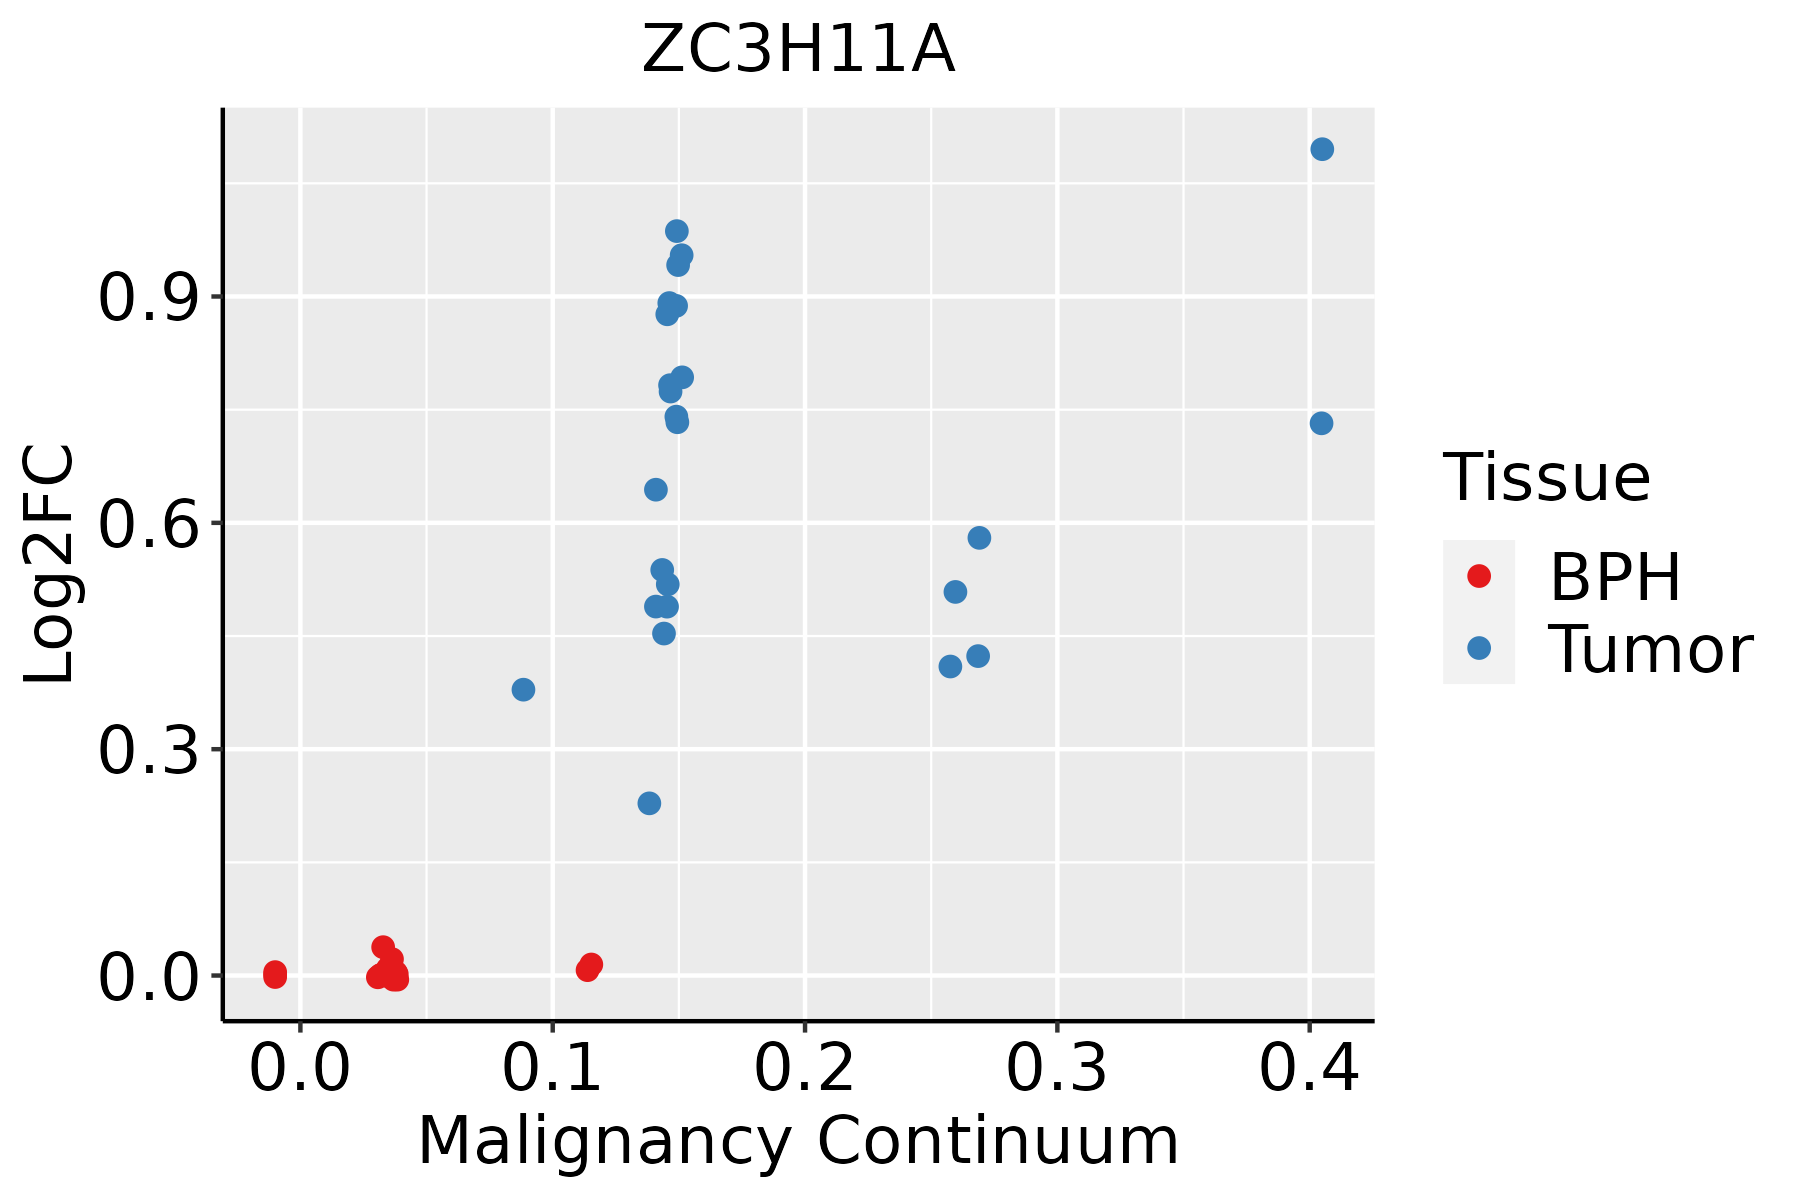 | BPH: Benign Prostatic Hyperplasia |
| Skin | 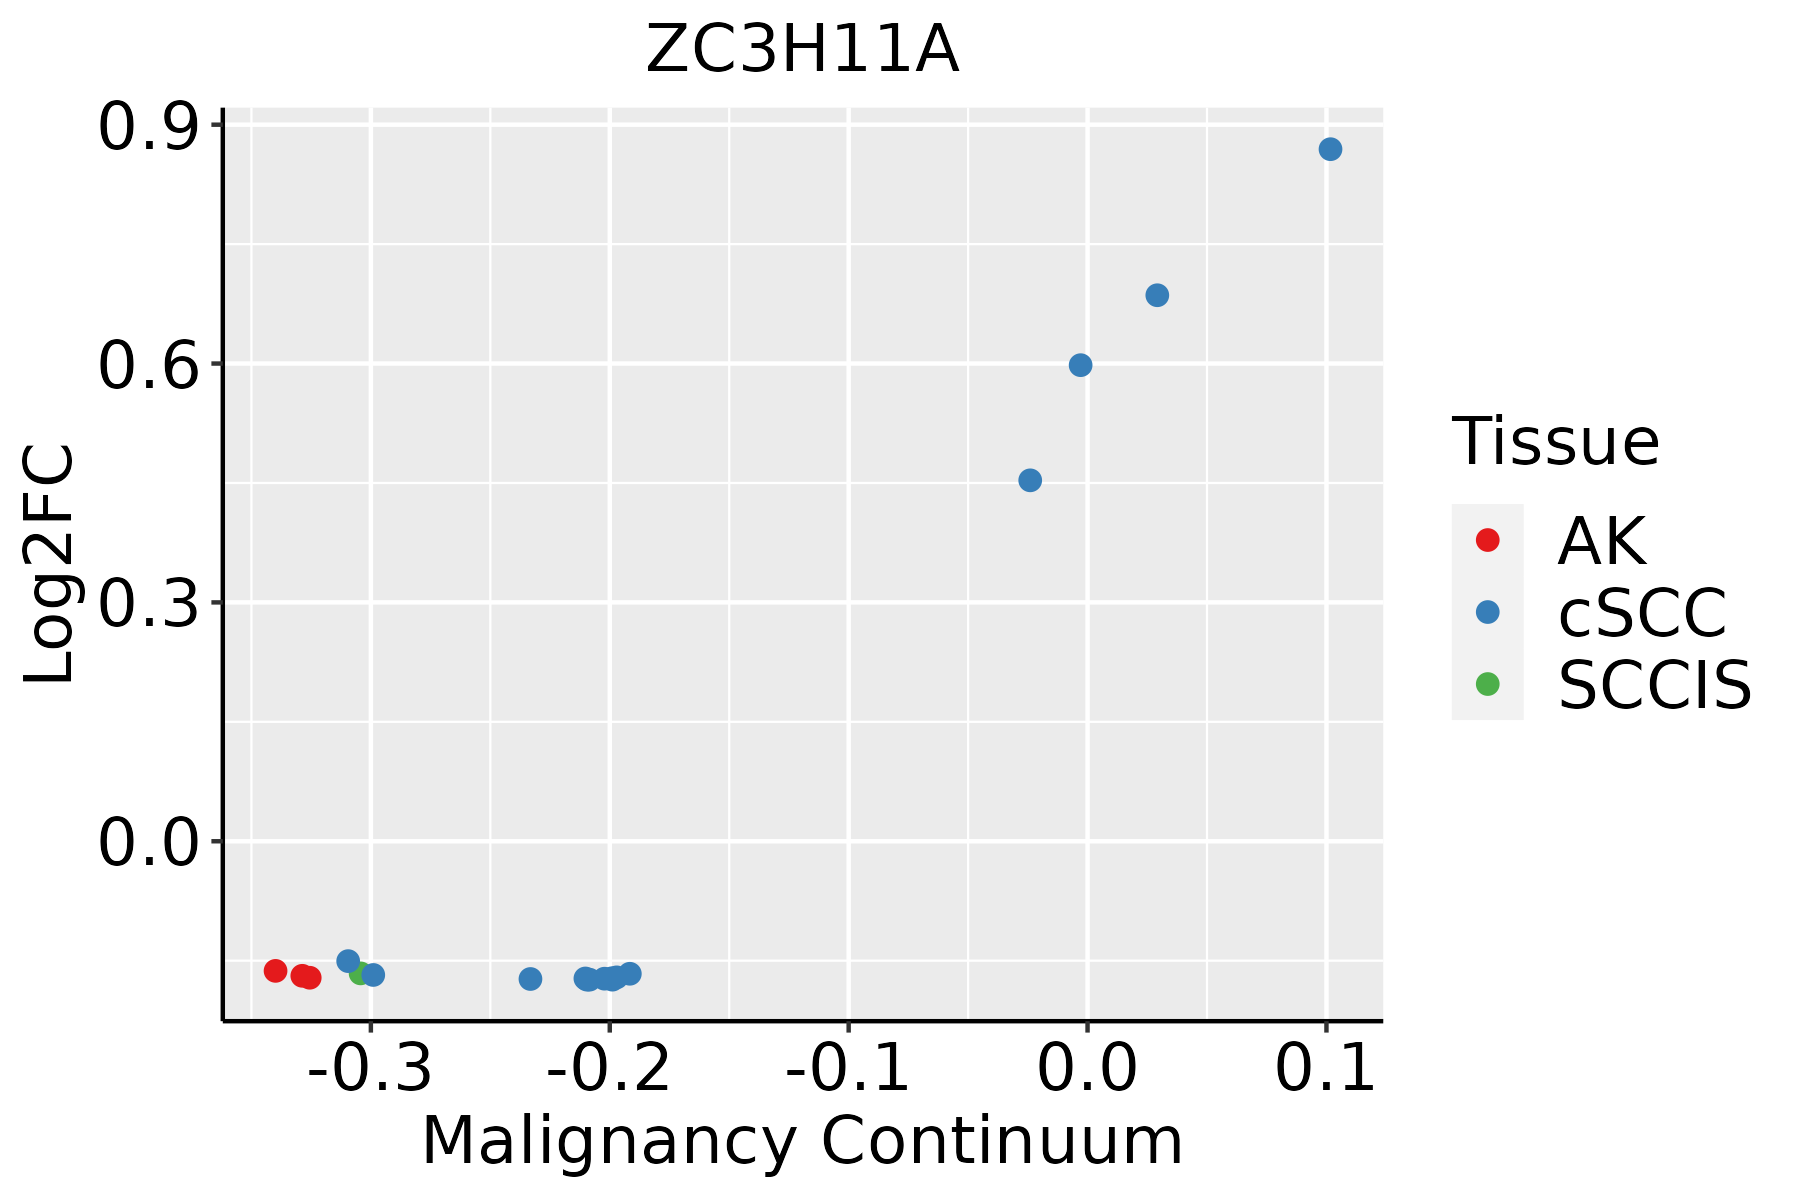 | AK: Actinic keratosis |
| cSCC: Cutaneous squamous cell carcinoma | ||
| SCCIS:squamous cell carcinoma in situ |
| ∗log2FC in expression of this searched gene in stem-like cells from each diseased tissue sample relative to stem-like cells in normal samples in each tissue plotted against the malignancy continuum. Samples are colored based on if they are from different disease stage. |
Top |
Malignant transformation related pathway analysis |
| Find out the enriched GO biological processes and KEGG pathways involved in transition from healthy to precancer to cancer |
| Tissue | Disease Stage | Enriched GO biological Processes |
| Colorectum | AD |  |
| Colorectum | SER |  |
| Colorectum | MSS |  |
| Colorectum | MSI-H |  |
| Colorectum | FAP |  |
| ∗Top 15 enriched GO BP terms are showed in the bar plot of each disease state in each tissue. Each row represents a significant GO biological process which is colored according to the -log10(p.adjust). |
| Page: 1 2 3 4 5 6 7 8 9 |
| GO ID | Tissue | Disease Stage | Description | Gene Ratio | Bg Ratio | pvalue | p.adjust | Count |
| GO:0006913 | Colorectum | AD | nucleocytoplasmic transport | 102/3918 | 301/18723 | 1.00e-07 | 4.85e-06 | 102 |
| GO:0051169 | Colorectum | AD | nuclear transport | 102/3918 | 301/18723 | 1.00e-07 | 4.85e-06 | 102 |
| GO:0006403 | Colorectum | AD | RNA localization | 71/3918 | 201/18723 | 1.54e-06 | 4.76e-05 | 71 |
| GO:0051236 | Colorectum | AD | establishment of RNA localization | 58/3918 | 166/18723 | 1.95e-05 | 4.01e-04 | 58 |
| GO:0015931 | Colorectum | AD | nucleobase-containing compound transport | 73/3918 | 222/18723 | 2.02e-05 | 4.10e-04 | 73 |
| GO:0050657 | Colorectum | AD | nucleic acid transport | 57/3918 | 163/18723 | 2.22e-05 | 4.39e-04 | 57 |
| GO:0050658 | Colorectum | AD | RNA transport | 57/3918 | 163/18723 | 2.22e-05 | 4.39e-04 | 57 |
| GO:0051168 | Colorectum | AD | nuclear export | 53/3918 | 154/18723 | 6.89e-05 | 1.11e-03 | 53 |
| GO:0051028 | Colorectum | AD | mRNA transport | 42/3918 | 130/18723 | 1.57e-03 | 1.32e-02 | 42 |
| GO:00069131 | Colorectum | SER | nucleocytoplasmic transport | 77/2897 | 301/18723 | 3.39e-06 | 1.32e-04 | 77 |
| GO:00511691 | Colorectum | SER | nuclear transport | 77/2897 | 301/18723 | 3.39e-06 | 1.32e-04 | 77 |
| GO:00064031 | Colorectum | SER | RNA localization | 53/2897 | 201/18723 | 4.51e-05 | 1.13e-03 | 53 |
| GO:00511681 | Colorectum | SER | nuclear export | 42/2897 | 154/18723 | 1.19e-04 | 2.46e-03 | 42 |
| GO:00159311 | Colorectum | SER | nucleobase-containing compound transport | 54/2897 | 222/18723 | 3.65e-04 | 5.67e-03 | 54 |
| GO:00512361 | Colorectum | SER | establishment of RNA localization | 42/2897 | 166/18723 | 6.70e-04 | 8.96e-03 | 42 |
| GO:00506571 | Colorectum | SER | nucleic acid transport | 41/2897 | 163/18723 | 8.74e-04 | 1.06e-02 | 41 |
| GO:00506581 | Colorectum | SER | RNA transport | 41/2897 | 163/18723 | 8.74e-04 | 1.06e-02 | 41 |
| GO:00069132 | Colorectum | MSS | nucleocytoplasmic transport | 99/3467 | 301/18723 | 1.35e-09 | 1.03e-07 | 99 |
| GO:00511692 | Colorectum | MSS | nuclear transport | 99/3467 | 301/18723 | 1.35e-09 | 1.03e-07 | 99 |
| GO:00064032 | Colorectum | MSS | RNA localization | 69/3467 | 201/18723 | 6.33e-08 | 3.26e-06 | 69 |
| Page: 1 2 3 4 5 6 7 8 9 10 |
| Pathway ID | Tissue | Disease Stage | Description | Gene Ratio | Bg Ratio | pvalue | p.adjust | qvalue | Count |
| Page: 1 |
Top |
Cell-cell communication analysis |
| Identification of potential cell-cell interactions between two cell types and their ligand-receptor pairs for different disease states |
| Ligand | Receptor | LRpair | Pathway | Tissue | Disease Stage |
| Page: 1 |
Top |
Single-cell gene regulatory network inference analysis |
| Find out the significant the regulons (TFs) and the target genes of each regulon across cell types for different disease states |
| TF | Cell Type | Tissue | Disease Stage | Target Gene | RSS | Regulon Activity |
| ZC3H11A | MSC | Breast | Precancer | GNB2L1,ATP5E,C19orf43, etc. | 2.55e-01 |  |
| ZC3H11A | PCV | Cervix | ADJ | ATP5E,GNB2L1,SELM, etc. | 1.24e-01 |  |
| ZC3H11A | CAF | Cervix | ADJ | ATP5E,GNB2L1,SELM, etc. | 6.58e-01 | |
| ZC3H11A | FIB | Cervix | CC | ATP5E,GNB2L1,SELM, etc. | 3.50e-02 |  |
| ZC3H11A | CAF | Cervix | CC | ATP5E,GNB2L1,SELM, etc. | 5.55e-02 | |
| ZC3H11A | PERI | Cervix | CC | ATP5E,GNB2L1,SELM, etc. | 1.39e-02 | |
| ZC3H11A | ICAF | Cervix | Healthy | ATP5E,GNB2L1,SELM, etc. | 0.00e+00 |  |
| ZC3H11A | ICAF | Cervix | N_HPV | ATP5E,GNB2L1,SELM, etc. | 5.35e-02 |  |
| ZC3H11A | TH1 | Lung | Healthy | DNAJC19,IFFO1,MYCBP2, etc. | 5.36e-03 |  |
| ZC3H11A | M1MAC | Pancreas | ADJ | GLTSCR2,TMEM66,C1orf63, etc. | 1.87e-01 |  |
| ∗The dot plots of a searched regulon are shown for all cell subpopulations in each disease state of each tissue based on the regulon specific score inferred using pySCENIC and by calculating the average expression. |
| Page: 1 2 3 |
Top |
Somatic mutation of malignant transformation related genes |
| Annotation of somatic variants for genes involved in malignant transformation |
| Hugo Symbol | Variant Class | Variant Classification | dbSNP RS | HGVSc | HGVSp | HGVSp Short | SWISSPROT | BIOTYPE | SIFT | PolyPhen | Tumor Sample Barcode | Tissue | Histology | Sex | Age | Stage | Therapy Types | Drugs | Outcome |
| ZC3H11A | SNV | Missense_Mutation | c.536N>T | p.Thr179Ile | p.T179I | protein_coding | deleterious(0.04) | probably_damaging(0.997) | TCGA-A1-A0SP-01 | Breast | breast invasive carcinoma | Female | <65 | I/II | Chemotherapy | SD | |||
| ZC3H11A | SNV | Missense_Mutation | c.514G>C | p.Glu172Gln | p.E172Q | protein_coding | deleterious(0) | probably_damaging(0.977) | TCGA-AC-A23H-01 | Breast | breast invasive carcinoma | Female | >=65 | I/II | Unknown | Unknown | PD | ||
| ZC3H11A | SNV | Missense_Mutation | rs772987481 | c.1744C>T | p.Arg582Trp | p.R582W | protein_coding | tolerated(0.13) | benign(0.001) | TCGA-AN-A046-01 | Breast | breast invasive carcinoma | Female | >=65 | I/II | Unknown | Unknown | SD | |
| ZC3H11A | SNV | Missense_Mutation | c.166G>C | p.Glu56Gln | p.E56Q | protein_coding | deleterious(0.01) | possibly_damaging(0.523) | TCGA-AN-A0FT-01 | Breast | breast invasive carcinoma | Female | <65 | I/II | Unknown | Unknown | SD | ||
| ZC3H11A | SNV | Missense_Mutation | c.1867N>A | p.Glu623Lys | p.E623K | protein_coding | deleterious(0.02) | benign(0.331) | TCGA-AR-A1AS-01 | Breast | breast invasive carcinoma | Female | <65 | I/II | Chemotherapy | doxorubicin | SD | ||
| ZC3H11A | SNV | Missense_Mutation | novel | c.1013N>T | p.Ser338Leu | p.S338L | protein_coding | tolerated(0.05) | benign(0) | TCGA-AR-A2LE-01 | Breast | breast invasive carcinoma | Female | >=65 | I/II | Hormone Therapy | tamoxiphen | PD | |
| ZC3H11A | SNV | Missense_Mutation | c.2240C>T | p.Ser747Leu | p.S747L | protein_coding | deleterious(0.05) | probably_damaging(0.988) | TCGA-BH-A0BZ-01 | Breast | breast invasive carcinoma | Female | <65 | III/IV | Chemotherapy | doxorubicin | CR | ||
| ZC3H11A | SNV | Missense_Mutation | c.65N>A | p.Cys22Tyr | p.C22Y | protein_coding | deleterious(0) | probably_damaging(1) | TCGA-C8-A134-01 | Breast | breast invasive carcinoma | Female | <65 | I/II | Chemotherapy | 5-fluorouracil | CR | ||
| ZC3H11A | SNV | Missense_Mutation | c.493G>C | p.Asp165His | p.D165H | protein_coding | deleterious(0) | probably_damaging(1) | TCGA-C8-A26Y-01 | Breast | breast invasive carcinoma | Female | >=65 | I/II | Unknown | Unknown | SD | ||
| ZC3H11A | SNV | Missense_Mutation | c.22N>C | p.Cys8Arg | p.C8R | protein_coding | deleterious(0) | probably_damaging(1) | TCGA-D8-A1XK-01 | Breast | breast invasive carcinoma | Female | <65 | I/II | Chemotherapy | doxorubicine+cyclophosphamide | SD |
| Page: 1 2 3 4 5 6 7 8 9 |
Top |
Related drugs of malignant transformation related genes |
| Identification of chemicals and drugs interact with genes involved in malignant transfromation |
| (DGIdb 4.0) |
| Entrez ID | Symbol | Category | Interaction Types | Drug Claim Name | Drug Name | PMIDs |
| Page: 1 |

Copyright 2023-Present -The University of Texas Health Science Center at Houston |