
|
|||||
|
 | |
| |
| |
| |
| |
| |
|
Gene: ZBTB33 |
Gene summary for ZBTB33 |
| Gene information | Species | Human | Gene symbol | ZBTB33 | Gene ID | 10009 |
| Gene name | zinc finger and BTB domain containing 33 | |
| Gene Alias | ZNF-kaiso | |
| Cytomap | Xq24 | |
| Gene Type | protein-coding | GO ID | GO:0000122 | UniProtAcc | Q86T24 |
Top |
Malignant transformation analysis |
| Identification of the aberrant gene expression in precancerous and cancerous lesions by comparing the gene expression of stem-like cells in diseased tissues with normal stem cells |
| Entrez ID | Symbol | Replicates | Species | Organ | Tissue | Adj P-value | Log2FC | Malignancy |
| 10009 | ZBTB33 | P30T-E | Human | Esophagus | ESCC | 1.98e-04 | 1.51e-01 | 0.137 |
| 10009 | ZBTB33 | P31T-E | Human | Esophagus | ESCC | 9.00e-08 | 6.10e-02 | 0.1251 |
| 10009 | ZBTB33 | P32T-E | Human | Esophagus | ESCC | 1.21e-05 | 9.50e-02 | 0.1666 |
| 10009 | ZBTB33 | P36T-E | Human | Esophagus | ESCC | 6.02e-08 | 2.23e-01 | 0.1187 |
| 10009 | ZBTB33 | P37T-E | Human | Esophagus | ESCC | 4.98e-08 | 1.21e-01 | 0.1371 |
| 10009 | ZBTB33 | P39T-E | Human | Esophagus | ESCC | 8.02e-06 | 3.86e-02 | 0.0894 |
| 10009 | ZBTB33 | P42T-E | Human | Esophagus | ESCC | 2.14e-05 | 1.07e-01 | 0.1175 |
| 10009 | ZBTB33 | P44T-E | Human | Esophagus | ESCC | 6.32e-03 | 6.01e-02 | 0.1096 |
| 10009 | ZBTB33 | P47T-E | Human | Esophagus | ESCC | 6.05e-04 | 8.24e-02 | 0.1067 |
| 10009 | ZBTB33 | P48T-E | Human | Esophagus | ESCC | 1.53e-09 | 9.47e-02 | 0.0959 |
| 10009 | ZBTB33 | P49T-E | Human | Esophagus | ESCC | 1.98e-06 | 5.70e-01 | 0.1768 |
| 10009 | ZBTB33 | P52T-E | Human | Esophagus | ESCC | 2.52e-10 | 1.11e-01 | 0.1555 |
| 10009 | ZBTB33 | P56T-E | Human | Esophagus | ESCC | 4.24e-06 | 5.93e-01 | 0.1613 |
| 10009 | ZBTB33 | P57T-E | Human | Esophagus | ESCC | 2.47e-02 | 8.94e-02 | 0.0926 |
| 10009 | ZBTB33 | P61T-E | Human | Esophagus | ESCC | 5.25e-11 | 1.28e-01 | 0.099 |
| 10009 | ZBTB33 | P62T-E | Human | Esophagus | ESCC | 1.91e-06 | 8.17e-02 | 0.1302 |
| 10009 | ZBTB33 | P65T-E | Human | Esophagus | ESCC | 1.06e-02 | 5.73e-02 | 0.0978 |
| 10009 | ZBTB33 | P74T-E | Human | Esophagus | ESCC | 1.41e-06 | 1.98e-01 | 0.1479 |
| 10009 | ZBTB33 | P75T-E | Human | Esophagus | ESCC | 3.66e-12 | 1.18e-01 | 0.1125 |
| 10009 | ZBTB33 | P76T-E | Human | Esophagus | ESCC | 5.79e-03 | 1.35e-02 | 0.1207 |
| Page: 1 2 3 4 |
| Tissue | Expression Dynamics | Abbreviation |
| Esophagus | 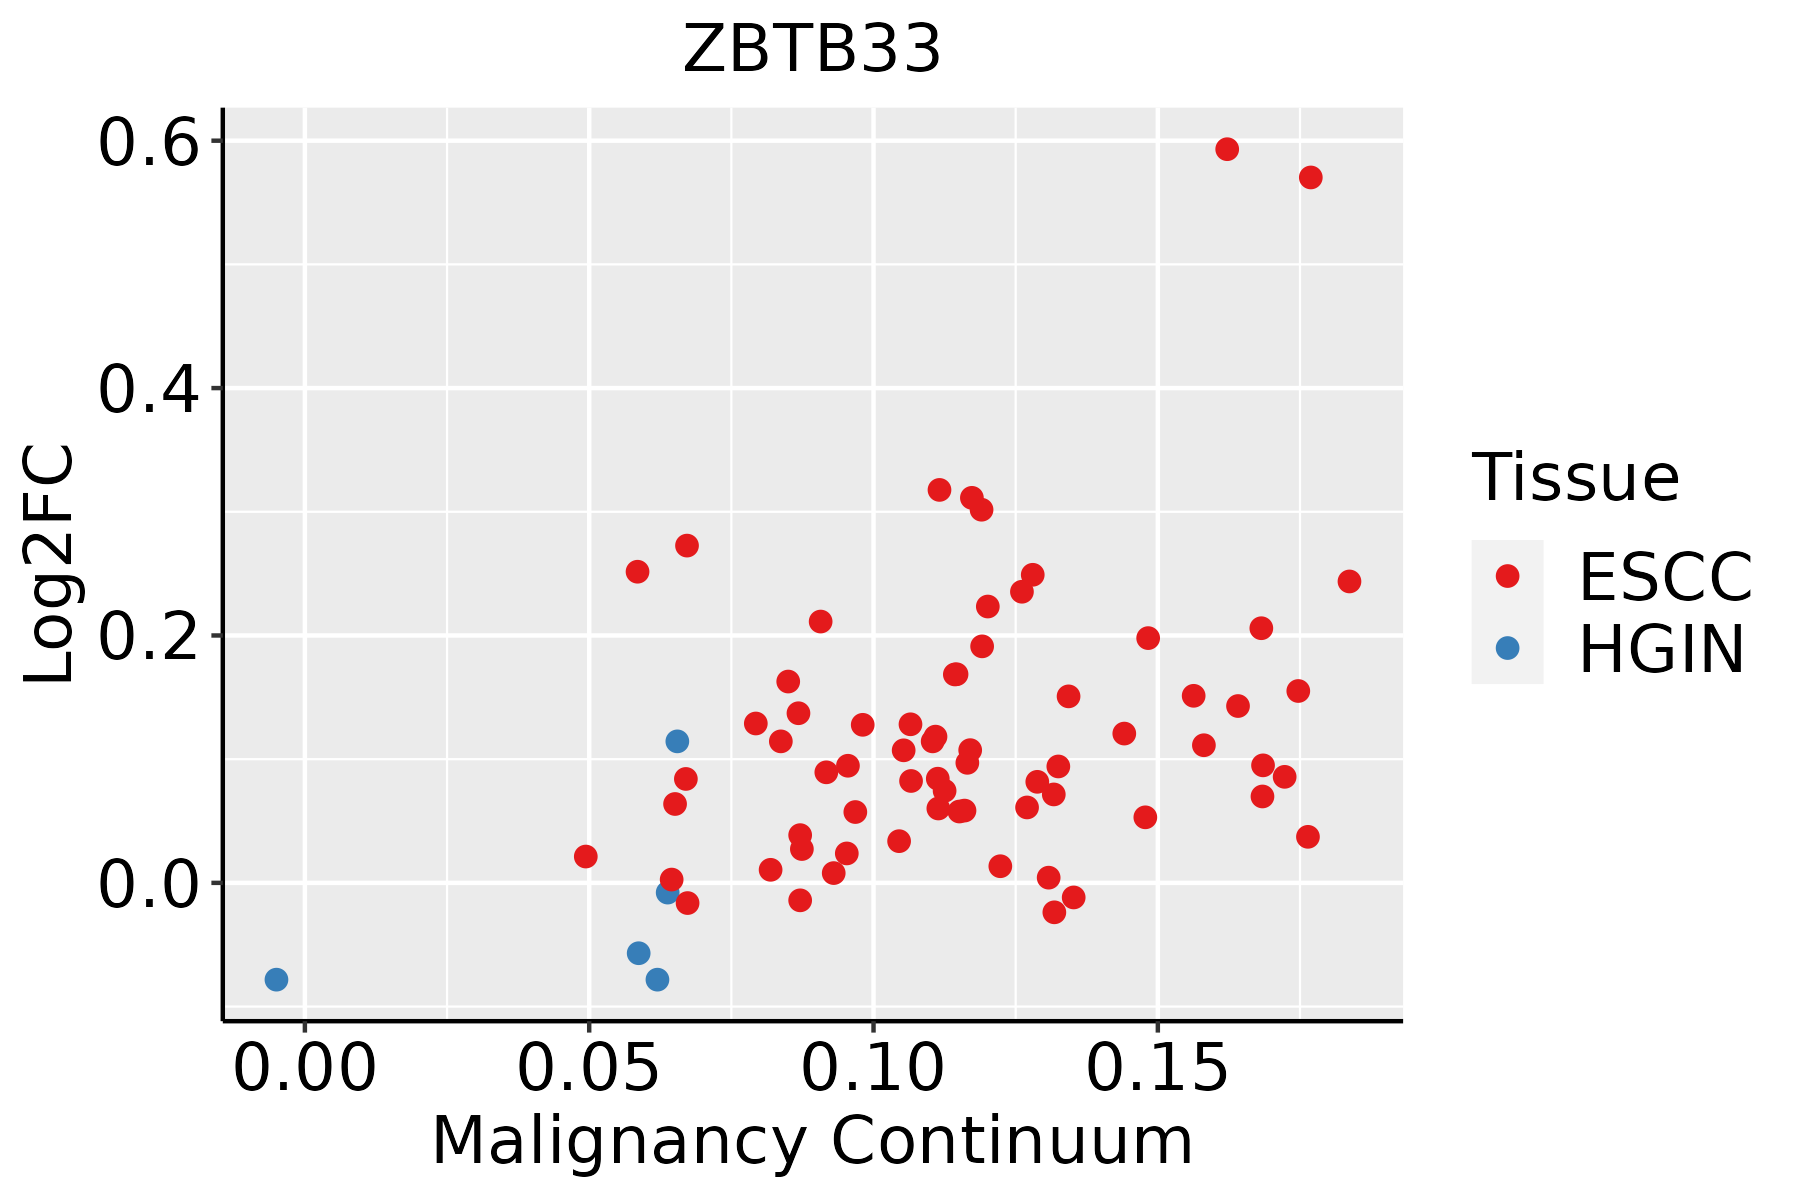 | ESCC: Esophageal squamous cell carcinoma |
| HGIN: High-grade intraepithelial neoplasias | ||
| LGIN: Low-grade intraepithelial neoplasias | ||
| Liver | 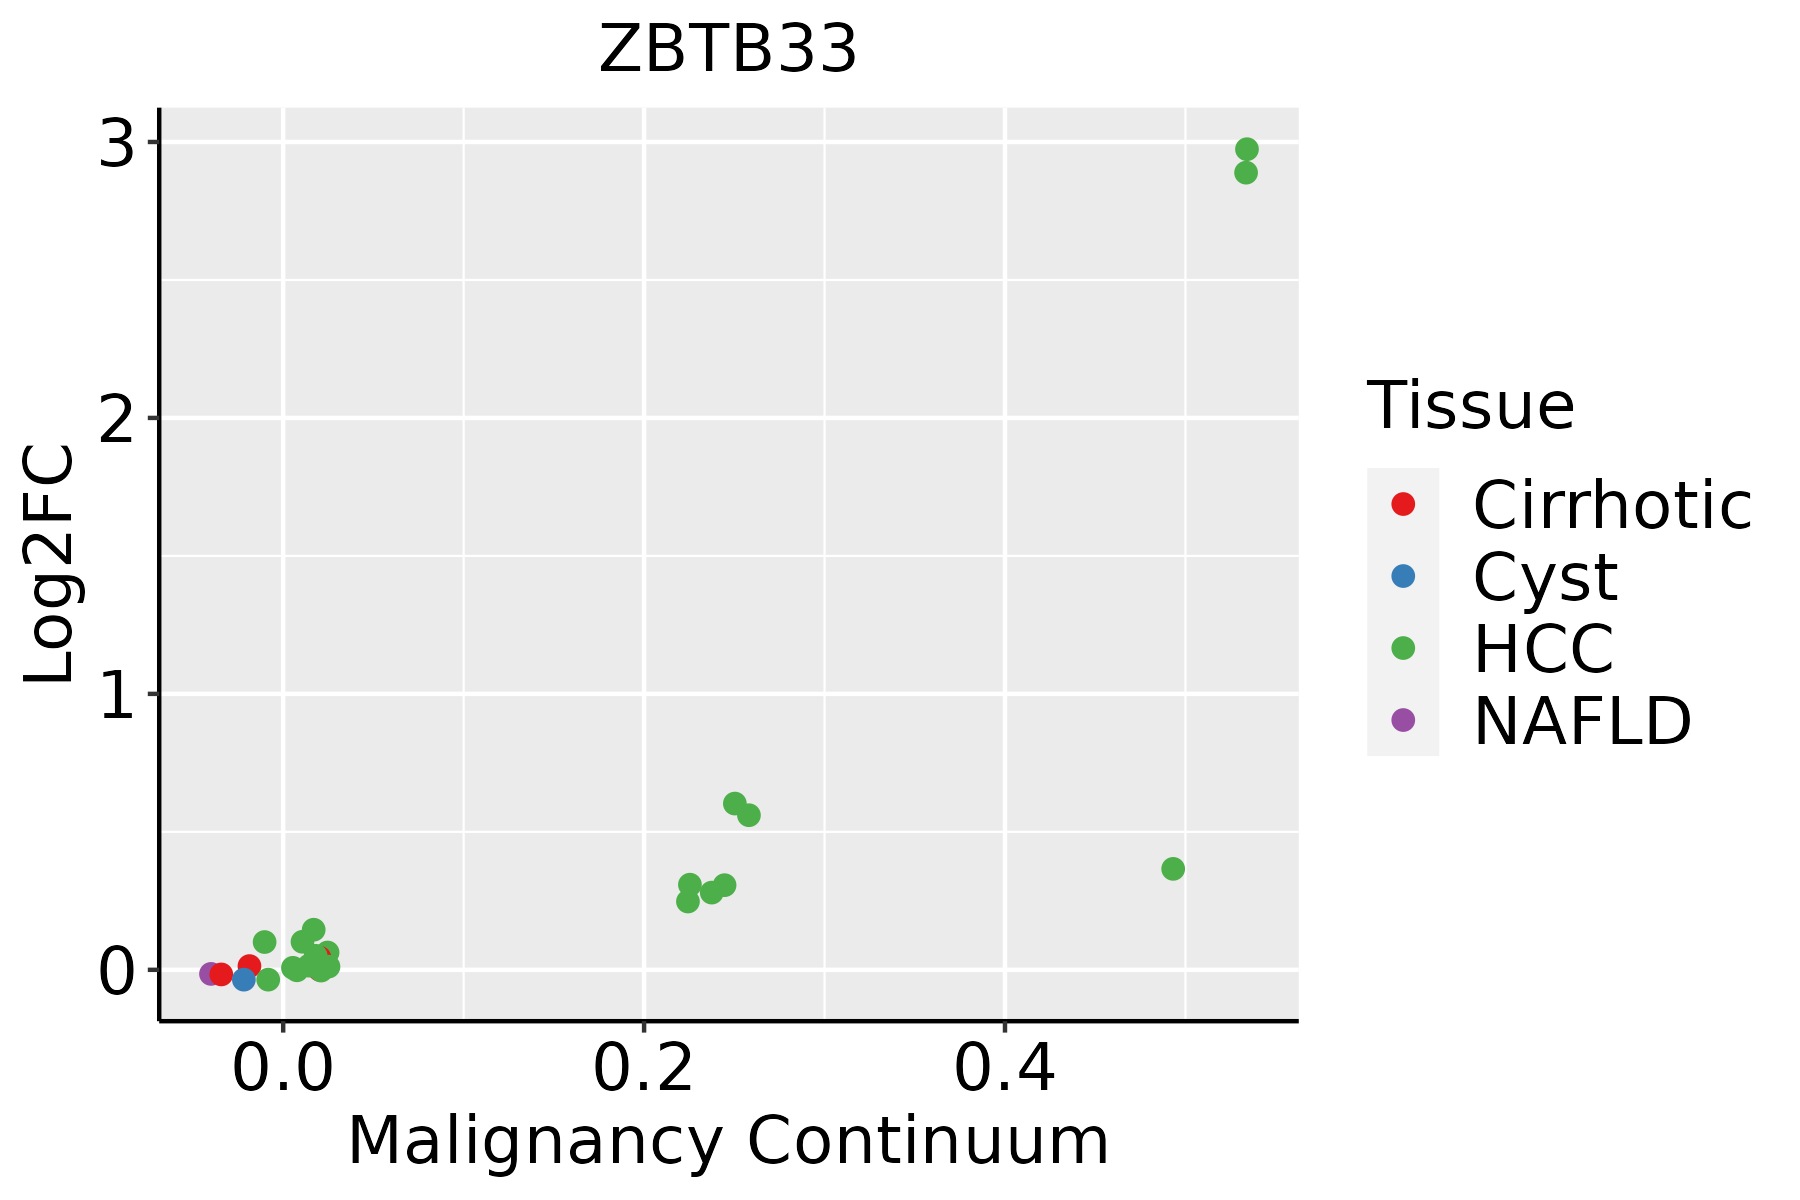 | HCC: Hepatocellular carcinoma |
| NAFLD: Non-alcoholic fatty liver disease | ||
| Prostate |  | BPH: Benign Prostatic Hyperplasia |
| ∗log2FC in expression of this searched gene in stem-like cells from each diseased tissue sample relative to stem-like cells in normal samples in each tissue plotted against the malignancy continuum. Samples are colored based on if they are from different disease stage. |
Top |
Malignant transformation related pathway analysis |
| Find out the enriched GO biological processes and KEGG pathways involved in transition from healthy to precancer to cancer |
| Tissue | Disease Stage | Enriched GO biological Processes |
| Colorectum | AD |  |
| Colorectum | SER |  |
| Colorectum | MSS |  |
| Colorectum | MSI-H |  |
| Colorectum | FAP |  |
| ∗Top 15 enriched GO BP terms are showed in the bar plot of each disease state in each tissue. Each row represents a significant GO biological process which is colored according to the -log10(p.adjust). |
| Page: 1 2 3 4 5 6 7 8 9 |
| GO ID | Tissue | Disease Stage | Description | Gene Ratio | Bg Ratio | pvalue | p.adjust | Count |
| GO:001605517 | Esophagus | ESCC | Wnt signaling pathway | 268/8552 | 444/18723 | 2.32e-10 | 6.58e-09 | 268 |
| GO:019873817 | Esophagus | ESCC | cell-cell signaling by wnt | 269/8552 | 446/18723 | 2.41e-10 | 6.79e-09 | 269 |
| GO:019873821 | Liver | HCC | cell-cell signaling by wnt | 247/7958 | 446/18723 | 2.11e-08 | 4.96e-07 | 247 |
| GO:001605521 | Liver | HCC | Wnt signaling pathway | 245/7958 | 444/18723 | 3.68e-08 | 8.09e-07 | 245 |
| GO:001605514 | Prostate | Tumor | Wnt signaling pathway | 131/3246 | 444/18723 | 1.16e-10 | 7.11e-09 | 131 |
| GO:019873814 | Prostate | Tumor | cell-cell signaling by wnt | 131/3246 | 446/18723 | 1.61e-10 | 9.69e-09 | 131 |
| Page: 1 |
| Pathway ID | Tissue | Disease Stage | Description | Gene Ratio | Bg Ratio | pvalue | p.adjust | qvalue | Count |
| Page: 1 |
Top |
Cell-cell communication analysis |
| Identification of potential cell-cell interactions between two cell types and their ligand-receptor pairs for different disease states |
| Ligand | Receptor | LRpair | Pathway | Tissue | Disease Stage |
| Page: 1 |
Top |
Single-cell gene regulatory network inference analysis |
| Find out the significant the regulons (TFs) and the target genes of each regulon across cell types for different disease states |
| TF | Cell Type | Tissue | Disease Stage | Target Gene | RSS | Regulon Activity |
| ZBTB33 | BN | Liver | Cirrhotic | CLIC3,CASP9,THOC3, etc. | 9.45e-02 |  |
| ZBTB33 | CD8TEREX | Liver | Healthy | CLIC3,CASP9,THOC3, etc. | 9.83e-03 |  |
| ZBTB33 | PVA | Oral cavity | ADJ | STC1,APLNR,VPS33A, etc. | 1.51e-01 |  |
| ZBTB33 | M1MAC | Prostate | ADJ | VPRBP,ULBP2,ZDBF2, etc. | 8.51e-02 |  |
| ZBTB33 | CD8TCM | Prostate | Tumor | VPRBP,ULBP2,ZDBF2, etc. | 1.61e-01 |  |
| ZBTB33 | M1MAC | Prostate | Tumor | VPRBP,ULBP2,ZDBF2, etc. | 3.17e-02 | |
| ZBTB33 | CYC | Skin | ADJ | POSTN,CEMIP,C1QTNF12, etc. | 0.00e+00 |  |
| ZBTB33 | GOB | Stomach | ADJ | PRKCDBP,PCDH9,VPS13C, etc. | 0.00e+00 |  |
| ZBTB33 | MESC | Stomach | WIM | PRKCDBP,PCDH9,VPS13C, etc. | 2.20e-02 |  |
| ∗The dot plots of a searched regulon are shown for all cell subpopulations in each disease state of each tissue based on the regulon specific score inferred using pySCENIC and by calculating the average expression. |
| Page: 1 |
Top |
Somatic mutation of malignant transformation related genes |
| Annotation of somatic variants for genes involved in malignant transformation |
| Hugo Symbol | Variant Class | Variant Classification | dbSNP RS | HGVSc | HGVSp | HGVSp Short | SWISSPROT | BIOTYPE | SIFT | PolyPhen | Tumor Sample Barcode | Tissue | Histology | Sex | Age | Stage | Therapy Types | Drugs | Outcome |
| ZBTB33 | SNV | Missense_Mutation | novel | c.1009N>A | p.Asp337Asn | p.D337N | Q86T24 | protein_coding | tolerated(0.18) | possibly_damaging(0.578) | TCGA-AC-A3W6-01 | Breast | breast invasive carcinoma | Female | >=65 | III/IV | Unknown | Unknown | SD |
| ZBTB33 | SNV | Missense_Mutation | c.1673C>A | p.Ser558Tyr | p.S558Y | Q86T24 | protein_coding | deleterious(0.03) | probably_damaging(0.936) | TCGA-AN-A046-01 | Breast | breast invasive carcinoma | Female | >=65 | I/II | Unknown | Unknown | SD | |
| ZBTB33 | SNV | Missense_Mutation | rs782498946 | c.1905C>A | p.Asn635Lys | p.N635K | Q86T24 | protein_coding | tolerated(0.47) | benign(0.026) | TCGA-AN-A0G0-01 | Breast | breast invasive carcinoma | Female | <65 | I/II | Unknown | Unknown | SD |
| ZBTB33 | SNV | Missense_Mutation | rs782703763 | c.1610G>A | p.Arg537His | p.R537H | Q86T24 | protein_coding | deleterious(0) | probably_damaging(0.999) | TCGA-LL-A740-01 | Breast | breast invasive carcinoma | Female | <65 | I/II | Chemotherapy | adriamycin | CR |
| ZBTB33 | insertion | Frame_Shift_Ins | novel | c.760_761insTGTTACCGTT | p.Asn254MetfsTer15 | p.N254Mfs*15 | Q86T24 | protein_coding | TCGA-A2-A0CX-01 | Breast | breast invasive carcinoma | Female | <65 | I/II | Chemotherapy | adriamycin | SD | ||
| ZBTB33 | insertion | Frame_Shift_Ins | novel | c.762_763insTGTGGAAGAC | p.Gln255CysfsTer14 | p.Q255Cfs*14 | Q86T24 | protein_coding | TCGA-A2-A0CX-01 | Breast | breast invasive carcinoma | Female | <65 | I/II | Chemotherapy | adriamycin | SD | ||
| ZBTB33 | insertion | Frame_Shift_Ins | novel | c.2014_2015insTA | p.Tyr672LeufsTer6 | p.Y672Lfs*6 | Q86T24 | protein_coding | TCGA-AR-A1AQ-01 | Breast | breast invasive carcinoma | Female | <65 | I/II | Chemotherapy | doxorubicin | SD | ||
| ZBTB33 | SNV | Missense_Mutation | rs376833183 | c.526N>A | p.Glu176Lys | p.E176K | Q86T24 | protein_coding | tolerated(0.1) | benign(0.335) | TCGA-C5-A7X5-01 | Cervix | cervical & endocervical cancer | Female | >=65 | I/II | Chemotherapy | carboplatin | PD |
| ZBTB33 | SNV | Missense_Mutation | c.1673C>T | p.Ser558Phe | p.S558F | Q86T24 | protein_coding | deleterious(0.05) | possibly_damaging(0.908) | TCGA-FU-A40J-01 | Cervix | cervical & endocervical cancer | Female | <65 | III/IV | Chemotherapy | carboplatin | CR | |
| ZBTB33 | SNV | Missense_Mutation | c.1634N>T | p.Thr545Ile | p.T545I | Q86T24 | protein_coding | deleterious(0) | probably_damaging(0.999) | TCGA-Q1-A6DT-01 | Cervix | cervical & endocervical cancer | Female | <65 | I/II | Unknown | Unknown | PD |
| Page: 1 2 3 4 5 6 7 8 9 |
Top |
Related drugs of malignant transformation related genes |
| Identification of chemicals and drugs interact with genes involved in malignant transfromation |
| (DGIdb 4.0) |
| Entrez ID | Symbol | Category | Interaction Types | Drug Claim Name | Drug Name | PMIDs |
| Page: 1 |

Copyright 2023-Present -The University of Texas Health Science Center at Houston |