
|
|||||
|
 | |
| |
| |
| |
| |
| |
|
Gene: ZBED1 |
Gene summary for ZBED1 |
| Gene information | Species | Human | Gene symbol | ZBED1 | Gene ID | 9189 |
| Gene name | zinc finger BED-type containing 1 | |
| Gene Alias | ALTE | |
| Cytomap | X | |
| Gene Type | protein-coding | GO ID | GO:0006139 | UniProtAcc | A0A024RBU4 |
Top |
Malignant transformation analysis |
| Identification of the aberrant gene expression in precancerous and cancerous lesions by comparing the gene expression of stem-like cells in diseased tissues with normal stem cells |
| Entrez ID | Symbol | Replicates | Species | Organ | Tissue | Adj P-value | Log2FC | Malignancy |
| 9189 | ZBED1 | HTA11_9408_2000001011 | Human | Colorectum | AD | 6.03e-05 | 3.39e-01 | 0.0451 |
| 9189 | ZBED1 | HTA11_8622_2000001021 | Human | Colorectum | SER | 6.14e-04 | 2.26e-01 | 0.0528 |
| 9189 | ZBED1 | HTA11_7663_2000001011 | Human | Colorectum | SER | 6.05e-12 | 4.99e-01 | 0.0131 |
| 9189 | ZBED1 | HTA11_10623_2000001011 | Human | Colorectum | AD | 6.46e-07 | 3.17e-01 | -0.0177 |
| 9189 | ZBED1 | HTA11_6801_2000001011 | Human | Colorectum | SER | 1.64e-05 | 3.58e-01 | 0.0171 |
| 9189 | ZBED1 | HTA11_10711_2000001011 | Human | Colorectum | AD | 1.10e-12 | 3.79e-01 | 0.0338 |
| 9189 | ZBED1 | HTA11_7696_3000711011 | Human | Colorectum | AD | 1.12e-26 | 4.86e-01 | 0.0674 |
| 9189 | ZBED1 | HTA11_6818_2000001011 | Human | Colorectum | AD | 7.64e-12 | 4.42e-01 | 0.0112 |
| 9189 | ZBED1 | HTA11_7469_2000001011 | Human | Colorectum | AD | 8.43e-06 | 4.15e-01 | -0.0124 |
| 9189 | ZBED1 | HTA11_6818_2000001021 | Human | Colorectum | AD | 6.94e-12 | 3.55e-01 | 0.0588 |
| 9189 | ZBED1 | HTA11_99999970781_79442 | Human | Colorectum | MSS | 1.09e-16 | 2.99e-01 | 0.294 |
| 9189 | ZBED1 | HTA11_99999965062_69753 | Human | Colorectum | MSI-H | 1.89e-11 | 7.66e-01 | 0.3487 |
| 9189 | ZBED1 | HTA11_99999965104_69814 | Human | Colorectum | MSS | 6.03e-08 | 2.88e-01 | 0.281 |
| 9189 | ZBED1 | HTA11_99999971662_82457 | Human | Colorectum | MSS | 3.23e-39 | 7.36e-01 | 0.3859 |
| 9189 | ZBED1 | HTA11_99999973899_84307 | Human | Colorectum | MSS | 1.05e-12 | 3.86e-01 | 0.2585 |
| 9189 | ZBED1 | HTA11_99999974143_84620 | Human | Colorectum | MSS | 1.15e-20 | 3.96e-01 | 0.3005 |
| 9189 | ZBED1 | LZE4T | Human | Esophagus | ESCC | 1.16e-03 | 1.38e-01 | 0.0811 |
| 9189 | ZBED1 | LZE8T | Human | Esophagus | ESCC | 1.30e-03 | 1.11e-01 | 0.067 |
| 9189 | ZBED1 | LZE21T | Human | Esophagus | ESCC | 1.54e-02 | 1.37e-01 | 0.0655 |
| 9189 | ZBED1 | P1T-E | Human | Esophagus | ESCC | 1.13e-11 | 3.70e-01 | 0.0875 |
| Page: 1 2 3 4 5 6 |
| Tissue | Expression Dynamics | Abbreviation |
| Colorectum (GSE201348) |  | FAP: Familial adenomatous polyposis |
| CRC: Colorectal cancer | ||
| Colorectum (HTA11) |  | AD: Adenomas |
| SER: Sessile serrated lesions | ||
| MSI-H: Microsatellite-high colorectal cancer | ||
| MSS: Microsatellite stable colorectal cancer | ||
| Esophagus |  | ESCC: Esophageal squamous cell carcinoma |
| HGIN: High-grade intraepithelial neoplasias | ||
| LGIN: Low-grade intraepithelial neoplasias | ||
| Liver | 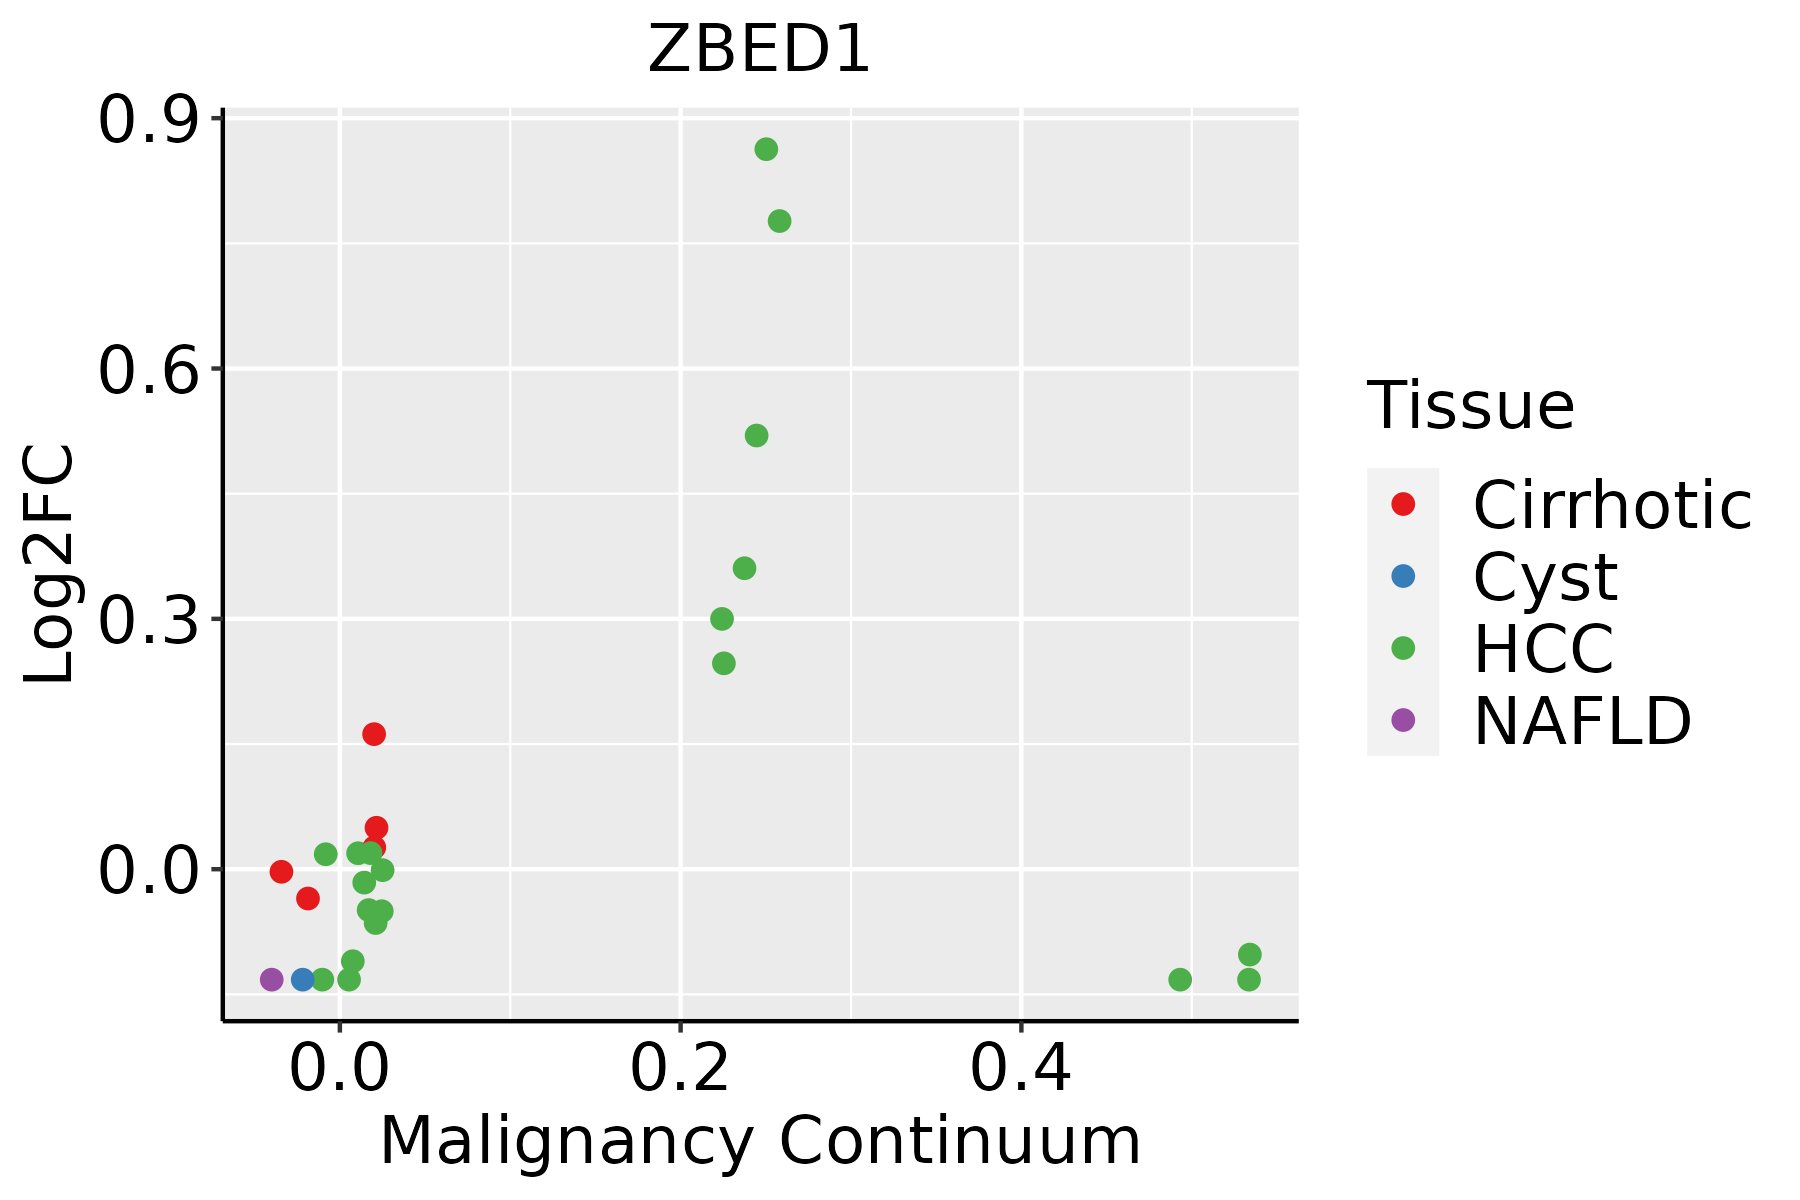 | HCC: Hepatocellular carcinoma |
| NAFLD: Non-alcoholic fatty liver disease | ||
| Oral Cavity | 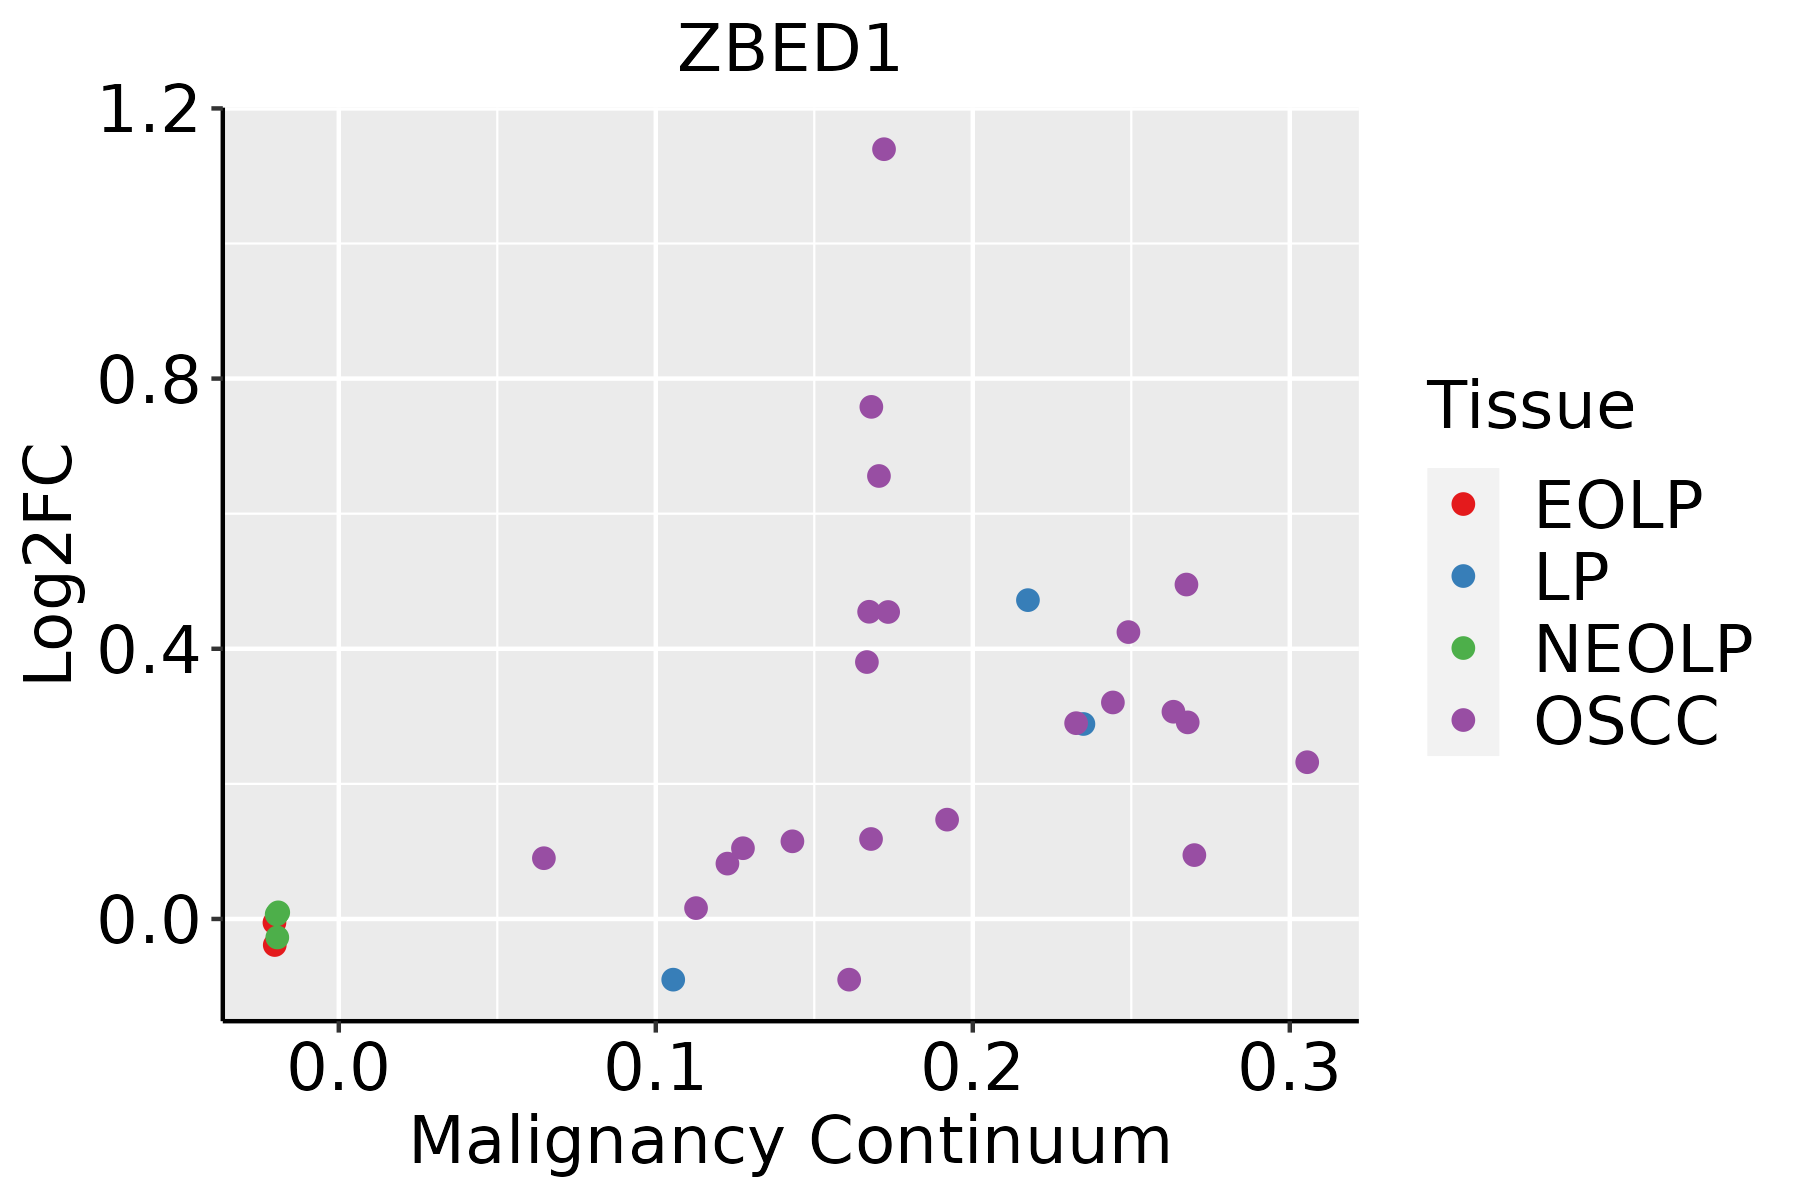 | EOLP: Erosive Oral lichen planus |
| LP: leukoplakia | ||
| NEOLP: Non-erosive oral lichen planus | ||
| OSCC: Oral squamous cell carcinoma |
| ∗log2FC in expression of this searched gene in stem-like cells from each diseased tissue sample relative to stem-like cells in normal samples in each tissue plotted against the malignancy continuum. Samples are colored based on if they are from different disease stage. |
Top |
Malignant transformation related pathway analysis |
| Find out the enriched GO biological processes and KEGG pathways involved in transition from healthy to precancer to cancer |
| Tissue | Disease Stage | Enriched GO biological Processes |
| Colorectum | AD |  |
| Colorectum | SER |  |
| Colorectum | MSS |  |
| Colorectum | MSI-H |  |
| Colorectum | FAP |  |
| ∗Top 15 enriched GO BP terms are showed in the bar plot of each disease state in each tissue. Each row represents a significant GO biological process which is colored according to the -log10(p.adjust). |
| Page: 1 2 3 4 5 6 7 8 9 |
| GO ID | Tissue | Disease Stage | Description | Gene Ratio | Bg Ratio | pvalue | p.adjust | Count |
| GO:0016032 | Colorectum | AD | viral process | 168/3918 | 415/18723 | 4.67e-20 | 3.66e-17 | 168 |
| GO:0019058 | Colorectum | AD | viral life cycle | 119/3918 | 317/18723 | 6.18e-12 | 8.23e-10 | 119 |
| GO:0044403 | Colorectum | AD | biological process involved in symbiotic interaction | 99/3918 | 290/18723 | 1.02e-07 | 4.93e-06 | 99 |
| GO:0019079 | Colorectum | AD | viral genome replication | 51/3918 | 131/18723 | 1.83e-06 | 5.51e-05 | 51 |
| GO:0035821 | Colorectum | AD | modulation of process of other organism | 34/3918 | 106/18723 | 4.73e-03 | 3.22e-02 | 34 |
| GO:00160321 | Colorectum | SER | viral process | 118/2897 | 415/18723 | 8.36e-12 | 1.65e-09 | 118 |
| GO:00190581 | Colorectum | SER | viral life cycle | 87/2897 | 317/18723 | 2.82e-08 | 1.94e-06 | 87 |
| GO:00444031 | Colorectum | SER | biological process involved in symbiotic interaction | 72/2897 | 290/18723 | 2.08e-05 | 6.02e-04 | 72 |
| GO:00190791 | Colorectum | SER | viral genome replication | 37/2897 | 131/18723 | 1.36e-04 | 2.72e-03 | 37 |
| GO:00160322 | Colorectum | MSS | viral process | 157/3467 | 415/18723 | 7.94e-21 | 6.19e-18 | 157 |
| GO:00190582 | Colorectum | MSS | viral life cycle | 111/3467 | 317/18723 | 1.65e-12 | 2.95e-10 | 111 |
| GO:00444032 | Colorectum | MSS | biological process involved in symbiotic interaction | 93/3467 | 290/18723 | 1.72e-08 | 9.85e-07 | 93 |
| GO:00190792 | Colorectum | MSS | viral genome replication | 49/3467 | 131/18723 | 2.73e-07 | 1.11e-05 | 49 |
| GO:00358211 | Colorectum | MSS | modulation of process of other organism | 33/3467 | 106/18723 | 1.18e-03 | 1.14e-02 | 33 |
| GO:00160323 | Colorectum | MSI-H | viral process | 74/1319 | 415/18723 | 8.87e-14 | 2.05e-11 | 74 |
| GO:00190583 | Colorectum | MSI-H | viral life cycle | 53/1319 | 317/18723 | 3.27e-09 | 4.32e-07 | 53 |
| GO:00190793 | Colorectum | MSI-H | viral genome replication | 29/1319 | 131/18723 | 2.57e-08 | 2.80e-06 | 29 |
| GO:00444033 | Colorectum | MSI-H | biological process involved in symbiotic interaction | 41/1319 | 290/18723 | 1.53e-05 | 6.62e-04 | 41 |
| GO:0016032111 | Esophagus | ESCC | viral process | 301/8552 | 415/18723 | 3.34e-29 | 1.32e-26 | 301 |
| GO:0019058111 | Esophagus | ESCC | viral life cycle | 226/8552 | 317/18723 | 1.17e-20 | 1.76e-18 | 226 |
| Page: 1 2 3 4 |
| Pathway ID | Tissue | Disease Stage | Description | Gene Ratio | Bg Ratio | pvalue | p.adjust | qvalue | Count |
| Page: 1 |
Top |
Cell-cell communication analysis |
| Identification of potential cell-cell interactions between two cell types and their ligand-receptor pairs for different disease states |
| Ligand | Receptor | LRpair | Pathway | Tissue | Disease Stage |
| Page: 1 |
Top |
Single-cell gene regulatory network inference analysis |
| Find out the significant the regulons (TFs) and the target genes of each regulon across cell types for different disease states |
| TF | Cell Type | Tissue | Disease Stage | Target Gene | RSS | Regulon Activity |
| ZBED1 | INMON | Breast | ADJ | AL365361.1,PTK2,MLH1, etc. | 5.85e-02 |  |
| ZBED1 | HSC | Liver | Cirrhotic | RARRES2,PLAU,PCDH18, etc. | 4.18e-01 |  |
| ZBED1 | HSC | Liver | HCC | RARRES2,PLAU,PCDH18, etc. | 1.76e-01 |  |
| ZBED1 | CD4TN | Stomach | ADJ | KRT86,ARL4D,IFI6, etc. | 1.10e-01 |  |
| ZBED1 | MON | Stomach | ADJ | KRT86,ARL4D,IFI6, etc. | 8.67e-03 | |
| ZBED1 | MON | Stomach | GC | KRT86,ARL4D,IFI6, etc. | 2.12e-02 |  |
| ZBED1 | MON | Stomach | SIM | KRT86,ARL4D,IFI6, etc. | 2.36e-02 |  |
| ∗The dot plots of a searched regulon are shown for all cell subpopulations in each disease state of each tissue based on the regulon specific score inferred using pySCENIC and by calculating the average expression. |
| Page: 1 |
Top |
Somatic mutation of malignant transformation related genes |
| Annotation of somatic variants for genes involved in malignant transformation |
| Hugo Symbol | Variant Class | Variant Classification | dbSNP RS | HGVSc | HGVSp | HGVSp Short | SWISSPROT | BIOTYPE | SIFT | PolyPhen | Tumor Sample Barcode | Tissue | Histology | Sex | Age | Stage | Therapy Types | Drugs | Outcome |
| ZBED1 | SNV | Missense_Mutation | novel | c.1780C>A | p.Arg594Ser | p.R594S | O96006 | protein_coding | deleterious(0.03) | benign(0.225) | TCGA-A7-A0DB-01 | Breast | breast invasive carcinoma | Female | <65 | I/II | Hormone Therapy | arimidex | SD |
| ZBED1 | SNV | Missense_Mutation | novel | c.170N>T | p.Ser57Phe | p.S57F | O96006 | protein_coding | deleterious(0) | probably_damaging(0.998) | TCGA-BH-A0B6-01 | Breast | breast invasive carcinoma | Female | <65 | I/II | Unknown | Unknown | SD |
| ZBED1 | SNV | Missense_Mutation | novel | c.4N>A | p.Glu2Lys | p.E2K | O96006 | protein_coding | deleterious_low_confidence(0.01) | benign(0.097) | TCGA-2W-A8YY-01 | Cervix | cervical & endocervical cancer | Female | <65 | I/II | Chemotherapy | cisplatin | CR |
| ZBED1 | SNV | Missense_Mutation | c.425N>T | p.Ser142Phe | p.S142F | O96006 | protein_coding | deleterious(0.01) | probably_damaging(0.979) | TCGA-JW-A5VL-01 | Cervix | cervical & endocervical cancer | Female | <65 | I/II | Unknown | Unknown | SD | |
| ZBED1 | SNV | Missense_Mutation | c.1044N>G | p.Ser348Arg | p.S348R | O96006 | protein_coding | deleterious(0) | possibly_damaging(0.636) | TCGA-A6-A566-01 | Colorectum | colon adenocarcinoma | Female | <65 | III/IV | Chemotherapy | oxaliplatin | PD | |
| ZBED1 | SNV | Missense_Mutation | c.685N>T | p.Gly229Cys | p.G229C | O96006 | protein_coding | tolerated(0.06) | benign(0.122) | TCGA-AA-3819-01 | Colorectum | colon adenocarcinoma | Female | <65 | I/II | Unknown | Unknown | SD | |
| ZBED1 | SNV | Missense_Mutation | rs781624072 | c.2041G>A | p.Val681Ile | p.V681I | O96006 | protein_coding | tolerated_low_confidence(0.62) | benign(0) | TCGA-AA-3845-01 | Colorectum | colon adenocarcinoma | Female | >=65 | I/II | Unknown | Unknown | PD |
| ZBED1 | SNV | Missense_Mutation | c.1166N>A | p.Ser389Asn | p.S389N | O96006 | protein_coding | tolerated(0.07) | benign(0.003) | TCGA-AA-A01R-01 | Colorectum | colon adenocarcinoma | Male | <65 | III/IV | Chemotherapy | 5-fluorouracil | PD | |
| ZBED1 | SNV | Missense_Mutation | rs764808495 | c.643N>A | p.Ala215Thr | p.A215T | O96006 | protein_coding | tolerated(0.08) | benign(0.019) | TCGA-AA-A02R-01 | Colorectum | colon adenocarcinoma | Female | >=65 | I/II | Unknown | Unknown | PD |
| ZBED1 | SNV | Missense_Mutation | c.154N>A | p.Ala52Thr | p.A52T | O96006 | protein_coding | tolerated(0.26) | possibly_damaging(0.584) | TCGA-AZ-6598-01 | Colorectum | colon adenocarcinoma | Female | >=65 | I/II | Unknown | Unknown | SD |
| Page: 1 2 3 4 5 6 7 8 9 10 11 12 |
Top |
Related drugs of malignant transformation related genes |
| Identification of chemicals and drugs interact with genes involved in malignant transfromation |
| (DGIdb 4.0) |
| Entrez ID | Symbol | Category | Interaction Types | Drug Claim Name | Drug Name | PMIDs |
| Page: 1 |

Copyright 2023-Present -The University of Texas Health Science Center at Houston |