
|
|||||
|
 | |
| |
| |
| |
| |
| |
|
Gene: WRAP73 |
Gene summary for WRAP73 |
| Gene information | Species | Human | Gene symbol | WRAP73 | Gene ID | 49856 |
| Gene name | WD repeat containing, antisense to TP73 | |
| Gene Alias | WDR8 | |
| Cytomap | 1p36.32 | |
| Gene Type | protein-coding | GO ID | GO:0000070 | UniProtAcc | Q9P2S5 |
Top |
Malignant transformation analysis |
| Identification of the aberrant gene expression in precancerous and cancerous lesions by comparing the gene expression of stem-like cells in diseased tissues with normal stem cells |
| Entrez ID | Symbol | Replicates | Species | Organ | Tissue | Adj P-value | Log2FC | Malignancy |
| 49856 | WRAP73 | P20T-E | Human | Esophagus | ESCC | 3.58e-23 | 4.92e-01 | 0.1124 |
| 49856 | WRAP73 | P21T-E | Human | Esophagus | ESCC | 6.38e-31 | 5.46e-01 | 0.1617 |
| 49856 | WRAP73 | P22T-E | Human | Esophagus | ESCC | 1.88e-11 | 1.77e-01 | 0.1236 |
| 49856 | WRAP73 | P23T-E | Human | Esophagus | ESCC | 5.75e-34 | 6.77e-01 | 0.108 |
| 49856 | WRAP73 | P24T-E | Human | Esophagus | ESCC | 1.77e-22 | 3.90e-01 | 0.1287 |
| 49856 | WRAP73 | P26T-E | Human | Esophagus | ESCC | 6.56e-15 | 3.21e-01 | 0.1276 |
| 49856 | WRAP73 | P27T-E | Human | Esophagus | ESCC | 7.52e-23 | 4.31e-01 | 0.1055 |
| 49856 | WRAP73 | P28T-E | Human | Esophagus | ESCC | 1.53e-19 | 3.53e-01 | 0.1149 |
| 49856 | WRAP73 | P30T-E | Human | Esophagus | ESCC | 1.33e-17 | 4.40e-01 | 0.137 |
| 49856 | WRAP73 | P31T-E | Human | Esophagus | ESCC | 1.47e-14 | 2.64e-01 | 0.1251 |
| 49856 | WRAP73 | P32T-E | Human | Esophagus | ESCC | 4.16e-22 | 3.80e-01 | 0.1666 |
| 49856 | WRAP73 | P36T-E | Human | Esophagus | ESCC | 1.43e-12 | 3.25e-01 | 0.1187 |
| 49856 | WRAP73 | P37T-E | Human | Esophagus | ESCC | 5.43e-17 | 4.37e-01 | 0.1371 |
| 49856 | WRAP73 | P39T-E | Human | Esophagus | ESCC | 1.97e-10 | 1.73e-01 | 0.0894 |
| 49856 | WRAP73 | P40T-E | Human | Esophagus | ESCC | 2.76e-10 | 3.14e-01 | 0.109 |
| 49856 | WRAP73 | P42T-E | Human | Esophagus | ESCC | 1.20e-14 | 3.87e-01 | 0.1175 |
| 49856 | WRAP73 | P44T-E | Human | Esophagus | ESCC | 5.20e-09 | 2.11e-01 | 0.1096 |
| 49856 | WRAP73 | P47T-E | Human | Esophagus | ESCC | 9.35e-10 | 1.63e-01 | 0.1067 |
| 49856 | WRAP73 | P48T-E | Human | Esophagus | ESCC | 1.35e-23 | 3.16e-01 | 0.0959 |
| 49856 | WRAP73 | P49T-E | Human | Esophagus | ESCC | 2.40e-11 | 7.47e-01 | 0.1768 |
| Page: 1 2 3 4 5 |
| Tissue | Expression Dynamics | Abbreviation |
| Esophagus | 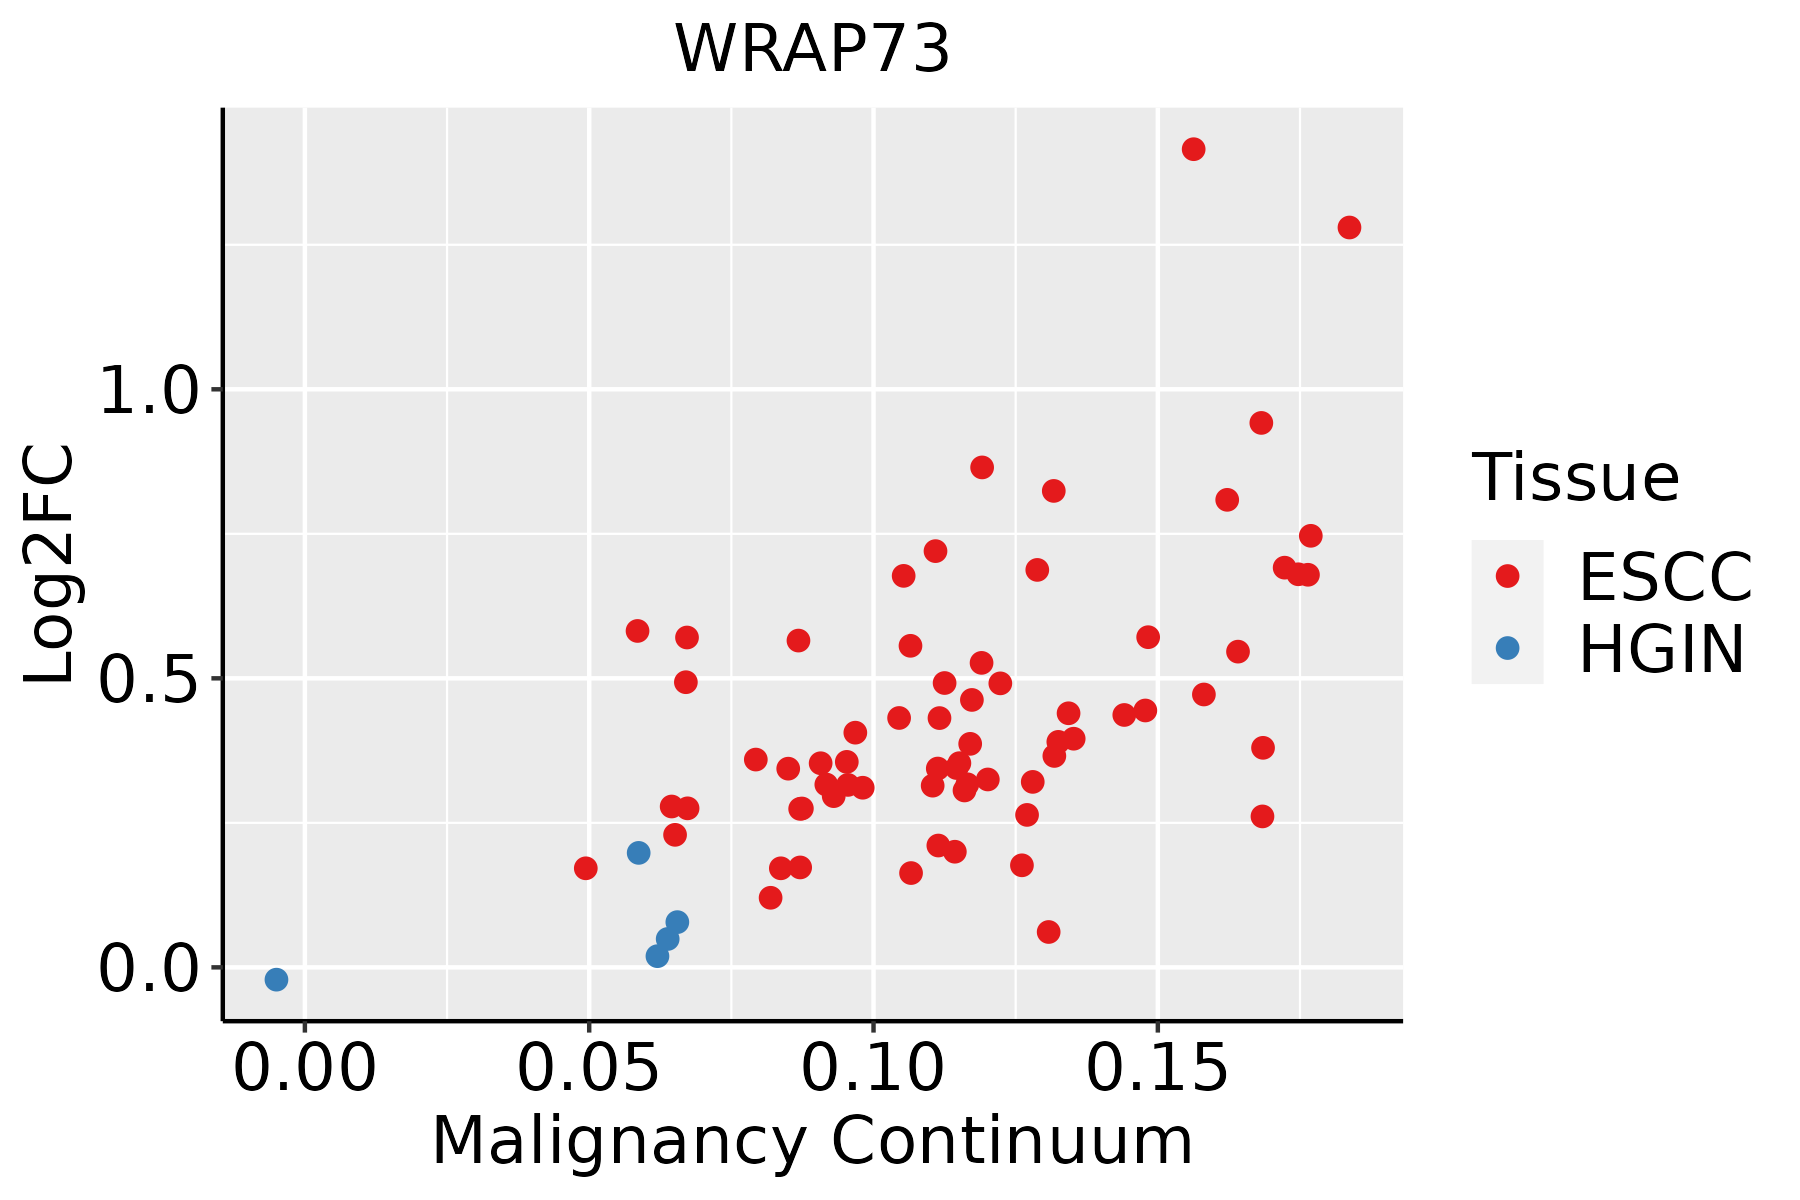 | ESCC: Esophageal squamous cell carcinoma |
| HGIN: High-grade intraepithelial neoplasias | ||
| LGIN: Low-grade intraepithelial neoplasias | ||
| Liver | 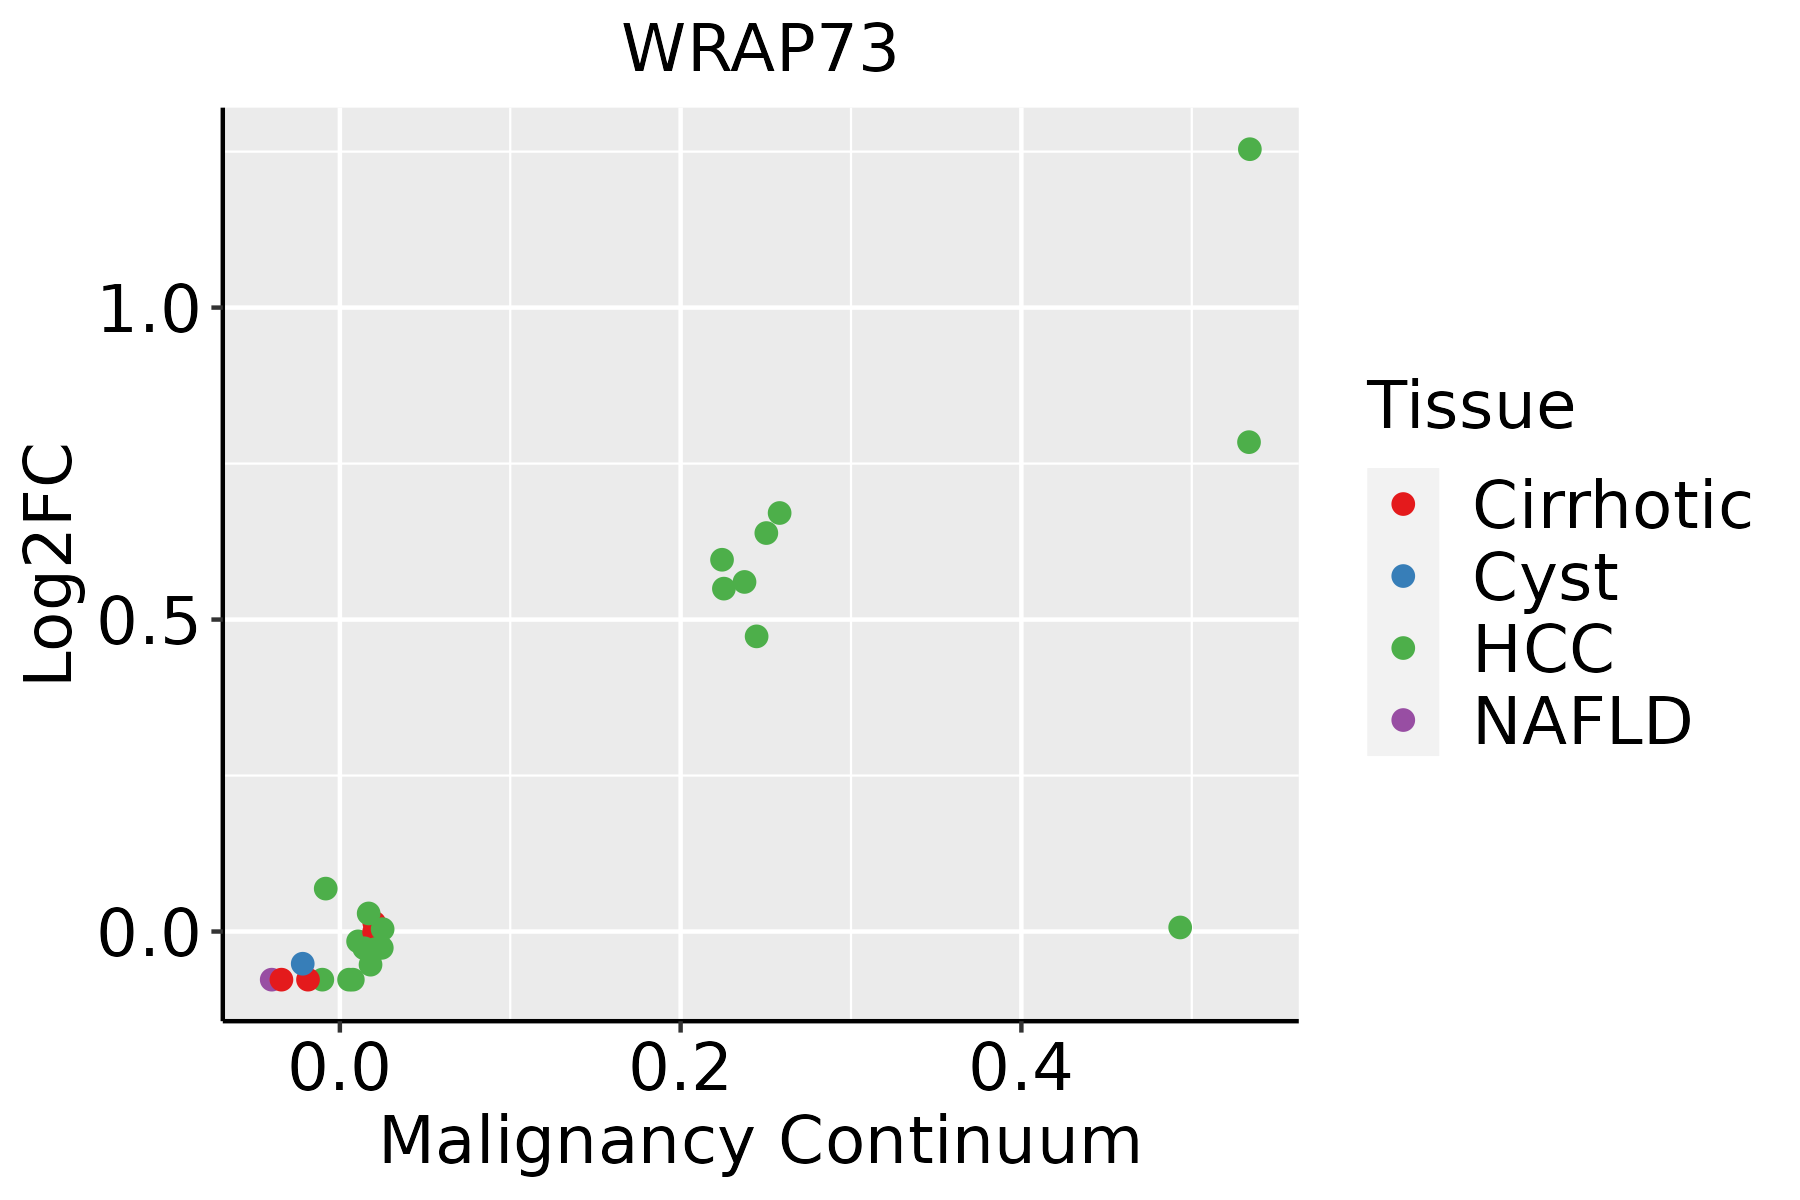 | HCC: Hepatocellular carcinoma |
| NAFLD: Non-alcoholic fatty liver disease | ||
| Oral Cavity | 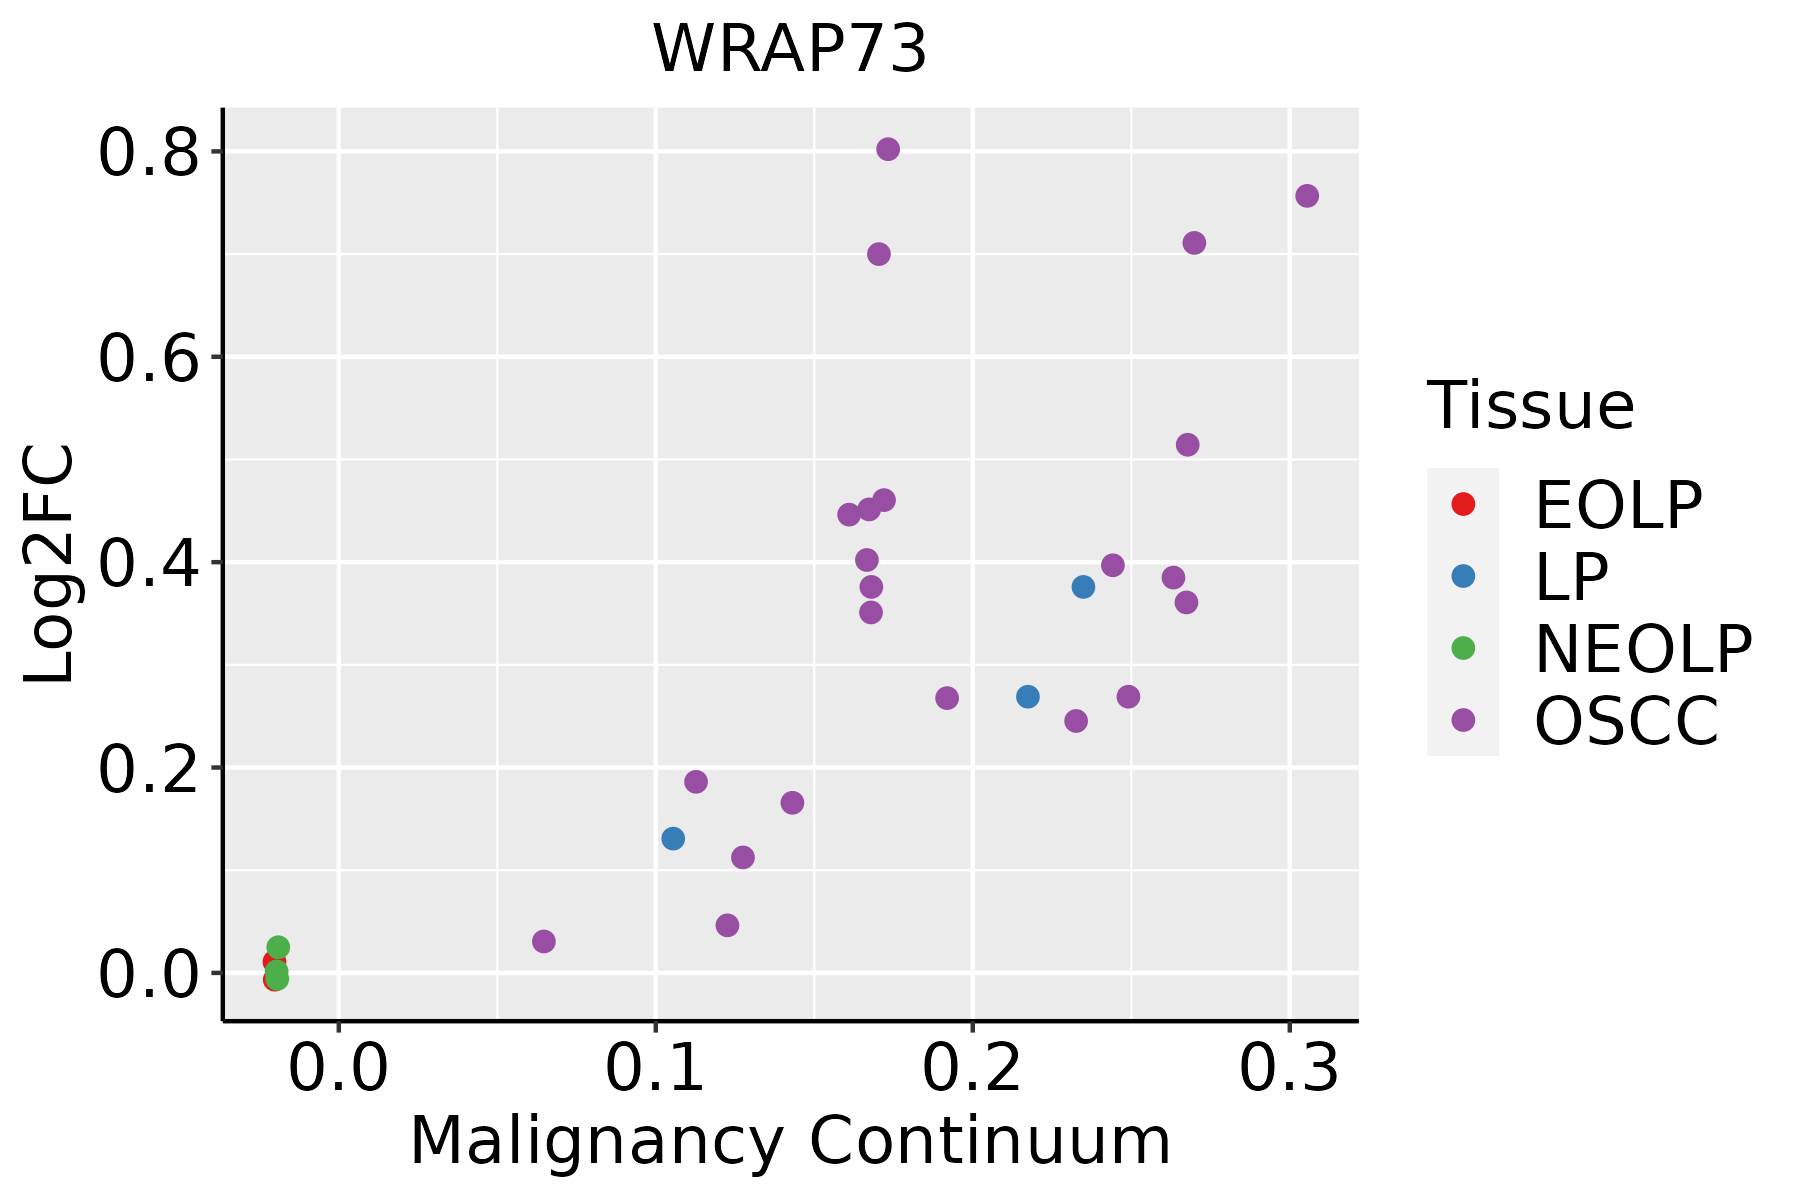 | EOLP: Erosive Oral lichen planus |
| LP: leukoplakia | ||
| NEOLP: Non-erosive oral lichen planus | ||
| OSCC: Oral squamous cell carcinoma |
| ∗log2FC in expression of this searched gene in stem-like cells from each diseased tissue sample relative to stem-like cells in normal samples in each tissue plotted against the malignancy continuum. Samples are colored based on if they are from different disease stage. |
Top |
Malignant transformation related pathway analysis |
| Find out the enriched GO biological processes and KEGG pathways involved in transition from healthy to precancer to cancer |
| Tissue | Disease Stage | Enriched GO biological Processes |
| Colorectum | AD |  |
| Colorectum | SER |  |
| Colorectum | MSS |  |
| Colorectum | MSI-H |  |
| Colorectum | FAP |  |
| ∗Top 15 enriched GO BP terms are showed in the bar plot of each disease state in each tissue. Each row represents a significant GO biological process which is colored according to the -log10(p.adjust). |
| Page: 1 2 3 4 5 6 7 8 9 |
| GO ID | Tissue | Disease Stage | Description | Gene Ratio | Bg Ratio | pvalue | p.adjust | Count |
| GO:19021156 | Esophagus | HGIN | regulation of organelle assembly | 46/2587 | 186/18723 | 4.63e-05 | 1.12e-03 | 46 |
| GO:00070527 | Esophagus | HGIN | mitotic spindle organization | 31/2587 | 120/18723 | 3.35e-04 | 5.50e-03 | 31 |
| GO:01400146 | Esophagus | HGIN | mitotic nuclear division | 61/2587 | 287/18723 | 3.38e-04 | 5.55e-03 | 61 |
| GO:00070593 | Esophagus | HGIN | chromosome segregation | 71/2587 | 346/18723 | 3.47e-04 | 5.62e-03 | 71 |
| GO:19028507 | Esophagus | HGIN | microtubule cytoskeleton organization involved in mitosis | 36/2587 | 147/18723 | 3.61e-04 | 5.68e-03 | 36 |
| GO:00070518 | Esophagus | HGIN | spindle organization | 42/2587 | 184/18723 | 6.07e-04 | 8.49e-03 | 42 |
| GO:19028552 | Esophagus | HGIN | regulation of non-motile cilium assembly | 6/2587 | 10/18723 | 8.81e-04 | 1.13e-02 | 6 |
| GO:00903077 | Esophagus | HGIN | mitotic spindle assembly | 18/2587 | 65/18723 | 2.46e-03 | 2.45e-02 | 18 |
| GO:00000703 | Esophagus | HGIN | mitotic sister chromatid segregation | 36/2587 | 168/18723 | 4.42e-03 | 3.87e-02 | 36 |
| GO:006049117 | Esophagus | HGIN | regulation of cell projection assembly | 39/2587 | 188/18723 | 5.61e-03 | 4.57e-02 | 39 |
| GO:014001414 | Esophagus | ESCC | mitotic nuclear division | 218/8552 | 287/18723 | 6.17e-26 | 1.78e-23 | 218 |
| GO:000007011 | Esophagus | ESCC | mitotic sister chromatid segregation | 138/8552 | 168/18723 | 1.37e-22 | 2.63e-20 | 138 |
| GO:00008194 | Esophagus | ESCC | sister chromatid segregation | 157/8552 | 202/18723 | 8.41e-21 | 1.33e-18 | 157 |
| GO:000705911 | Esophagus | ESCC | chromosome segregation | 238/8552 | 346/18723 | 1.72e-18 | 1.82e-16 | 238 |
| GO:190285015 | Esophagus | ESCC | microtubule cytoskeleton organization involved in mitosis | 116/8552 | 147/18723 | 1.25e-16 | 9.91e-15 | 116 |
| GO:000705214 | Esophagus | ESCC | mitotic spindle organization | 97/8552 | 120/18723 | 2.17e-15 | 1.33e-13 | 97 |
| GO:000705114 | Esophagus | ESCC | spindle organization | 134/8552 | 184/18723 | 5.70e-14 | 2.87e-12 | 134 |
| GO:00482853 | Esophagus | ESCC | organelle fission | 301/8552 | 488/18723 | 4.64e-13 | 2.12e-11 | 301 |
| GO:00988133 | Esophagus | ESCC | nuclear chromosome segregation | 187/8552 | 281/18723 | 1.00e-12 | 4.36e-11 | 187 |
| GO:00002802 | Esophagus | ESCC | nuclear division | 270/8552 | 439/18723 | 1.17e-11 | 4.24e-10 | 270 |
| Page: 1 2 3 4 |
| Pathway ID | Tissue | Disease Stage | Description | Gene Ratio | Bg Ratio | pvalue | p.adjust | qvalue | Count |
| Page: 1 |
Top |
Cell-cell communication analysis |
| Identification of potential cell-cell interactions between two cell types and their ligand-receptor pairs for different disease states |
| Ligand | Receptor | LRpair | Pathway | Tissue | Disease Stage |
| Page: 1 |
Top |
Single-cell gene regulatory network inference analysis |
| Find out the significant the regulons (TFs) and the target genes of each regulon across cell types for different disease states |
| TF | Cell Type | Tissue | Disease Stage | Target Gene | RSS | Regulon Activity |
| ∗The dot plots of a searched regulon are shown for all cell subpopulations in each disease state of each tissue based on the regulon specific score inferred using pySCENIC and by calculating the average expression. |
| Page: 1 |
Top |
Somatic mutation of malignant transformation related genes |
| Annotation of somatic variants for genes involved in malignant transformation |
| Hugo Symbol | Variant Class | Variant Classification | dbSNP RS | HGVSc | HGVSp | HGVSp Short | SWISSPROT | BIOTYPE | SIFT | PolyPhen | Tumor Sample Barcode | Tissue | Histology | Sex | Age | Stage | Therapy Types | Drugs | Outcome |
| WRAP73 | SNV | Missense_Mutation | c.13N>A | p.Glu5Lys | p.E5K | Q9P2S5 | protein_coding | deleterious(0) | probably_damaging(0.961) | TCGA-AR-A1AS-01 | Breast | breast invasive carcinoma | Female | <65 | I/II | Chemotherapy | doxorubicin | SD | |
| WRAP73 | deletion | Frame_Shift_Del | novel | c.331delG | p.Glu111AsnfsTer6 | p.E111Nfs*6 | Q9P2S5 | protein_coding | TCGA-D8-A27V-01 | Breast | breast invasive carcinoma | Female | <65 | I/II | Hormone Therapy | tamoxiphen | SD | ||
| WRAP73 | SNV | Missense_Mutation | novel | c.913N>A | p.Glu305Lys | p.E305K | Q9P2S5 | protein_coding | tolerated(0.57) | benign(0.021) | TCGA-MA-AA41-01 | Cervix | cervical & endocervical cancer | Female | <65 | I/II | Unknown | Unknown | SD |
| WRAP73 | SNV | Missense_Mutation | c.925G>A | p.Glu309Lys | p.E309K | Q9P2S5 | protein_coding | tolerated(0.31) | benign(0.424) | TCGA-VS-A958-01 | Cervix | cervical & endocervical cancer | Female | <65 | I/II | Chemotherapy | cisplatin | CR | |
| WRAP73 | SNV | Missense_Mutation | rs199984886 | c.878C>T | p.Pro293Leu | p.P293L | Q9P2S5 | protein_coding | tolerated(0.27) | benign(0.049) | TCGA-A6-6781-01 | Colorectum | colon adenocarcinoma | Male | <65 | III/IV | Chemotherapy | oxaliplatin | SD |
| WRAP73 | SNV | Missense_Mutation | novel | c.76N>A | p.Cys26Ser | p.C26S | Q9P2S5 | protein_coding | tolerated(0.17) | benign(0.043) | TCGA-AA-3877-01 | Colorectum | colon adenocarcinoma | Female | >=65 | I/II | Unknown | Unknown | SD |
| WRAP73 | SNV | Missense_Mutation | rs774325760 | c.310N>T | p.Arg104Cys | p.R104C | Q9P2S5 | protein_coding | deleterious(0) | probably_damaging(1) | TCGA-AA-3947-01 | Colorectum | colon adenocarcinoma | Female | <65 | I/II | Unknown | Unknown | SD |
| WRAP73 | SNV | Missense_Mutation | rs142980544 | c.458N>A | p.Arg153Gln | p.R153Q | Q9P2S5 | protein_coding | deleterious(0) | probably_damaging(0.952) | TCGA-D5-6928-01 | Colorectum | colon adenocarcinoma | Male | >=65 | I/II | Unknown | Unknown | SD |
| WRAP73 | SNV | Missense_Mutation | rs774325847 | c.742C>T | p.Arg248Cys | p.R248C | Q9P2S5 | protein_coding | deleterious(0) | probably_damaging(1) | TCGA-F4-6856-01 | Colorectum | colon adenocarcinoma | Male | <65 | I/II | Ancillary | leucovorin | CR |
| WRAP73 | SNV | Missense_Mutation | c.794N>T | p.Ala265Val | p.A265V | Q9P2S5 | protein_coding | tolerated(0.26) | benign(0.021) | TCGA-G4-6320-01 | Colorectum | colon adenocarcinoma | Male | >=65 | III/IV | Chemotherapy | oxaliplatin | SD |
| Page: 1 2 3 4 5 |
Top |
Related drugs of malignant transformation related genes |
| Identification of chemicals and drugs interact with genes involved in malignant transfromation |
| (DGIdb 4.0) |
| Entrez ID | Symbol | Category | Interaction Types | Drug Claim Name | Drug Name | PMIDs |
| Page: 1 |

Copyright 2023-Present -The University of Texas Health Science Center at Houston |