
|
|||||
|
 | |
| |
| |
| |
| |
| |
|
Gene: VSNL1 |
Gene summary for VSNL1 |
| Gene information | Species | Human | Gene symbol | VSNL1 | Gene ID | 7447 |
| Gene name | visinin like 1 | |
| Gene Alias | HLP3 | |
| Cytomap | 2p24.2 | |
| Gene Type | protein-coding | GO ID | GO:0001678 | UniProtAcc | P62760 |
Top |
Malignant transformation analysis |
| Identification of the aberrant gene expression in precancerous and cancerous lesions by comparing the gene expression of stem-like cells in diseased tissues with normal stem cells |
| Entrez ID | Symbol | Replicates | Species | Organ | Tissue | Adj P-value | Log2FC | Malignancy |
| 7447 | VSNL1 | P15T-E | Human | Esophagus | ESCC | 1.23e-15 | 4.86e-01 | 0.1149 |
| 7447 | VSNL1 | P16T-E | Human | Esophagus | ESCC | 5.02e-10 | 1.07e-01 | 0.1153 |
| 7447 | VSNL1 | P17T-E | Human | Esophagus | ESCC | 6.74e-05 | 4.89e-01 | 0.1278 |
| 7447 | VSNL1 | P19T-E | Human | Esophagus | ESCC | 2.10e-03 | 6.89e-01 | 0.1662 |
| 7447 | VSNL1 | P20T-E | Human | Esophagus | ESCC | 3.45e-41 | 1.07e+00 | 0.1124 |
| 7447 | VSNL1 | P21T-E | Human | Esophagus | ESCC | 8.76e-34 | 9.16e-01 | 0.1617 |
| 7447 | VSNL1 | P22T-E | Human | Esophagus | ESCC | 3.40e-19 | 5.08e-01 | 0.1236 |
| 7447 | VSNL1 | P23T-E | Human | Esophagus | ESCC | 1.54e-04 | 2.57e-01 | 0.108 |
| 7447 | VSNL1 | P24T-E | Human | Esophagus | ESCC | 4.20e-02 | 1.08e-01 | 0.1287 |
| 7447 | VSNL1 | P26T-E | Human | Esophagus | ESCC | 2.60e-52 | 1.22e+00 | 0.1276 |
| 7447 | VSNL1 | P27T-E | Human | Esophagus | ESCC | 6.78e-39 | 1.07e+00 | 0.1055 |
| 7447 | VSNL1 | P28T-E | Human | Esophagus | ESCC | 8.75e-81 | 2.25e+00 | 0.1149 |
| 7447 | VSNL1 | P30T-E | Human | Esophagus | ESCC | 3.81e-35 | 1.71e+00 | 0.137 |
| 7447 | VSNL1 | P31T-E | Human | Esophagus | ESCC | 2.10e-60 | 1.31e+00 | 0.1251 |
| 7447 | VSNL1 | P32T-E | Human | Esophagus | ESCC | 1.88e-14 | 5.54e-01 | 0.1666 |
| 7447 | VSNL1 | P36T-E | Human | Esophagus | ESCC | 2.77e-05 | 5.56e-01 | 0.1187 |
| 7447 | VSNL1 | P37T-E | Human | Esophagus | ESCC | 1.14e-19 | 5.71e-01 | 0.1371 |
| 7447 | VSNL1 | P40T-E | Human | Esophagus | ESCC | 3.58e-10 | 3.86e-01 | 0.109 |
| 7447 | VSNL1 | P42T-E | Human | Esophagus | ESCC | 7.77e-25 | 7.24e-01 | 0.1175 |
| 7447 | VSNL1 | P44T-E | Human | Esophagus | ESCC | 2.52e-14 | 6.95e-01 | 0.1096 |
| Page: 1 2 3 4 5 |
| Tissue | Expression Dynamics | Abbreviation |
| Cervix |  | CC: Cervix cancer |
| HSIL_HPV: HPV-infected high-grade squamous intraepithelial lesions | ||
| N_HPV: HPV-infected normal cervix | ||
| Esophagus |  | ESCC: Esophageal squamous cell carcinoma |
| HGIN: High-grade intraepithelial neoplasias | ||
| LGIN: Low-grade intraepithelial neoplasias | ||
| Oral Cavity | 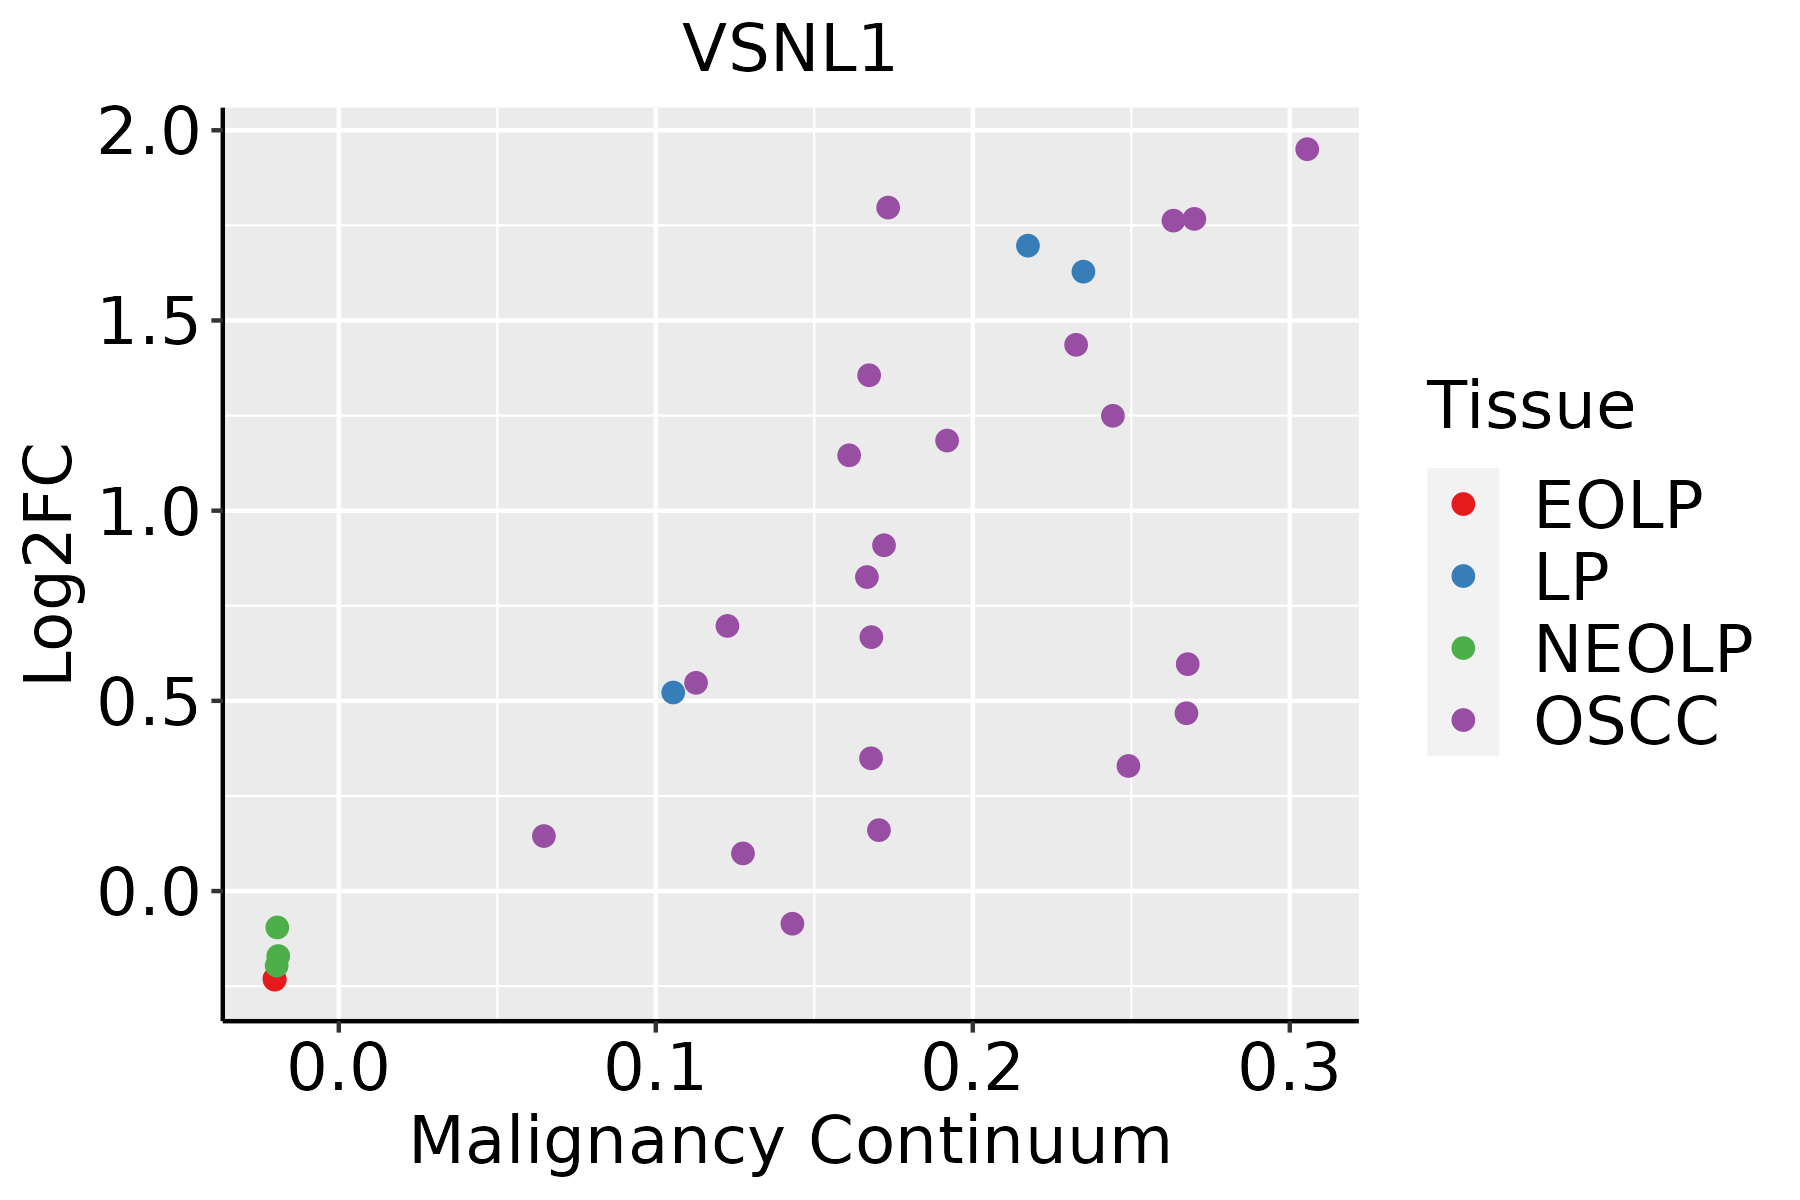 | EOLP: Erosive Oral lichen planus |
| LP: leukoplakia | ||
| NEOLP: Non-erosive oral lichen planus | ||
| OSCC: Oral squamous cell carcinoma | ||
| Skin | 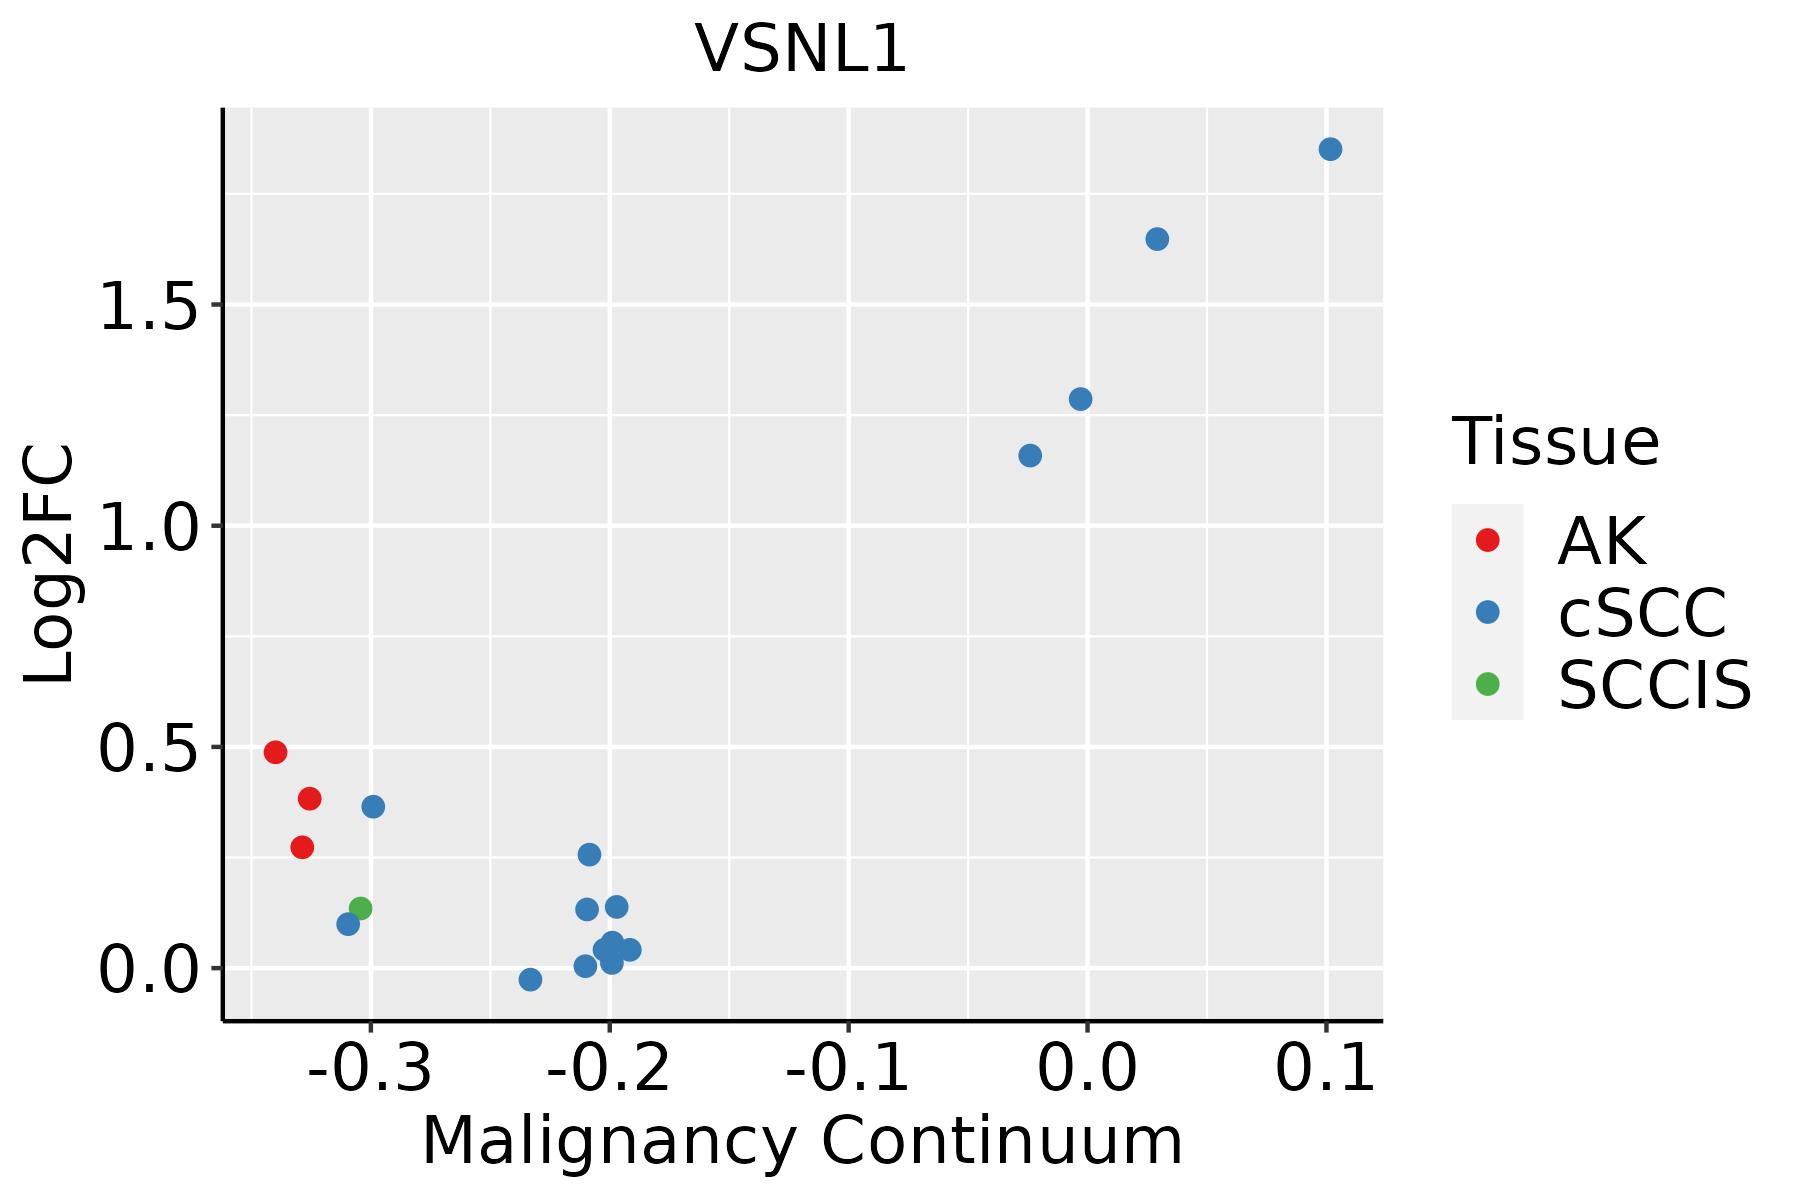 | AK: Actinic keratosis |
| cSCC: Cutaneous squamous cell carcinoma | ||
| SCCIS:squamous cell carcinoma in situ |
| ∗log2FC in expression of this searched gene in stem-like cells from each diseased tissue sample relative to stem-like cells in normal samples in each tissue plotted against the malignancy continuum. Samples are colored based on if they are from different disease stage. |
Top |
Malignant transformation related pathway analysis |
| Find out the enriched GO biological processes and KEGG pathways involved in transition from healthy to precancer to cancer |
| Tissue | Disease Stage | Enriched GO biological Processes |
| Colorectum | AD |  |
| Colorectum | SER |  |
| Colorectum | MSS |  |
| Colorectum | MSI-H |  |
| Colorectum | FAP |  |
| ∗Top 15 enriched GO BP terms are showed in the bar plot of each disease state in each tissue. Each row represents a significant GO biological process which is colored according to the -log10(p.adjust). |
| Page: 1 2 3 4 5 6 7 8 9 |
| GO ID | Tissue | Disease Stage | Description | Gene Ratio | Bg Ratio | pvalue | p.adjust | Count |
| GO:005122210 | Cervix | CC | positive regulation of protein transport | 72/2311 | 303/18723 | 2.36e-08 | 1.70e-06 | 72 |
| GO:190495110 | Cervix | CC | positive regulation of establishment of protein localization | 73/2311 | 319/18723 | 9.69e-08 | 5.25e-06 | 73 |
| GO:000974310 | Cervix | CC | response to carbohydrate | 53/2311 | 253/18723 | 7.02e-05 | 9.85e-04 | 53 |
| GO:003428410 | Cervix | CC | response to monosaccharide | 48/2311 | 225/18723 | 9.48e-05 | 1.25e-03 | 48 |
| GO:000974610 | Cervix | CC | response to hexose | 45/2311 | 219/18723 | 3.73e-04 | 3.86e-03 | 45 |
| GO:00425939 | Cervix | CC | glucose homeostasis | 50/2311 | 258/18723 | 7.57e-04 | 6.76e-03 | 50 |
| GO:00335009 | Cervix | CC | carbohydrate homeostasis | 50/2311 | 259/18723 | 8.28e-04 | 7.22e-03 | 50 |
| GO:00016788 | Cervix | CC | cellular glucose homeostasis | 36/2311 | 172/18723 | 9.65e-04 | 8.09e-03 | 36 |
| GO:00097499 | Cervix | CC | response to glucose | 42/2311 | 212/18723 | 1.23e-03 | 9.87e-03 | 42 |
| GO:00507148 | Cervix | CC | positive regulation of protein secretion | 29/2311 | 137/18723 | 2.40e-03 | 1.70e-02 | 29 |
| GO:00713229 | Cervix | CC | cellular response to carbohydrate stimulus | 33/2311 | 163/18723 | 2.71e-03 | 1.85e-02 | 33 |
| GO:00713338 | Cervix | CC | cellular response to glucose stimulus | 31/2311 | 151/18723 | 2.86e-03 | 1.91e-02 | 31 |
| GO:00171574 | Cervix | CC | regulation of exocytosis | 39/2311 | 202/18723 | 2.90e-03 | 1.93e-02 | 39 |
| GO:00713318 | Cervix | CC | cellular response to hexose stimulus | 31/2311 | 153/18723 | 3.53e-03 | 2.27e-02 | 31 |
| GO:00713268 | Cervix | CC | cellular response to monosaccharide stimulus | 31/2311 | 154/18723 | 3.90e-03 | 2.46e-02 | 31 |
| GO:00611785 | Cervix | CC | regulation of insulin secretion involved in cellular response to glucose stimulus | 16/2311 | 64/18723 | 4.05e-03 | 2.52e-02 | 16 |
| GO:00320245 | Cervix | CC | positive regulation of insulin secretion | 18/2311 | 78/18723 | 5.94e-03 | 3.40e-02 | 18 |
| GO:00357734 | Cervix | CC | insulin secretion involved in cellular response to glucose stimulus | 17/2311 | 73/18723 | 6.71e-03 | 3.70e-02 | 17 |
| GO:00068873 | Cervix | CC | exocytosis | 59/2311 | 352/18723 | 8.74e-03 | 4.48e-02 | 59 |
| GO:00158337 | Cervix | CC | peptide transport | 46/2311 | 264/18723 | 9.69e-03 | 4.78e-02 | 46 |
| Page: 1 2 3 4 5 6 |
| Pathway ID | Tissue | Disease Stage | Description | Gene Ratio | Bg Ratio | pvalue | p.adjust | qvalue | Count |
| Page: 1 |
Top |
Cell-cell communication analysis |
| Identification of potential cell-cell interactions between two cell types and their ligand-receptor pairs for different disease states |
| Ligand | Receptor | LRpair | Pathway | Tissue | Disease Stage |
| Page: 1 |
Top |
Single-cell gene regulatory network inference analysis |
| Find out the significant the regulons (TFs) and the target genes of each regulon across cell types for different disease states |
| TF | Cell Type | Tissue | Disease Stage | Target Gene | RSS | Regulon Activity |
| ∗The dot plots of a searched regulon are shown for all cell subpopulations in each disease state of each tissue based on the regulon specific score inferred using pySCENIC and by calculating the average expression. |
| Page: 1 |
Top |
Somatic mutation of malignant transformation related genes |
| Annotation of somatic variants for genes involved in malignant transformation |
| Hugo Symbol | Variant Class | Variant Classification | dbSNP RS | HGVSc | HGVSp | HGVSp Short | SWISSPROT | BIOTYPE | SIFT | PolyPhen | Tumor Sample Barcode | Tissue | Histology | Sex | Age | Stage | Therapy Types | Drugs | Outcome |
| VSNL1 | SNV | Missense_Mutation | novel | c.355N>A | p.Val119Met | p.V119M | P62760 | protein_coding | deleterious(0.04) | benign(0.01) | TCGA-B5-A3FA-01 | Endometrium | uterine corpus endometrioid carcinoma | Female | >=65 | I/II | Unknown | Unknown | SD |
| VSNL1 | SNV | Missense_Mutation | c.103N>A | p.Leu35Ile | p.L35I | P62760 | protein_coding | tolerated(0.24) | benign(0.033) | TCGA-BS-A0UF-01 | Endometrium | uterine corpus endometrioid carcinoma | Female | >=65 | I/II | Unknown | Unknown | SD | |
| VSNL1 | SNV | Missense_Mutation | c.550N>A | p.Leu184Ile | p.L184I | P62760 | protein_coding | tolerated(0.42) | benign(0.38) | TCGA-BS-A0UF-01 | Endometrium | uterine corpus endometrioid carcinoma | Female | >=65 | I/II | Unknown | Unknown | SD | |
| VSNL1 | SNV | Missense_Mutation | novel | c.254N>C | p.Phe85Ser | p.F85S | P62760 | protein_coding | deleterious(0) | probably_damaging(0.998) | TCGA-D1-A175-01 | Endometrium | uterine corpus endometrioid carcinoma | Female | <65 | I/II | Chemotherapy | paclitaxel | SD |
| VSNL1 | SNV | Missense_Mutation | novel | c.29C>A | p.Pro10His | p.P10H | P62760 | protein_coding | deleterious(0.01) | probably_damaging(0.988) | TCGA-EO-A22X-01 | Endometrium | uterine corpus endometrioid carcinoma | Female | <65 | III/IV | Unspecific | Carboplatin | Complete Response |
| VSNL1 | SNV | Missense_Mutation | novel | c.72N>C | p.Glu24Asp | p.E24D | P62760 | protein_coding | tolerated(0.31) | benign(0.007) | TCGA-EY-A1GP-01 | Endometrium | uterine corpus endometrioid carcinoma | Female | <65 | I/II | Unknown | Unknown | SD |
| VSNL1 | SNV | Missense_Mutation | c.531N>A | p.Ser177Arg | p.S177R | P62760 | protein_coding | tolerated(0.48) | benign(0.019) | TCGA-44-2656-01 | Lung | lung adenocarcinoma | Male | <65 | I/II | Unknown | Unknown | PD | |
| VSNL1 | SNV | Missense_Mutation | novel | c.490N>A | p.Asp164Asn | p.D164N | P62760 | protein_coding | tolerated(0.07) | benign(0.034) | TCGA-64-5781-01 | Lung | lung adenocarcinoma | Female | <65 | I/II | Chemotherapy | cisplatin | PD |
| VSNL1 | SNV | Missense_Mutation | novel | c.448N>G | p.Arg150Gly | p.R150G | P62760 | protein_coding | deleterious(0) | probably_damaging(0.998) | TCGA-78-7161-01 | Lung | lung adenocarcinoma | Female | >=65 | I/II | Chemotherapy | cisplatin | PD |
| VSNL1 | SNV | Missense_Mutation | novel | c.500N>A | p.Thr167Lys | p.T167K | P62760 | protein_coding | deleterious(0.03) | benign(0.116) | TCGA-86-8279-01 | Lung | lung adenocarcinoma | Male | <65 | I/II | Chemotherapy | etoposide | CR |
| Page: 1 2 |
Top |
Related drugs of malignant transformation related genes |
| Identification of chemicals and drugs interact with genes involved in malignant transfromation |
| (DGIdb 4.0) |
| Entrez ID | Symbol | Category | Interaction Types | Drug Claim Name | Drug Name | PMIDs |
| Page: 1 |

Copyright 2023-Present -The University of Texas Health Science Center at Houston |