
|
|||||
|
 | |
| |
| |
| |
| |
| |
|
Gene: VGLL4 |
Gene summary for VGLL4 |
| Gene information | Species | Human | Gene symbol | VGLL4 | Gene ID | 9686 |
| Gene name | vestigial like family member 4 | |
| Gene Alias | VGL-4 | |
| Cytomap | 3p25.3-p25.2 | |
| Gene Type | protein-coding | GO ID | GO:0001558 | UniProtAcc | G5E9M7 |
Top |
Malignant transformation analysis |
| Identification of the aberrant gene expression in precancerous and cancerous lesions by comparing the gene expression of stem-like cells in diseased tissues with normal stem cells |
| Entrez ID | Symbol | Replicates | Species | Organ | Tissue | Adj P-value | Log2FC | Malignancy |
| 9686 | VGLL4 | A014-C-040 | Human | Colorectum | FAP | 2.33e-03 | -2.71e-01 | -0.1184 |
| 9686 | VGLL4 | A002-C-201 | Human | Colorectum | FAP | 7.88e-14 | -3.46e-01 | 0.0324 |
| 9686 | VGLL4 | A002-C-203 | Human | Colorectum | FAP | 4.77e-02 | -1.73e-01 | 0.2786 |
| 9686 | VGLL4 | A001-C-119 | Human | Colorectum | FAP | 9.39e-11 | -5.02e-01 | -0.1557 |
| 9686 | VGLL4 | A001-C-108 | Human | Colorectum | FAP | 2.33e-15 | -3.42e-01 | -0.0272 |
| 9686 | VGLL4 | A002-C-205 | Human | Colorectum | FAP | 1.21e-28 | -6.36e-01 | -0.1236 |
| 9686 | VGLL4 | A001-C-104 | Human | Colorectum | FAP | 1.24e-03 | -2.58e-01 | 0.0184 |
| 9686 | VGLL4 | A015-C-005 | Human | Colorectum | FAP | 1.11e-06 | -3.90e-01 | -0.0336 |
| 9686 | VGLL4 | A015-C-006 | Human | Colorectum | FAP | 5.72e-17 | -4.95e-01 | -0.0994 |
| 9686 | VGLL4 | A015-C-106 | Human | Colorectum | FAP | 2.83e-09 | -3.54e-01 | -0.0511 |
| 9686 | VGLL4 | A002-C-114 | Human | Colorectum | FAP | 3.06e-24 | -6.20e-01 | -0.1561 |
| 9686 | VGLL4 | A015-C-104 | Human | Colorectum | FAP | 6.50e-34 | -6.13e-01 | -0.1899 |
| 9686 | VGLL4 | A001-C-014 | Human | Colorectum | FAP | 1.08e-16 | -3.95e-01 | 0.0135 |
| 9686 | VGLL4 | A002-C-016 | Human | Colorectum | FAP | 7.17e-22 | -4.34e-01 | 0.0521 |
| 9686 | VGLL4 | A015-C-002 | Human | Colorectum | FAP | 1.17e-14 | -5.95e-01 | -0.0763 |
| 9686 | VGLL4 | A001-C-203 | Human | Colorectum | FAP | 3.30e-11 | -2.77e-01 | -0.0481 |
| 9686 | VGLL4 | A002-C-116 | Human | Colorectum | FAP | 3.16e-36 | -6.06e-01 | -0.0452 |
| 9686 | VGLL4 | A014-C-008 | Human | Colorectum | FAP | 4.79e-23 | -7.83e-01 | -0.191 |
| 9686 | VGLL4 | A018-E-020 | Human | Colorectum | FAP | 2.87e-20 | -4.35e-01 | -0.2034 |
| 9686 | VGLL4 | F034 | Human | Colorectum | FAP | 2.05e-20 | -4.20e-01 | -0.0665 |
| Page: 1 2 3 4 5 6 7 8 9 |
| Tissue | Expression Dynamics | Abbreviation |
| Cervix | 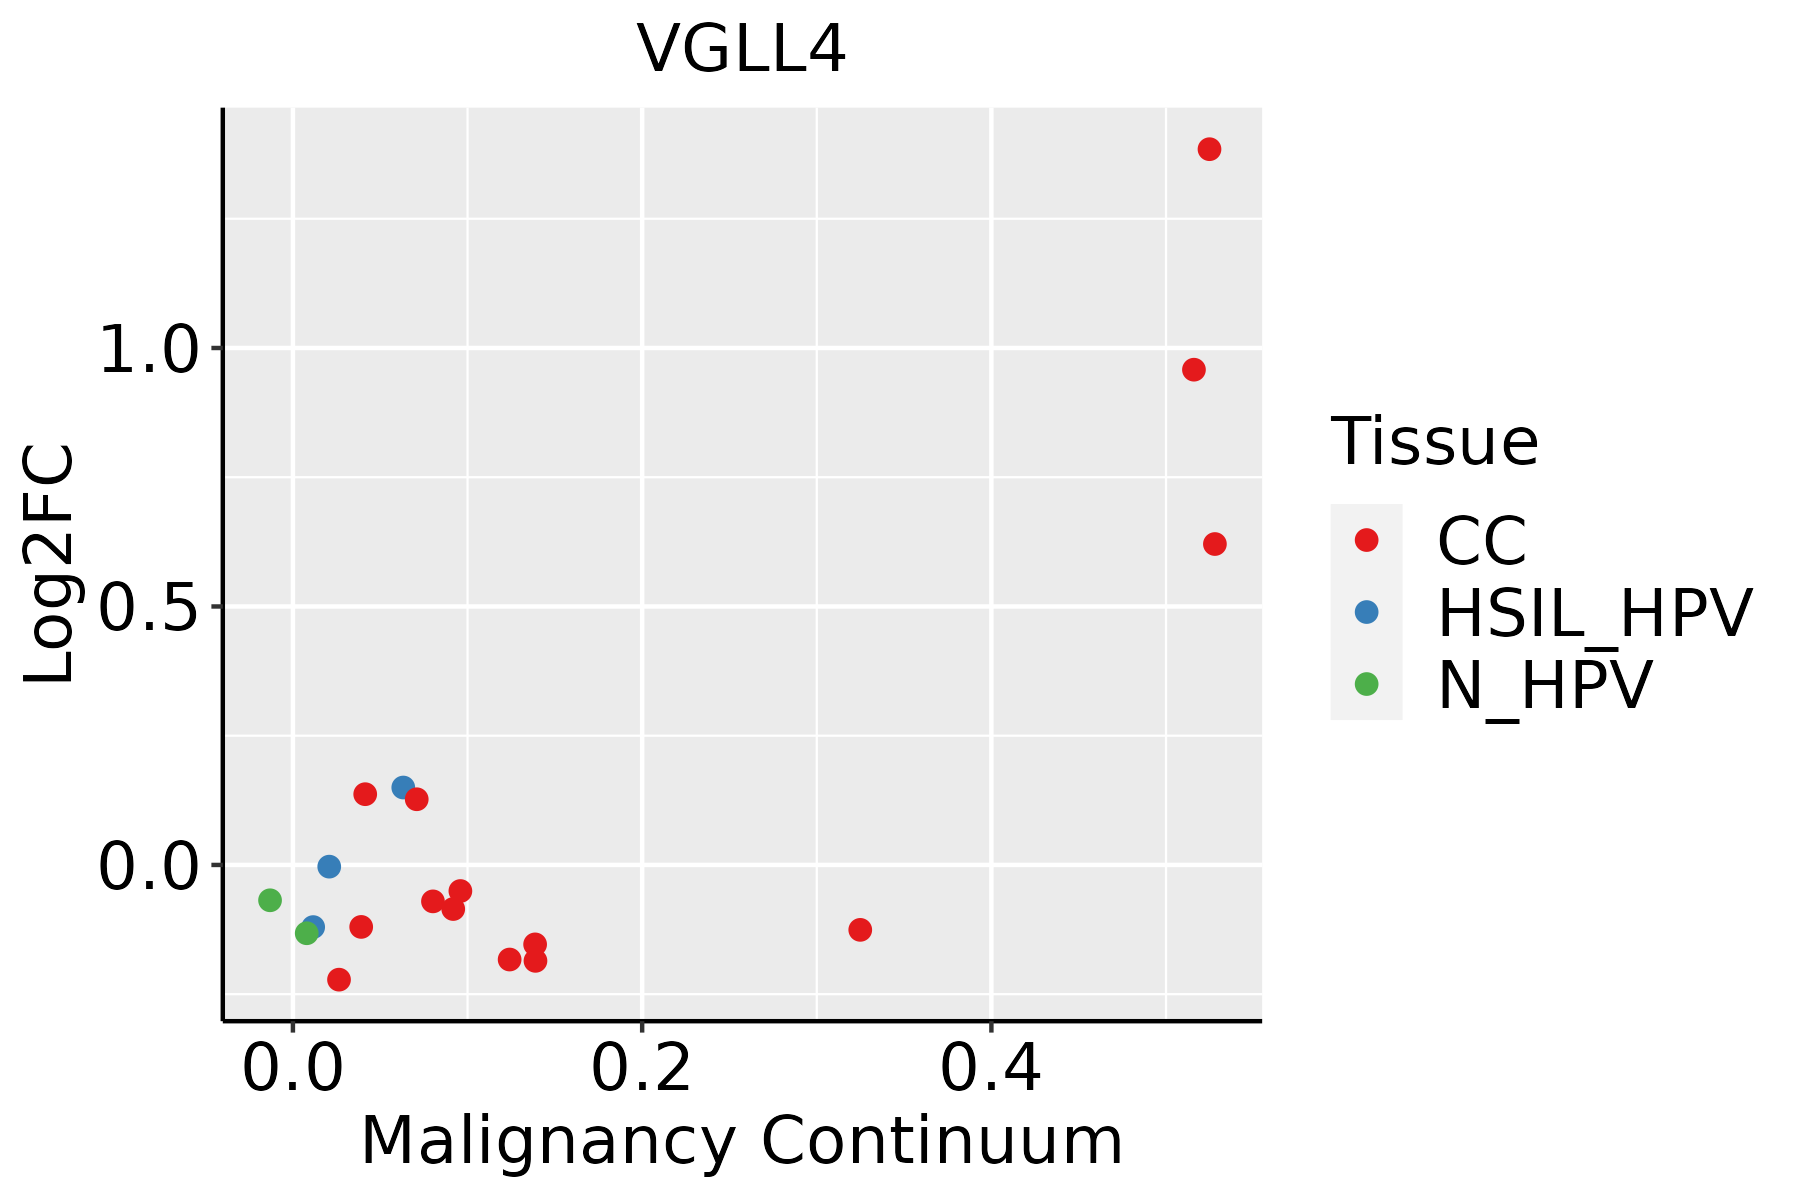 | CC: Cervix cancer |
| HSIL_HPV: HPV-infected high-grade squamous intraepithelial lesions | ||
| N_HPV: HPV-infected normal cervix | ||
| Colorectum (GSE201348) | 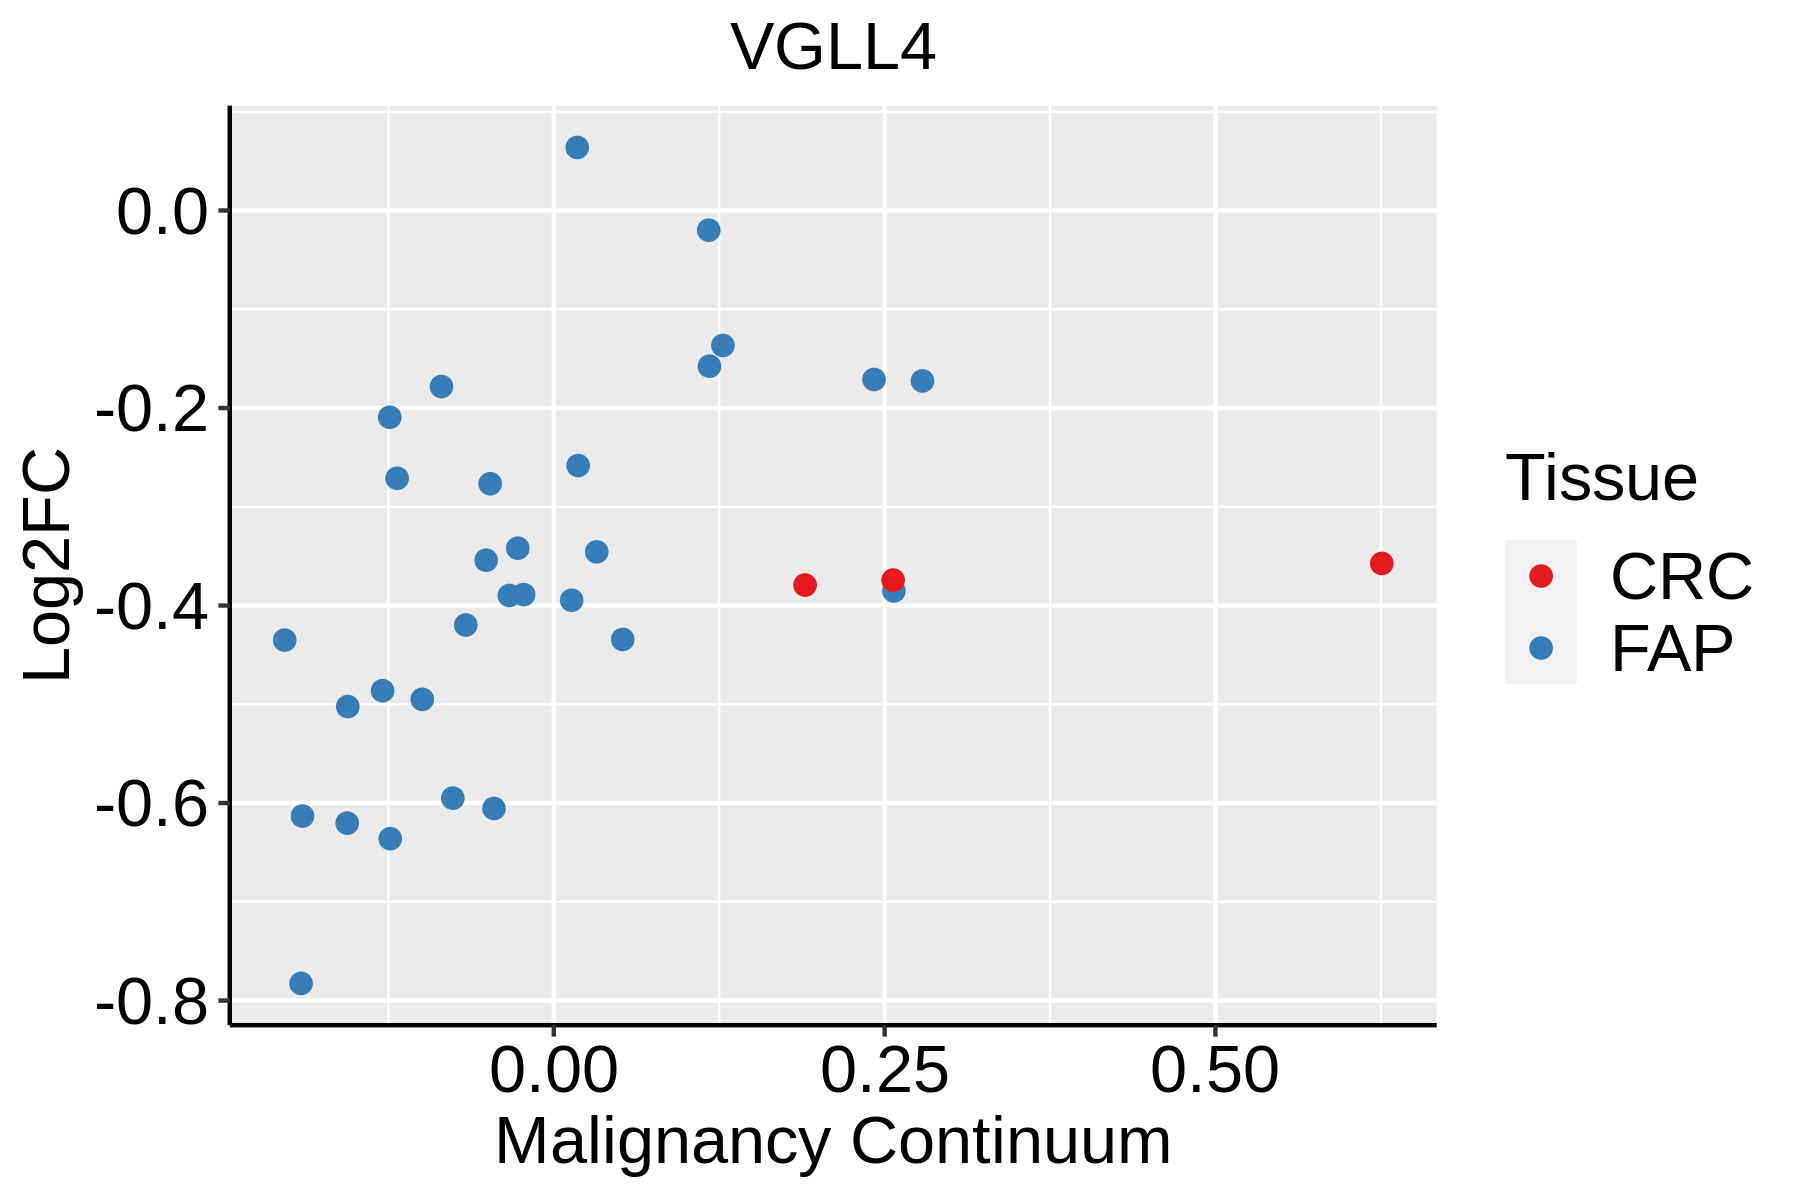 | FAP: Familial adenomatous polyposis |
| CRC: Colorectal cancer | ||
| Colorectum (HTA11) |  | AD: Adenomas |
| SER: Sessile serrated lesions | ||
| MSI-H: Microsatellite-high colorectal cancer | ||
| MSS: Microsatellite stable colorectal cancer | ||
| Esophagus | 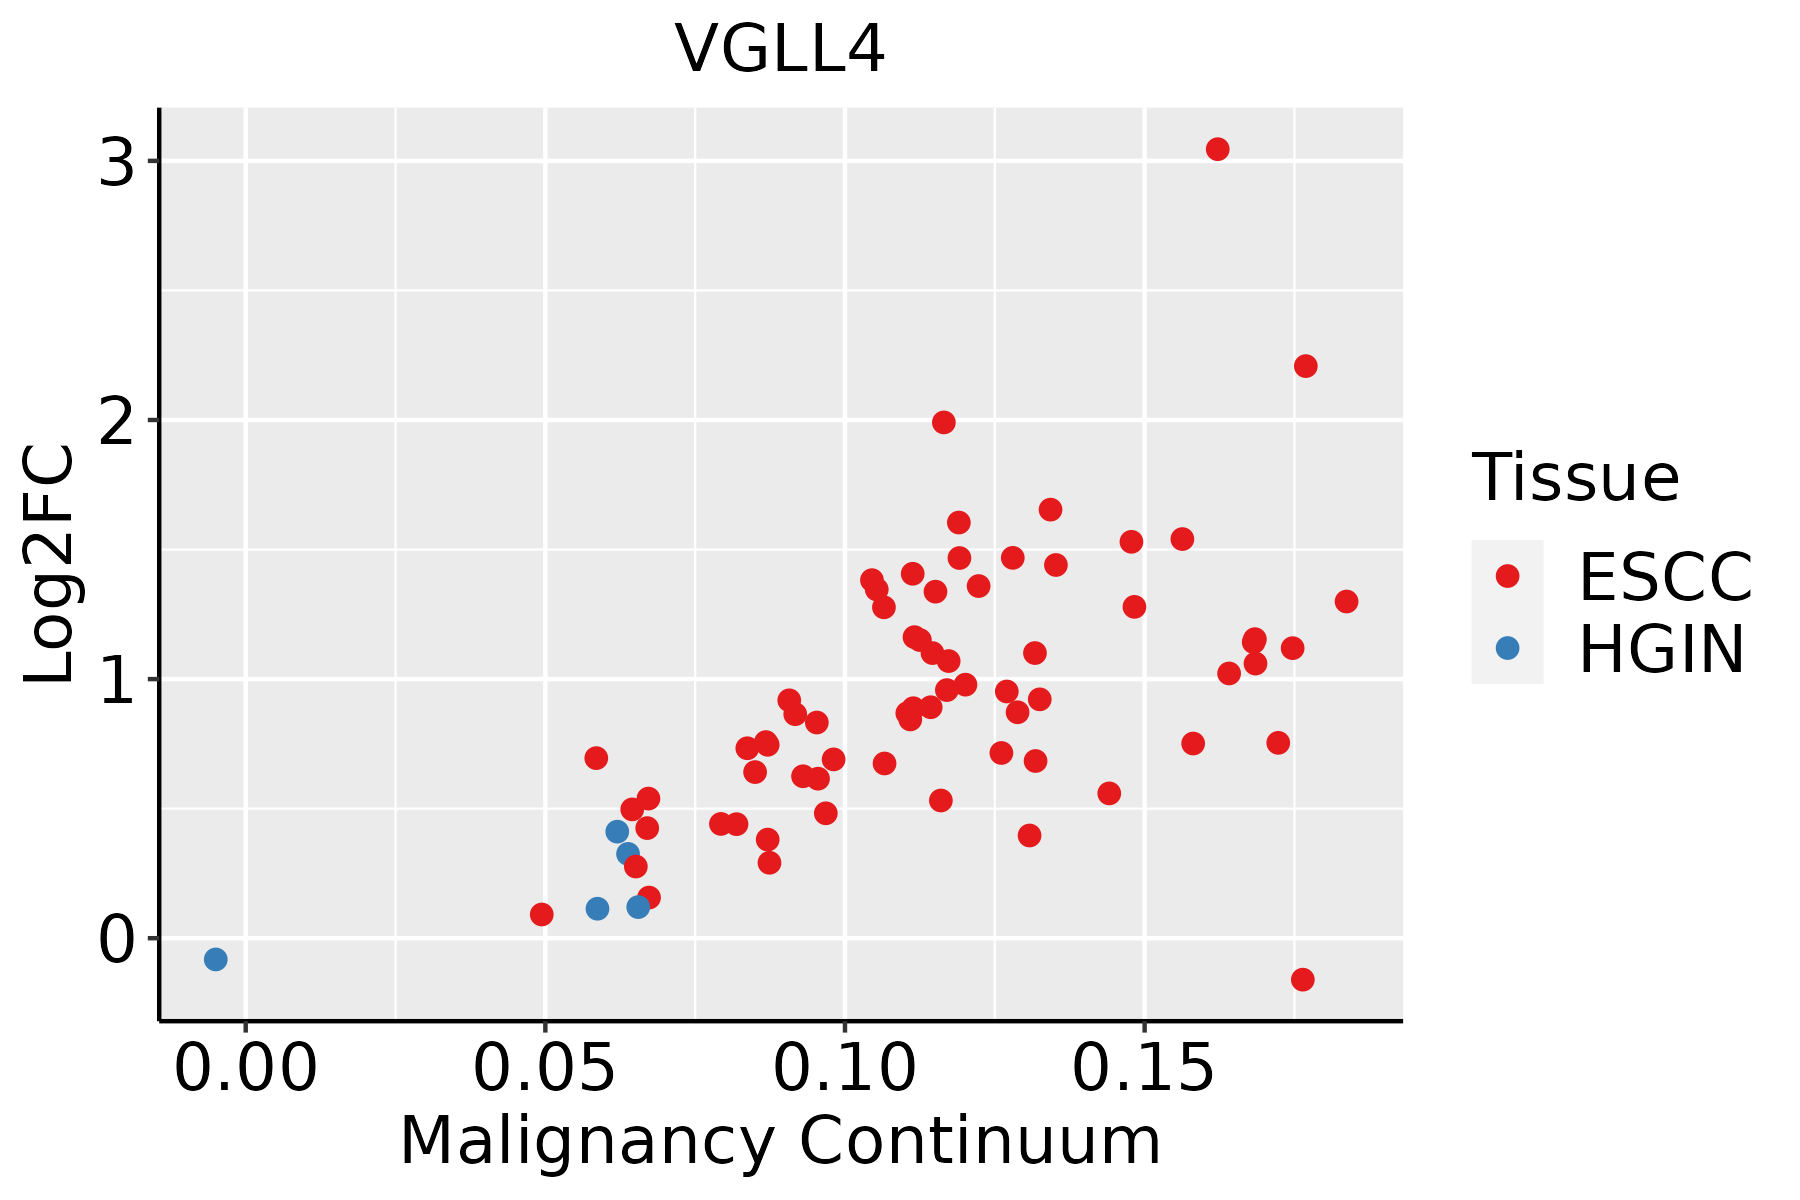 | ESCC: Esophageal squamous cell carcinoma |
| HGIN: High-grade intraepithelial neoplasias | ||
| LGIN: Low-grade intraepithelial neoplasias | ||
| Liver | 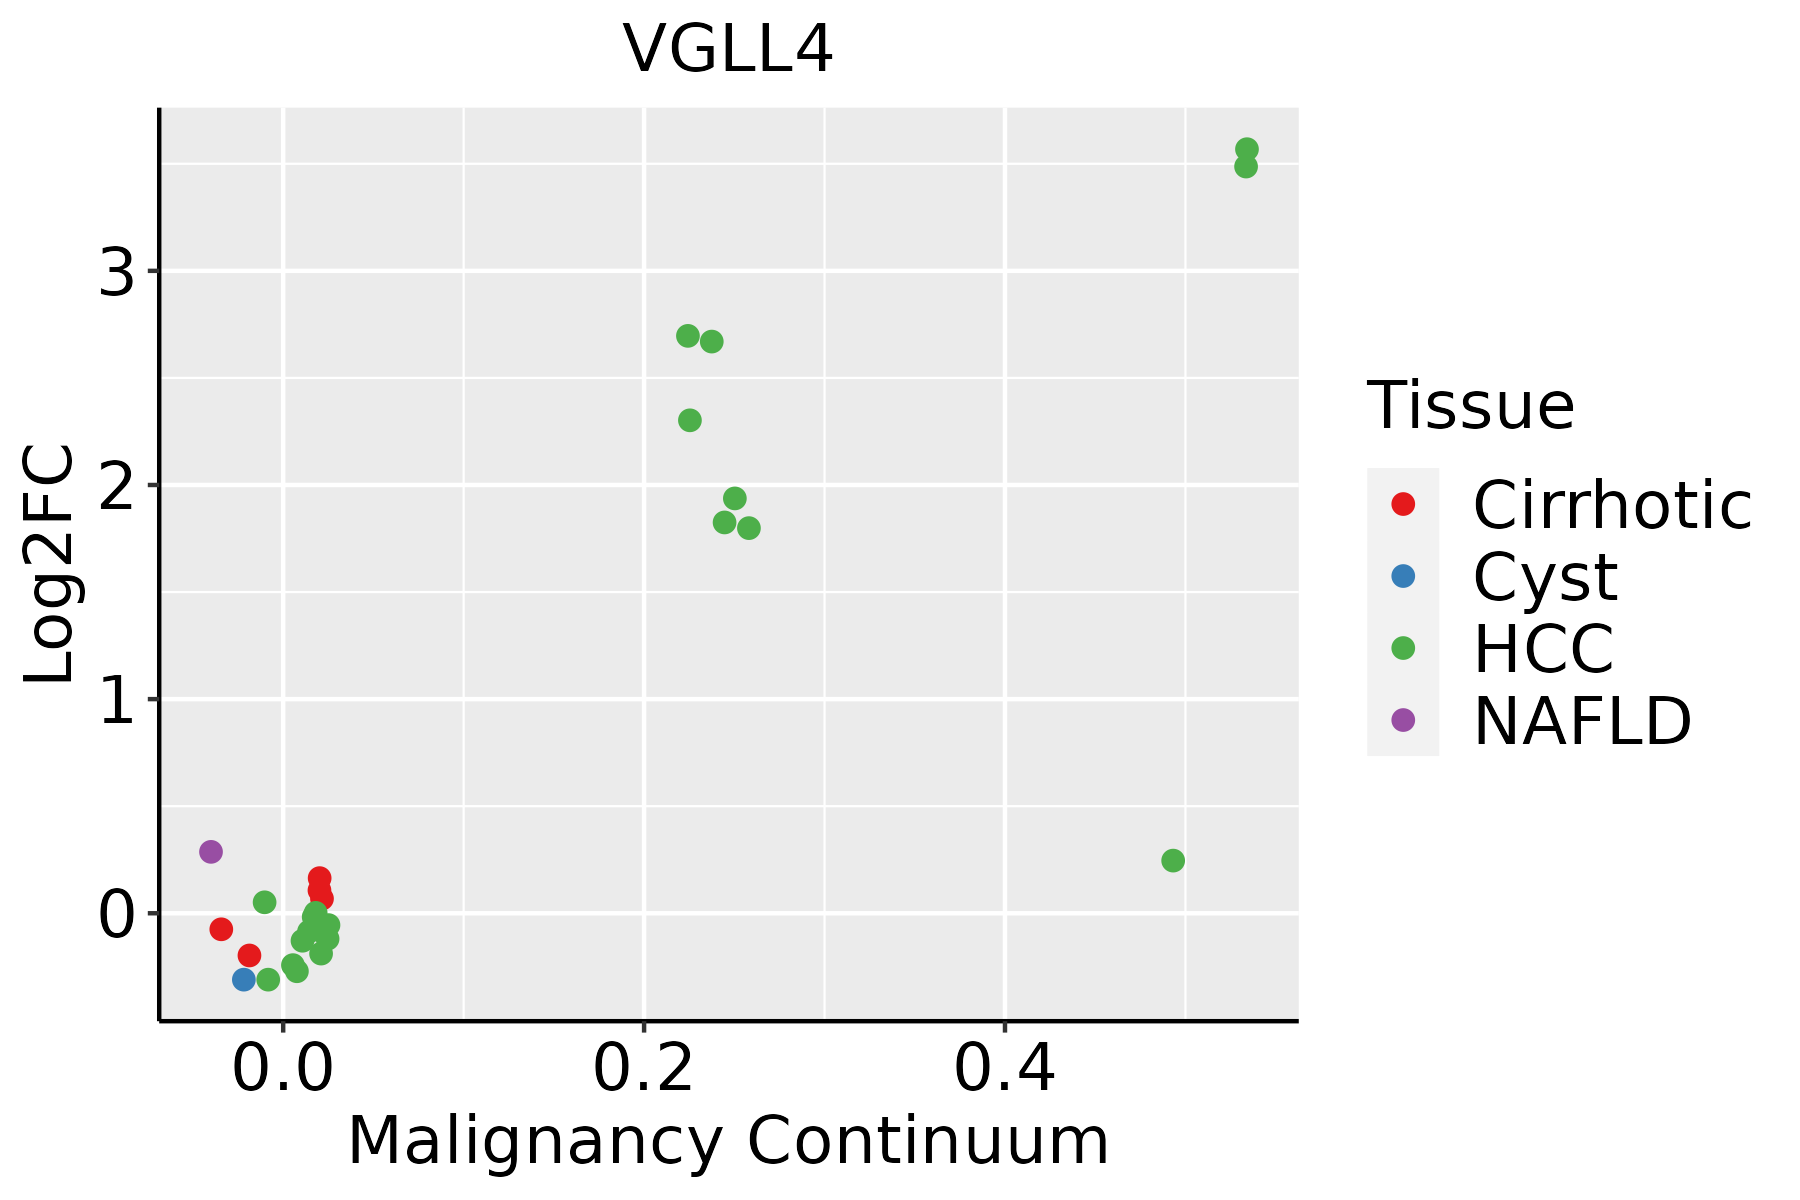 | HCC: Hepatocellular carcinoma |
| NAFLD: Non-alcoholic fatty liver disease | ||
| Lung |  | AAH: Atypical adenomatous hyperplasia |
| AIS: Adenocarcinoma in situ | ||
| IAC: Invasive lung adenocarcinoma | ||
| MIA: Minimally invasive adenocarcinoma | ||
| Oral Cavity | 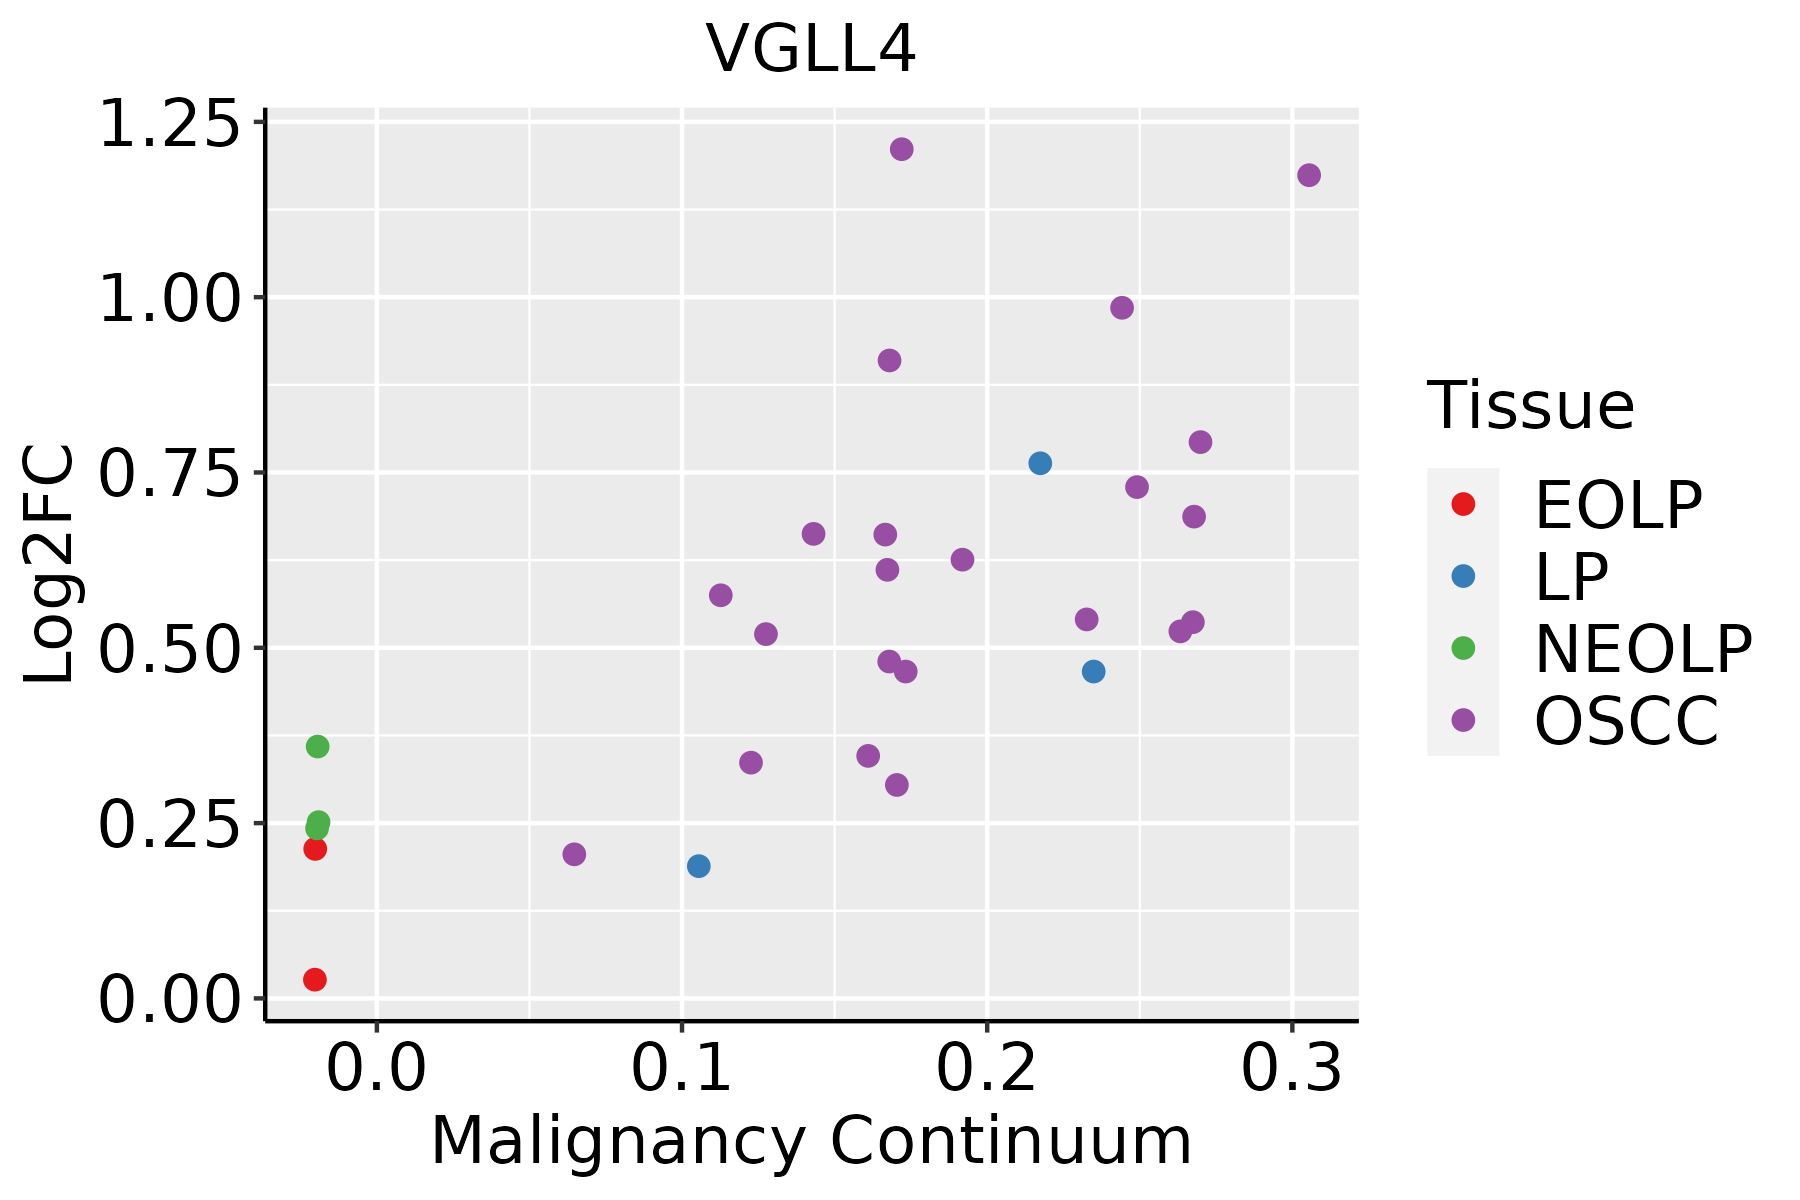 | EOLP: Erosive Oral lichen planus |
| LP: leukoplakia | ||
| NEOLP: Non-erosive oral lichen planus | ||
| OSCC: Oral squamous cell carcinoma | ||
| Skin | 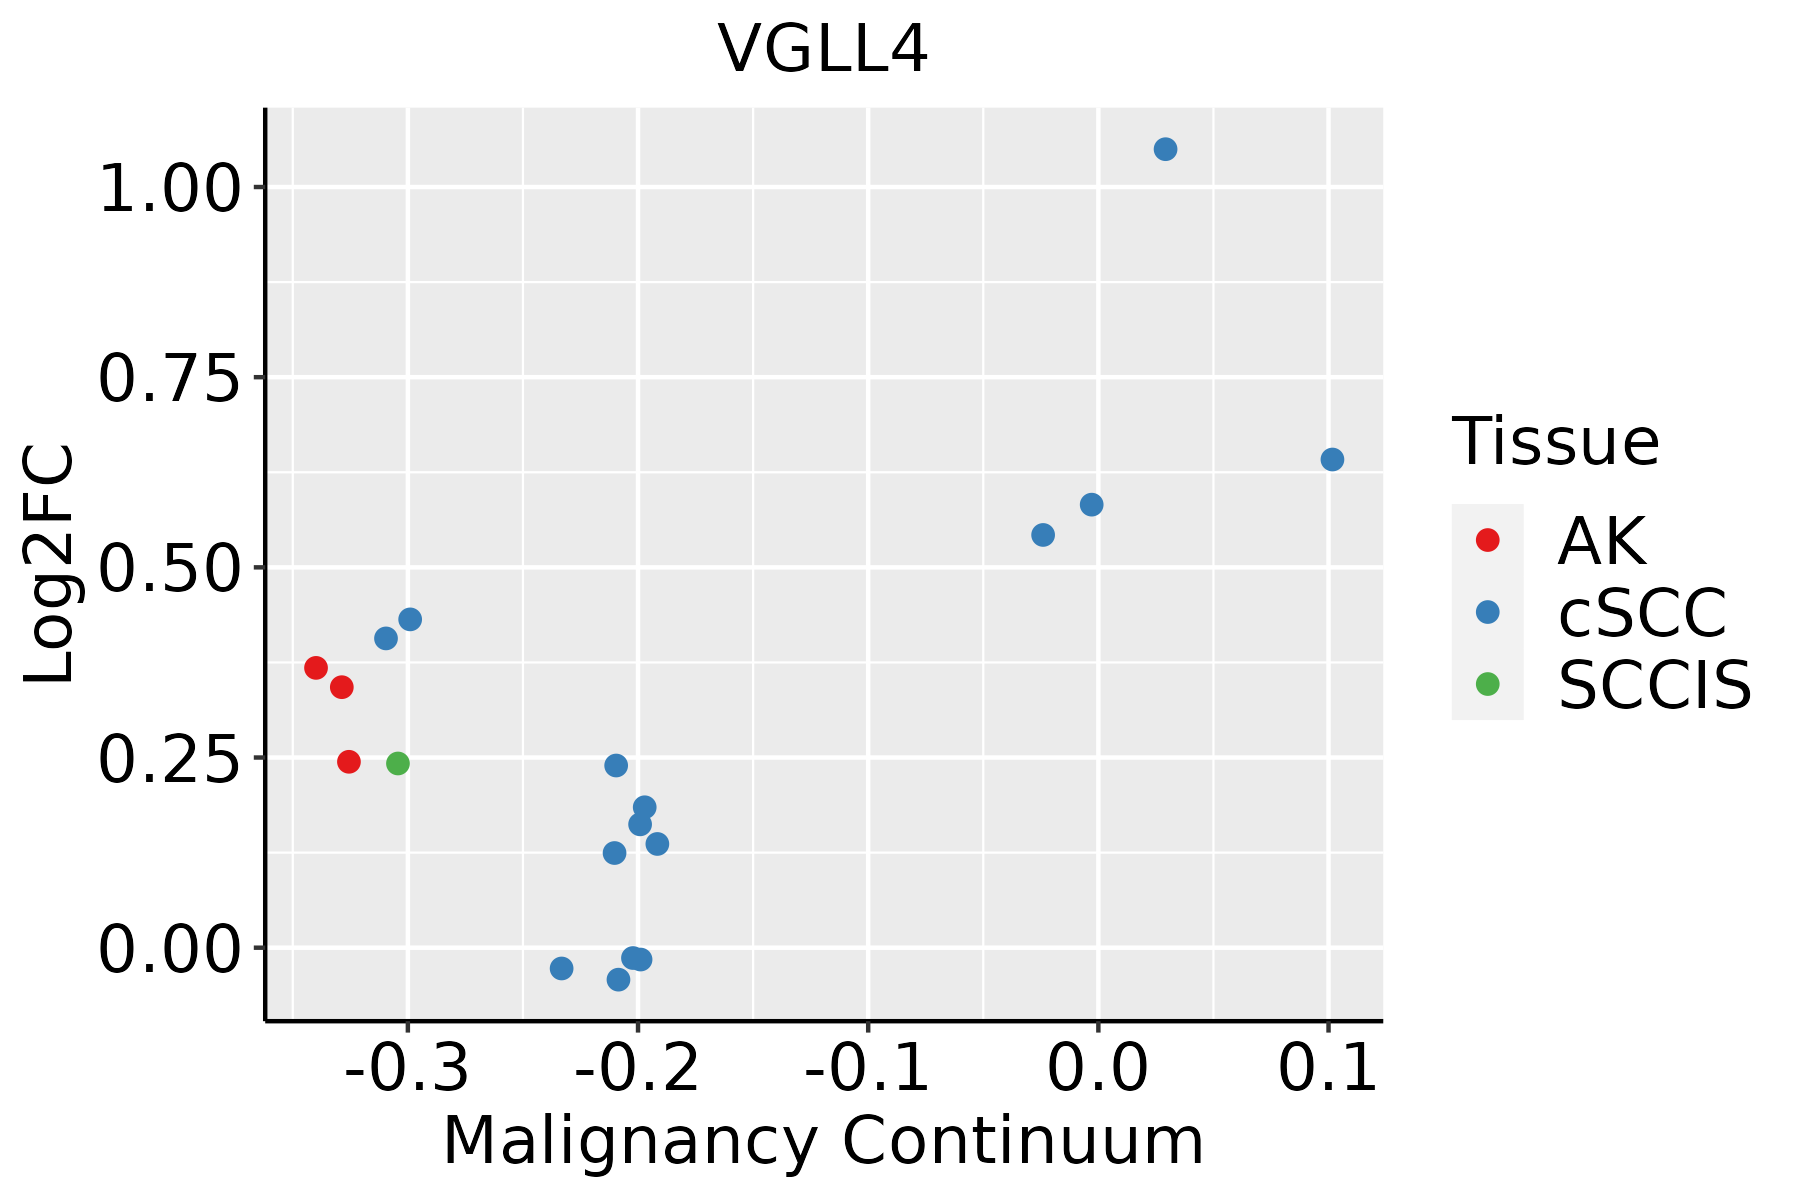 | AK: Actinic keratosis |
| cSCC: Cutaneous squamous cell carcinoma | ||
| SCCIS:squamous cell carcinoma in situ | ||
| Thyroid | 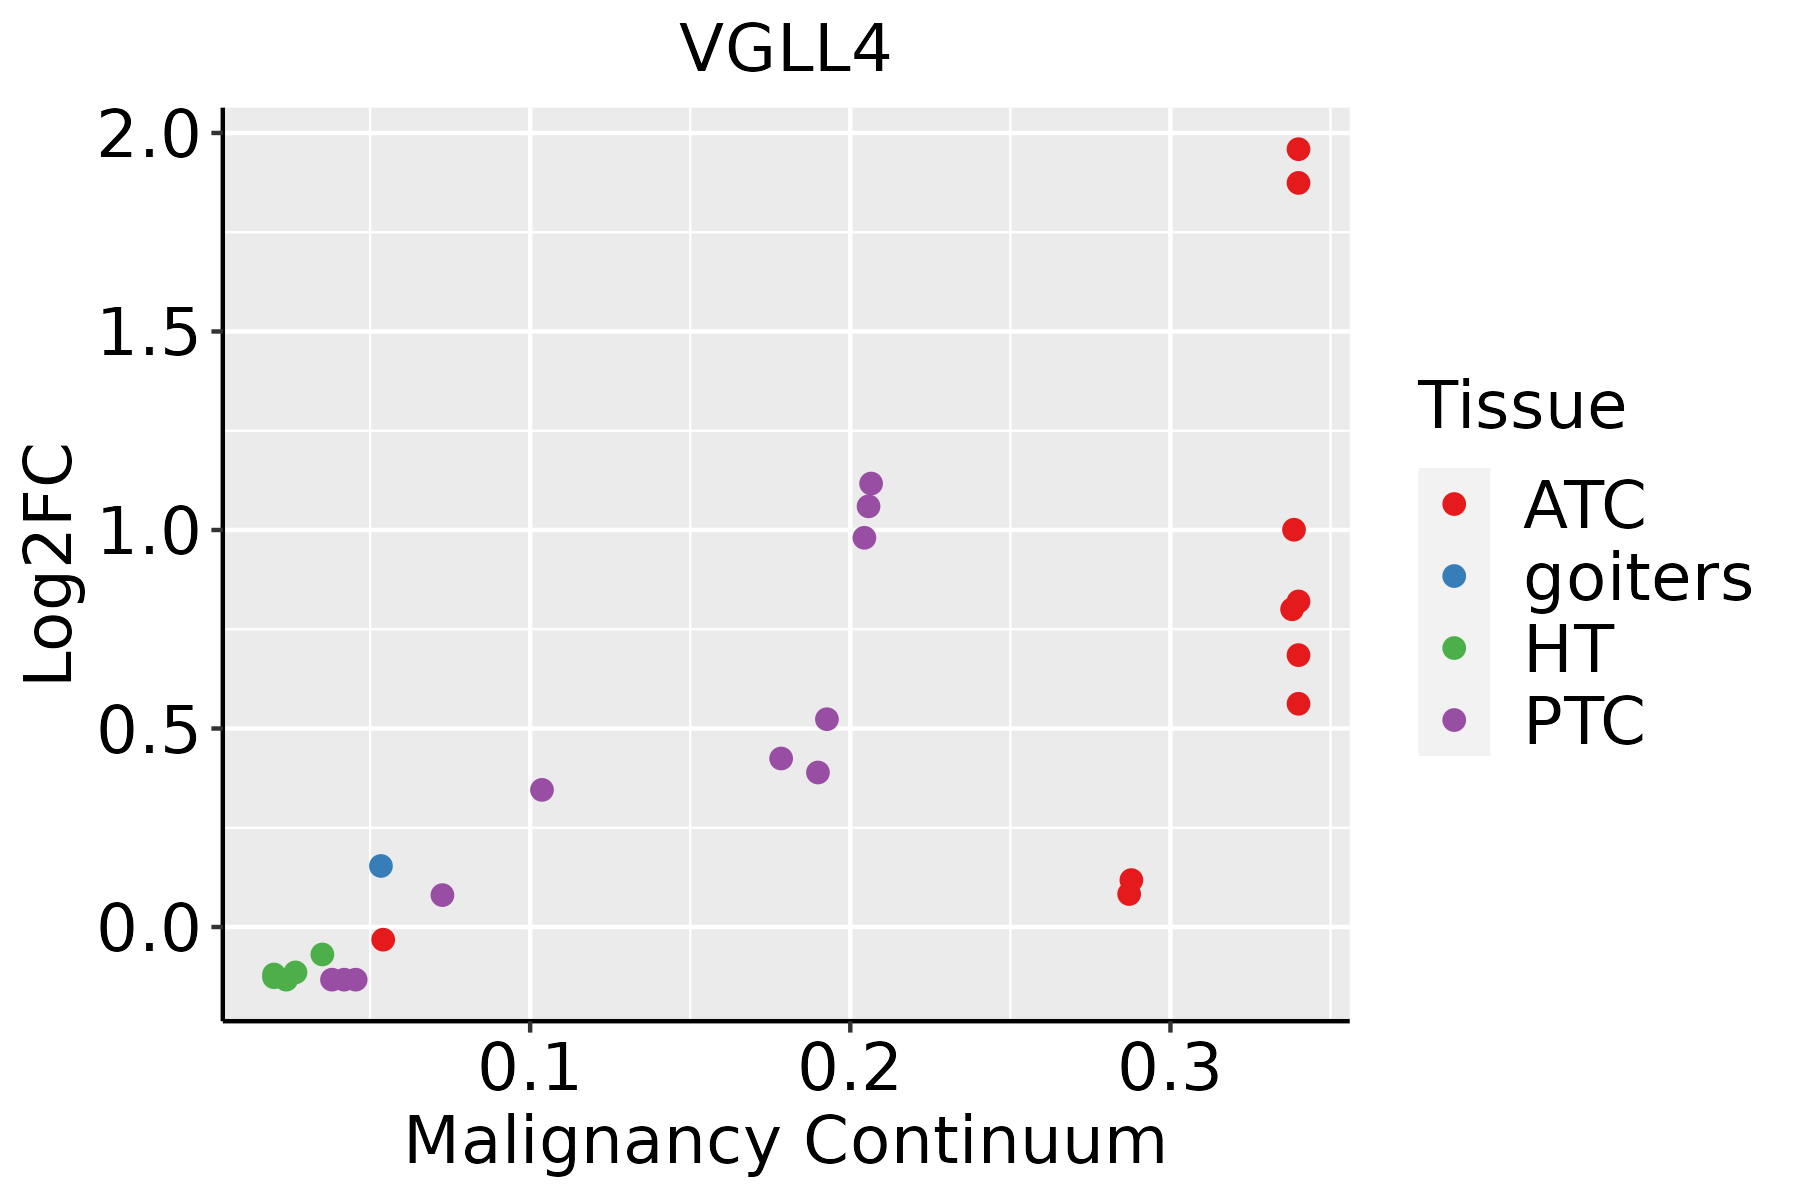 | ATC: Anaplastic thyroid cancer |
| HT: Hashimoto's thyroiditis | ||
| PTC: Papillary thyroid cancer |
| ∗log2FC in expression of this searched gene in stem-like cells from each diseased tissue sample relative to stem-like cells in normal samples in each tissue plotted against the malignancy continuum. Samples are colored based on if they are from different disease stage. |
Top |
Malignant transformation related pathway analysis |
| Find out the enriched GO biological processes and KEGG pathways involved in transition from healthy to precancer to cancer |
| Tissue | Disease Stage | Enriched GO biological Processes |
| Colorectum | AD |  |
| Colorectum | SER |  |
| Colorectum | MSS |  |
| Colorectum | MSI-H |  |
| Colorectum | FAP |  |
| ∗Top 15 enriched GO BP terms are showed in the bar plot of each disease state in each tissue. Each row represents a significant GO biological process which is colored according to the -log10(p.adjust). |
| Page: 1 2 3 4 5 6 7 8 9 |
| GO ID | Tissue | Disease Stage | Description | Gene Ratio | Bg Ratio | pvalue | p.adjust | Count |
| GO:004217610 | Cervix | CC | regulation of protein catabolic process | 104/2311 | 391/18723 | 9.39e-15 | 9.36e-12 | 104 |
| GO:190336210 | Cervix | CC | regulation of cellular protein catabolic process | 72/2311 | 255/18723 | 5.98e-12 | 2.10e-09 | 72 |
| GO:004573210 | Cervix | CC | positive regulation of protein catabolic process | 65/2311 | 231/18723 | 7.44e-11 | 1.39e-08 | 65 |
| GO:000989610 | Cervix | CC | positive regulation of catabolic process | 109/2311 | 492/18723 | 5.26e-10 | 6.99e-08 | 109 |
| GO:00160557 | Cervix | CC | Wnt signaling pathway | 98/2311 | 444/18723 | 4.82e-09 | 4.65e-07 | 98 |
| GO:01987387 | Cervix | CC | cell-cell signaling by wnt | 98/2311 | 446/18723 | 6.16e-09 | 5.58e-07 | 98 |
| GO:00301117 | Cervix | CC | regulation of Wnt signaling pathway | 76/2311 | 328/18723 | 3.05e-08 | 2.08e-06 | 76 |
| GO:003133110 | Cervix | CC | positive regulation of cellular catabolic process | 91/2311 | 427/18723 | 9.64e-08 | 5.25e-06 | 91 |
| GO:190336410 | Cervix | CC | positive regulation of cellular protein catabolic process | 43/2311 | 155/18723 | 1.80e-07 | 8.28e-06 | 43 |
| GO:00160498 | Cervix | CC | cell growth | 92/2311 | 482/18723 | 1.16e-05 | 2.49e-04 | 92 |
| GO:00605375 | Cervix | CC | muscle tissue development | 76/2311 | 403/18723 | 9.76e-05 | 1.27e-03 | 76 |
| GO:00015588 | Cervix | CC | regulation of cell growth | 77/2311 | 414/18723 | 1.40e-04 | 1.70e-03 | 77 |
| GO:00147064 | Cervix | CC | striated muscle tissue development | 72/2311 | 384/18723 | 1.76e-04 | 2.07e-03 | 72 |
| GO:0033002 | Cervix | CC | muscle cell proliferation | 49/2311 | 248/18723 | 5.43e-04 | 5.24e-03 | 49 |
| GO:00486386 | Cervix | CC | regulation of developmental growth | 61/2311 | 330/18723 | 7.69e-04 | 6.85e-03 | 61 |
| GO:00301784 | Cervix | CC | negative regulation of Wnt signaling pathway | 35/2311 | 170/18723 | 1.52e-03 | 1.17e-02 | 35 |
| GO:00353294 | Cervix | CC | hippo signaling | 12/2311 | 40/18723 | 2.44e-03 | 1.71e-02 | 12 |
| GO:0014855 | Cervix | CC | striated muscle cell proliferation | 18/2311 | 76/18723 | 4.45e-03 | 2.71e-02 | 18 |
| GO:00353301 | Cervix | CC | regulation of hippo signaling | 7/2311 | 21/18723 | 1.04e-02 | 4.97e-02 | 7 |
| GO:0042176 | Colorectum | AD | regulation of protein catabolic process | 160/3918 | 391/18723 | 1.06e-19 | 7.34e-17 | 160 |
| Page: 1 2 3 4 5 6 7 8 9 10 11 12 13 14 15 |
| Pathway ID | Tissue | Disease Stage | Description | Gene Ratio | Bg Ratio | pvalue | p.adjust | qvalue | Count |
| Page: 1 |
Top |
Cell-cell communication analysis |
| Identification of potential cell-cell interactions between two cell types and their ligand-receptor pairs for different disease states |
| Ligand | Receptor | LRpair | Pathway | Tissue | Disease Stage |
| Page: 1 |
Top |
Single-cell gene regulatory network inference analysis |
| Find out the significant the regulons (TFs) and the target genes of each regulon across cell types for different disease states |
| TF | Cell Type | Tissue | Disease Stage | Target Gene | RSS | Regulon Activity |
| ∗The dot plots of a searched regulon are shown for all cell subpopulations in each disease state of each tissue based on the regulon specific score inferred using pySCENIC and by calculating the average expression. |
| Page: 1 |
Top |
Somatic mutation of malignant transformation related genes |
| Annotation of somatic variants for genes involved in malignant transformation |
| Hugo Symbol | Variant Class | Variant Classification | dbSNP RS | HGVSc | HGVSp | HGVSp Short | SWISSPROT | BIOTYPE | SIFT | PolyPhen | Tumor Sample Barcode | Tissue | Histology | Sex | Age | Stage | Therapy Types | Drugs | Outcome |
| VGLL4 | SNV | Missense_Mutation | novel | c.77A>G | p.His26Arg | p.H26R | protein_coding | deleterious(0.03) | benign(0) | TCGA-AC-A62Y-01 | Breast | breast invasive carcinoma | Female | >=65 | I/II | Unknown | Unknown | SD | |
| VGLL4 | deletion | Frame_Shift_Del | novel | c.540_577delNNNNNNNNNNNNNNNNNNNNNNNNNNNNNNNNNNNNNN | p.Asn180LysfsTer20 | p.N180Kfs*20 | protein_coding | TCGA-B6-A409-01 | Breast | breast invasive carcinoma | Female | <65 | III/IV | Chemotherapy | cyclophosphamide | PD | |||
| VGLL4 | SNV | Missense_Mutation | c.717N>G | p.Ile239Met | p.I239M | protein_coding | deleterious(0) | probably_damaging(0.999) | TCGA-IR-A3LL-01 | Cervix | cervical & endocervical cancer | Female | <65 | I/II | Chemotherapy | cisplatin | CR | ||
| VGLL4 | SNV | Missense_Mutation | novel | c.26N>G | p.Ser9Cys | p.S9C | protein_coding | deleterious(0.01) | probably_damaging(0.952) | TCGA-MA-AA3Y-01 | Cervix | cervical & endocervical cancer | Female | <65 | I/II | Unknown | Unknown | SD | |
| VGLL4 | SNV | Missense_Mutation | novel | c.506C>T | p.Ser169Phe | p.S169F | protein_coding | deleterious(0) | probably_damaging(0.977) | TCGA-VS-A8QA-01 | Cervix | cervical & endocervical cancer | Female | <65 | I/II | Unknown | Unknown | SD | |
| VGLL4 | SNV | Missense_Mutation | rs757243456 | c.338N>A | p.Arg113His | p.R113H | protein_coding | tolerated(0.3) | probably_damaging(0.984) | TCGA-A6-5665-01 | Colorectum | colon adenocarcinoma | Female | >=65 | I/II | Unknown | Unknown | PD | |
| VGLL4 | SNV | Missense_Mutation | c.640N>A | p.Val214Met | p.V214M | protein_coding | deleterious(0) | probably_damaging(0.999) | TCGA-AA-3663-01 | Colorectum | colon adenocarcinoma | Male | <65 | I/II | Unknown | Unknown | SD | ||
| VGLL4 | SNV | Missense_Mutation | c.509N>C | p.Val170Ala | p.V170A | protein_coding | deleterious(0) | possibly_damaging(0.744) | TCGA-AA-3663-01 | Colorectum | colon adenocarcinoma | Male | <65 | I/II | Unknown | Unknown | SD | ||
| VGLL4 | SNV | Missense_Mutation | rs112232182 | c.299N>A | p.Arg100His | p.R100H | protein_coding | deleterious(0.04) | probably_damaging(0.97) | TCGA-AA-3984-01 | Colorectum | colon adenocarcinoma | Female | <65 | I/II | Unknown | Unknown | SD | |
| VGLL4 | SNV | Missense_Mutation | rs770798622 | c.487N>T | p.Arg163Trp | p.R163W | protein_coding | deleterious(0) | probably_damaging(0.96) | TCGA-AA-A022-01 | Colorectum | colon adenocarcinoma | Female | >=65 | I/II | Unknown | Unknown | SD |
| Page: 1 2 3 4 |
Top |
Related drugs of malignant transformation related genes |
| Identification of chemicals and drugs interact with genes involved in malignant transfromation |
| (DGIdb 4.0) |
| Entrez ID | Symbol | Category | Interaction Types | Drug Claim Name | Drug Name | PMIDs |
| Page: 1 |

Copyright 2023-Present -The University of Texas Health Science Center at Houston |