Schematic overview of the cellular and molecular mechanisms involved in the cancer progression, including the proposed cellular and molecular mechanisms in cancer cells trajectory. AT1: alveolar type 1 cells; AT2: alveolar type 2 cells; AAH: atypical adenomatous hyperplasia; AIS: adenocarcinoma in situ; MIA: minimally invasive adenocarcinoma; IA: invasive adenocarcinoma; EMT: epithelial-mesenchymal transition

Home

Download

Statistics

Help

Contact

Center for Computational Systems Medicine
leaf

Gene summary

leaf

Malignant transformation analysis

leaf

Malignant transformation related pathway analysis

leaf

Cell-cell communication analysis

leaf

Single-cell gene regulatory network inference analysis

leaf

Somatic mutation of malignant transformation related genes

leaf

Related drugs of malignant transformation related genes

Gene: USP6NL

Gene summary for USP6NL

check button Gene summary.

Gene informationSpeciesHuman
Gene symbol

USP6NL

Gene ID

9712

Gene nameUSP6 N-terminal like
Gene AliasRNTRE
Cytomap10p14
Gene Typeprotein-coding
GO ID

GO:0006810

UniProtAcc

Q92738


Top

Malignant transformation analysis

check button Identification of the aberrant gene expression in precancerous and cancerous lesions by comparing the gene expression of stem-like cells in diseased tissues with normal stem cells
check button Malignant transformation involving gene list.
Entrez IDSymbolReplicatesSpeciesOrganTissueAdj P-valueLog2FCMalignancy
9712USP6NLLZE24THumanEsophagusESCC9.90e-122.82e-010.0596
9712USP6NLP1T-EHumanEsophagusESCC1.79e-106.50e-010.0875
9712USP6NLP2T-EHumanEsophagusESCC8.61e-171.86e-010.1177
9712USP6NLP4T-EHumanEsophagusESCC1.04e-204.63e-010.1323
9712USP6NLP5T-EHumanEsophagusESCC7.03e-132.88e-010.1327
9712USP6NLP8T-EHumanEsophagusESCC9.23e-253.18e-010.0889
9712USP6NLP9T-EHumanEsophagusESCC2.56e-112.36e-010.1131
9712USP6NLP10T-EHumanEsophagusESCC1.14e-136.43e-020.116
9712USP6NLP12T-EHumanEsophagusESCC1.36e-243.38e-010.1122
9712USP6NLP15T-EHumanEsophagusESCC1.62e-132.65e-010.1149
9712USP6NLP16T-EHumanEsophagusESCC4.82e-181.73e-010.1153
9712USP6NLP20T-EHumanEsophagusESCC6.29e-061.17e-010.1124
9712USP6NLP21T-EHumanEsophagusESCC2.04e-201.96e-010.1617
9712USP6NLP22T-EHumanEsophagusESCC1.45e-161.37e-010.1236
9712USP6NLP23T-EHumanEsophagusESCC2.87e-153.65e-010.108
9712USP6NLP24T-EHumanEsophagusESCC5.25e-212.00e-010.1287
9712USP6NLP26T-EHumanEsophagusESCC4.70e-345.04e-010.1276
9712USP6NLP27T-EHumanEsophagusESCC3.93e-254.73e-010.1055
9712USP6NLP28T-EHumanEsophagusESCC7.76e-304.75e-010.1149
9712USP6NLP30T-EHumanEsophagusESCC2.64e-154.88e-010.137
Page: 1 2 3 4 5 

check button Transcriptomic changes along malignancy continuum.
TissueExpression DynamicsAbbreviation
CervixThe image shows the transcriptomic changes along malignancy continuum.log2FC in expression of this searched gene in stem-like cells from each diseased tissue sample relative to stem-like cells in normal samples in each tissue plotted against the malignancy continuum. Samples are colored based on if they are from different disease stage.CC: Cervix cancer
HSIL_HPV: HPV-infected high-grade squamous intraepithelial lesions
N_HPV: HPV-infected normal cervix
EndometriumThe image shows the transcriptomic changes along malignancy continuum.log2FC in expression of this searched gene in stem-like cells from each diseased tissue sample relative to stem-like cells in normal samples in each tissue plotted against the malignancy continuum. Samples are colored based on if they are from different disease stage.AEH: Atypical endometrial hyperplasia
EEC: Endometrioid Cancer
EsophagusThe image shows the transcriptomic changes along malignancy continuum.log2FC in expression of this searched gene in stem-like cells from each diseased tissue sample relative to stem-like cells in normal samples in each tissue plotted against the malignancy continuum. Samples are colored based on if they are from different disease stage.
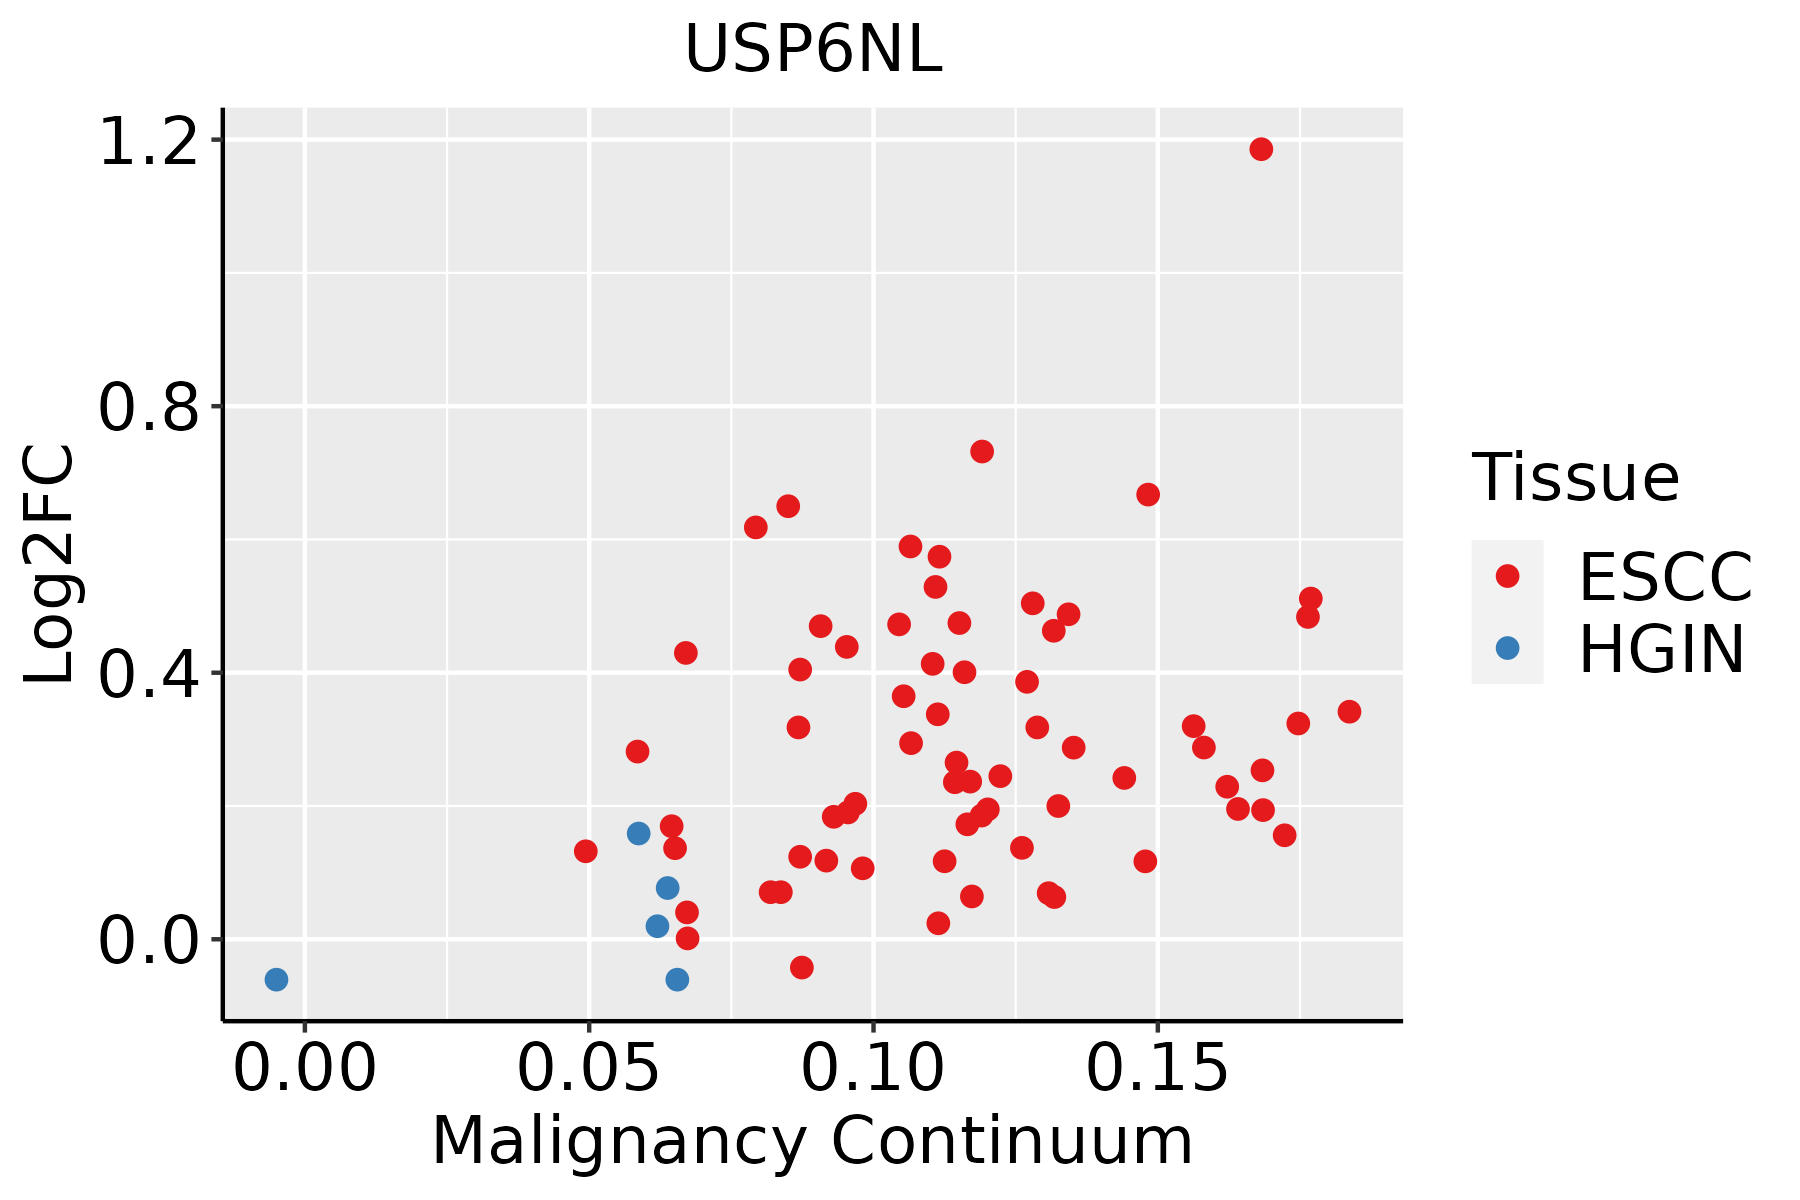
ESCC: Esophageal squamous cell carcinoma
HGIN: High-grade intraepithelial neoplasias
LGIN: Low-grade intraepithelial neoplasias
LiverThe image shows the transcriptomic changes along malignancy continuum.log2FC in expression of this searched gene in stem-like cells from each diseased tissue sample relative to stem-like cells in normal samples in each tissue plotted against the malignancy continuum. Samples are colored based on if they are from different disease stage.
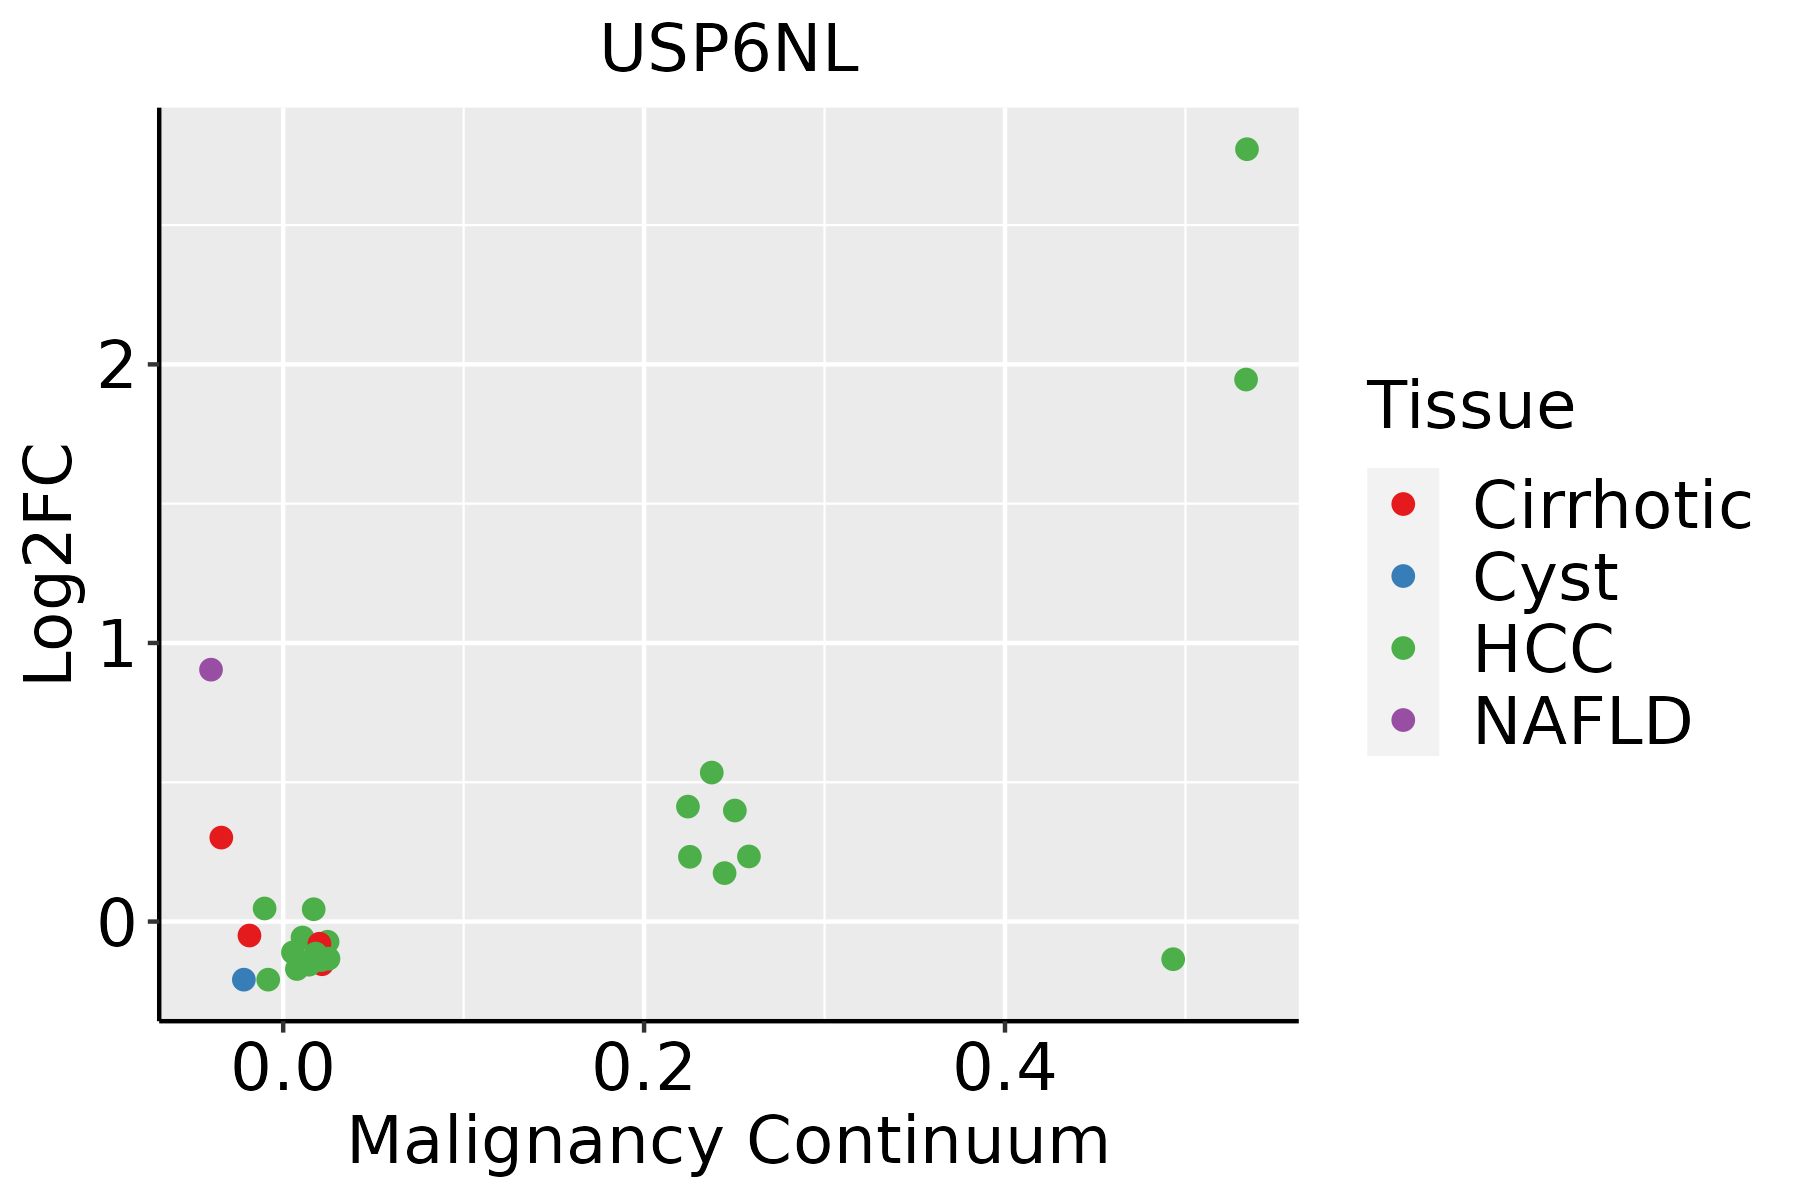
HCC: Hepatocellular carcinoma
NAFLD: Non-alcoholic fatty liver disease
LungThe image shows the transcriptomic changes along malignancy continuum.log2FC in expression of this searched gene in stem-like cells from each diseased tissue sample relative to stem-like cells in normal samples in each tissue plotted against the malignancy continuum. Samples are colored based on if they are from different disease stage.
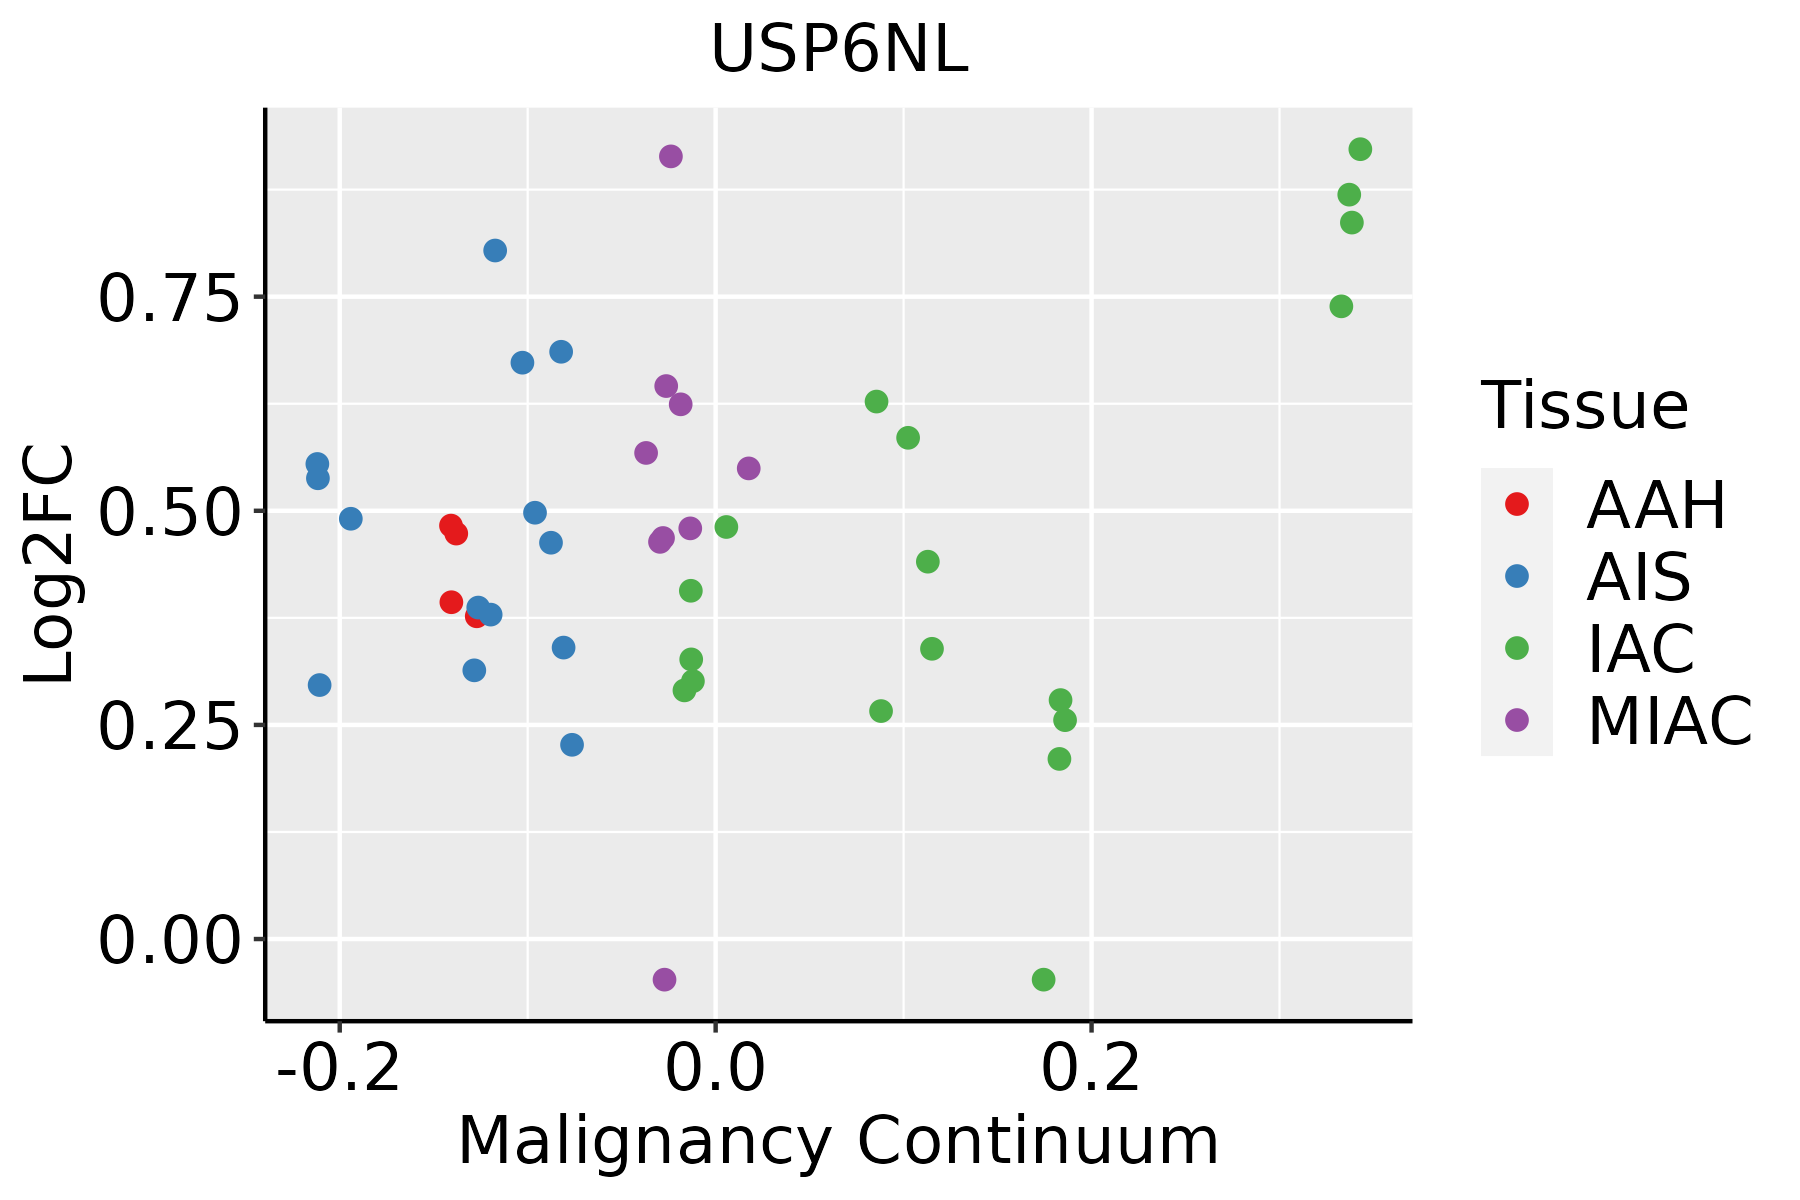
AAH: Atypical adenomatous hyperplasia
AIS: Adenocarcinoma in situ
IAC: Invasive lung adenocarcinoma
MIA: Minimally invasive adenocarcinoma
∗log2FC in expression of this searched gene in stem-like cells from each diseased tissue sample relative to stem-like cells in normal samples in each tissue plotted against the malignancy continuum. Samples are colored based on if they are from different disease stage.

Top

Malignant transformation related pathway analysis

check buttonFind out the enriched GO biological processes and KEGG pathways involved in transition from healthy to precancer to cancer
check button Figure of enriched GO biological processes.
TissueDisease StageEnriched GO biological Processes
ColorectumADGO analysis - Figure of enriched GO biological processes: Top 15 enriched GO BP terms are showed in the bar plot of each disease state in each tissue. Each row represents a significant GO biological process which is colored according to the -log10(p.adjust).
ColorectumSERGO analysis - Figure of enriched GO biological processes: Top 15 enriched GO BP terms are showed in the bar plot of each disease state in each tissue. Each row represents a significant GO biological process which is colored according to the -log10(p.adjust).
ColorectumMSSGO analysis - Figure of enriched GO biological processes: Top 15 enriched GO BP terms are showed in the bar plot of each disease state in each tissue. Each row represents a significant GO biological process which is colored according to the -log10(p.adjust).
ColorectumMSI-HGO analysis - Figure of enriched GO biological processes: Top 15 enriched GO BP terms are showed in the bar plot of each disease state in each tissue. Each row represents a significant GO biological process which is colored according to the -log10(p.adjust).
ColorectumFAPGO analysis - Figure of enriched GO biological processes: Top 15 enriched GO BP terms are showed in the bar plot of each disease state in each tissue. Each row represents a significant GO biological process which is colored according to the -log10(p.adjust).
∗Top 15 enriched GO BP terms are showed in the bar plot of each disease state in each tissue. Each row represents a significant GO biological process which is colored according to the -log10(p.adjust).
Page: 1 2 3 4 5 6 7 8 9 

check button Enriched GO biological processes.
GO IDTissueDisease StageDescriptionGene RatioBg Ratiopvaluep.adjustCount
GO:001603210CervixCCviral process109/2311415/187235.40e-156.46e-12109
GO:001905810CervixCCviral life cycle87/2311317/187232.20e-131.20e-1087
GO:00430877CervixCCregulation of GTPase activity79/2311348/187234.21e-082.60e-0679
GO:00435476CervixCCpositive regulation of GTPase activity53/2311255/187238.72e-051.16e-0353
GO:19033583CervixCCregulation of Golgi organization7/231117/187232.72e-031.85e-027
GO:00070304CervixCCGolgi organization32/2311157/187232.78e-031.87e-0232
GO:001905815CervixHSIL_HPVviral life cycle35/737317/187233.94e-083.17e-0635
GO:001603215CervixHSIL_HPVviral process41/737415/187236.43e-084.49e-0641
GO:001603216EndometriumAEHviral process110/2100415/187231.99e-181.09e-15110
GO:001905816EndometriumAEHviral life cycle86/2100317/187232.53e-157.58e-1386
GO:00430878EndometriumAEHregulation of GTPase activity66/2100348/187231.26e-052.77e-0466
GO:00435477EndometriumAEHpositive regulation of GTPase activity48/2100255/187232.18e-042.67e-0348
GO:00070305EndometriumAEHGolgi organization32/2100157/187235.73e-045.69e-0332
GO:00906304EndometriumAEHactivation of GTPase activity22/2100115/187238.42e-034.60e-0222
GO:001603217EndometriumEECviral process112/2168415/187232.48e-181.35e-15112
GO:001905817EndometriumEECviral life cycle86/2168317/187231.63e-144.65e-1286
GO:004308712EndometriumEECregulation of GTPase activity67/2168348/187231.84e-053.43e-0467
GO:004354712EndometriumEECpositive regulation of GTPase activity50/2168255/187231.26e-041.66e-0350
GO:000703012EndometriumEECGolgi organization32/2168157/187239.87e-048.76e-0332
GO:009063012EndometriumEECactivation of GTPase activity23/2168115/187236.04e-033.57e-0223
Page: 1 2 3 4 

check button Enriched KEGG pathways.
Pathway IDTissueDisease StageDescriptionGene RatioBg Ratiopvaluep.adjustqvalueCount
Page: 1 

Top

Cell-cell communication analysis

check buttonIdentification of potential cell-cell interactions between two cell types and their ligand-receptor pairs for different disease states
LigandReceptorLRpairPathwayTissueDisease Stage
Page: 1 

Top

Single-cell gene regulatory network inference analysis

check buttonFind out the significant the regulons (TFs) and the target genes of each regulon across cell types for different disease states
TFCell TypeTissueDisease StageTarget GeneRSSRegulon Activity
∗The dot plots of a searched regulon are shown for all cell subpopulations in each disease state of each tissue based on the regulon specific score inferred using pySCENIC and by calculating the average expression.
Page: 1 

Top

Somatic mutation of malignant transformation related genes

check buttonAnnotation of somatic variants for genes involved in malignant transformation
Hugo SymbolVariant ClassVariant ClassificationdbSNP RSHGVScHGVSpHGVSp ShortSWISSPROTBIOTYPESIFTPolyPhenTumor Sample BarcodeTissueHistologySexAgeStageTherapy TypesDrugsOutcome
USP6NLSNVMissense_Mutationc.1697C>Tp.Ser566Leup.S566LQ92738protein_codingdeleterious(0)probably_damaging(0.998)TCGA-AC-A23H-01Breastbreast invasive carcinomaFemale>=65I/IIUnknownUnknownPD
USP6NLSNVMissense_Mutationc.754C>Gp.Gln252Glup.Q252EQ92738protein_codingdeleterious(0.03)probably_damaging(0.943)TCGA-AC-A23H-01Breastbreast invasive carcinomaFemale>=65I/IIUnknownUnknownPD
USP6NLSNVMissense_Mutationc.338N>Ap.Arg113Glnp.R113QQ92738protein_codingdeleterious(0)probably_damaging(0.994)TCGA-AN-A046-01Breastbreast invasive carcinomaFemale>=65I/IIUnknownUnknownSD
USP6NLSNVMissense_Mutationc.1888G>Cp.Ala630Prop.A630PQ92738protein_codingtolerated_low_confidence(1)benign(0)TCGA-D8-A1XK-01Breastbreast invasive carcinomaFemale<65I/IIChemotherapydoxorubicine+cyclophosphamideSD
USP6NLinsertionIn_Frame_Insnovelc.57_58insAACAGGAGATTAAATCATAGAAAGp.Asp19_Ser20insAsnArgArgLeuAsnHisArgLysp.D19_S20insNRRLNHRKQ92738protein_codingTCGA-A8-A07J-01Breastbreast invasive carcinomaFemale<65I/IIChemotherapy5-fluorouracilCR
USP6NLinsertionFrame_Shift_Insnovelc.2236_2237insCCTTTGGATGGAGCAGGTTTGAGACp.Tyr746SerfsTer13p.Y746Sfs*13Q92738protein_codingTCGA-AN-A0FN-01Breastbreast invasive carcinomaFemale<65I/IIUnknownUnknownSD
USP6NLinsertionFrame_Shift_Insnovelc.1156_1157insAGTTACCGTCCCAGGTCCTp.Pro386GlnfsTer14p.P386Qfs*14Q92738protein_codingTCGA-BH-A0HO-01Breastbreast invasive carcinomaFemale<65I/IIChemotherapycyclophosphamideSD
USP6NLinsertionFrame_Shift_Insnovelc.1154_1155insCCCCGCGCTCp.Lys385AsnfsTer12p.K385Nfs*12Q92738protein_codingTCGA-BH-A0HO-01Breastbreast invasive carcinomaFemale<65I/IIChemotherapycyclophosphamideSD
USP6NLSNVMissense_Mutationnovelc.2168G>Tp.Gly723Valp.G723VQ92738protein_codingdeleterious_low_confidence(0.01)benign(0.408)TCGA-2W-A8YY-01Cervixcervical & endocervical cancerFemale<65I/IIChemotherapycisplatinCR
USP6NLSNVMissense_Mutationrs756050004c.1318G>Ap.Gly440Argp.G440RQ92738protein_codingdeleterious(0.05)benign(0.023)TCGA-2W-A8YY-01Cervixcervical & endocervical cancerFemale<65I/IIChemotherapycisplatinCR
Page: 1 2 3 4 5 6 7 8 9 10 

Top

Related drugs of malignant transformation related genes

check buttonIdentification of chemicals and drugs interact with genes involved in malignant transfromation
(DGIdb 4.0)
Entrez IDSymbolCategoryInteraction TypesDrug Claim NameDrug NamePMIDs
Page: 1