
|
|||||
|
 | |
| |
| |
| |
| |
| |
|
Gene: UQCC1 |
Gene summary for UQCC1 |
| Gene information | Species | Human | Gene symbol | UQCC1 | Gene ID | 55245 |
| Gene name | ubiquinol-cytochrome c reductase complex assembly factor 1 | |
| Gene Alias | BFZB | |
| Cytomap | 20q11.22 | |
| Gene Type | protein-coding | GO ID | GO:0006996 | UniProtAcc | Q9NVA1 |
Top |
Malignant transformation analysis |
| Identification of the aberrant gene expression in precancerous and cancerous lesions by comparing the gene expression of stem-like cells in diseased tissues with normal stem cells |
| Entrez ID | Symbol | Replicates | Species | Organ | Tissue | Adj P-value | Log2FC | Malignancy |
| 55245 | UQCC1 | P22T-E | Human | Esophagus | ESCC | 2.29e-12 | 1.84e-01 | 0.1236 |
| 55245 | UQCC1 | P23T-E | Human | Esophagus | ESCC | 4.09e-17 | 3.47e-01 | 0.108 |
| 55245 | UQCC1 | P24T-E | Human | Esophagus | ESCC | 1.80e-04 | 1.85e-01 | 0.1287 |
| 55245 | UQCC1 | P26T-E | Human | Esophagus | ESCC | 2.71e-25 | 4.26e-01 | 0.1276 |
| 55245 | UQCC1 | P27T-E | Human | Esophagus | ESCC | 2.19e-03 | 8.29e-02 | 0.1055 |
| 55245 | UQCC1 | P28T-E | Human | Esophagus | ESCC | 8.74e-06 | 1.36e-01 | 0.1149 |
| 55245 | UQCC1 | P30T-E | Human | Esophagus | ESCC | 1.21e-09 | 2.90e-01 | 0.137 |
| 55245 | UQCC1 | P31T-E | Human | Esophagus | ESCC | 1.54e-14 | 2.22e-01 | 0.1251 |
| 55245 | UQCC1 | P32T-E | Human | Esophagus | ESCC | 2.54e-23 | 4.51e-01 | 0.1666 |
| 55245 | UQCC1 | P36T-E | Human | Esophagus | ESCC | 2.85e-08 | 2.48e-01 | 0.1187 |
| 55245 | UQCC1 | P37T-E | Human | Esophagus | ESCC | 4.79e-11 | 1.40e-01 | 0.1371 |
| 55245 | UQCC1 | P39T-E | Human | Esophagus | ESCC | 4.94e-04 | 2.44e-02 | 0.0894 |
| 55245 | UQCC1 | P42T-E | Human | Esophagus | ESCC | 1.01e-04 | 1.32e-01 | 0.1175 |
| 55245 | UQCC1 | P44T-E | Human | Esophagus | ESCC | 2.80e-03 | 8.48e-02 | 0.1096 |
| 55245 | UQCC1 | P47T-E | Human | Esophagus | ESCC | 4.85e-09 | 9.63e-02 | 0.1067 |
| 55245 | UQCC1 | P48T-E | Human | Esophagus | ESCC | 3.24e-08 | 1.56e-01 | 0.0959 |
| 55245 | UQCC1 | P49T-E | Human | Esophagus | ESCC | 1.58e-04 | 4.09e-01 | 0.1768 |
| 55245 | UQCC1 | P52T-E | Human | Esophagus | ESCC | 1.41e-11 | 2.05e-01 | 0.1555 |
| 55245 | UQCC1 | P54T-E | Human | Esophagus | ESCC | 6.63e-07 | 1.50e-01 | 0.0975 |
| 55245 | UQCC1 | P56T-E | Human | Esophagus | ESCC | 5.78e-05 | 5.13e-01 | 0.1613 |
| Page: 1 2 3 4 |
| Tissue | Expression Dynamics | Abbreviation |
| Endometrium | 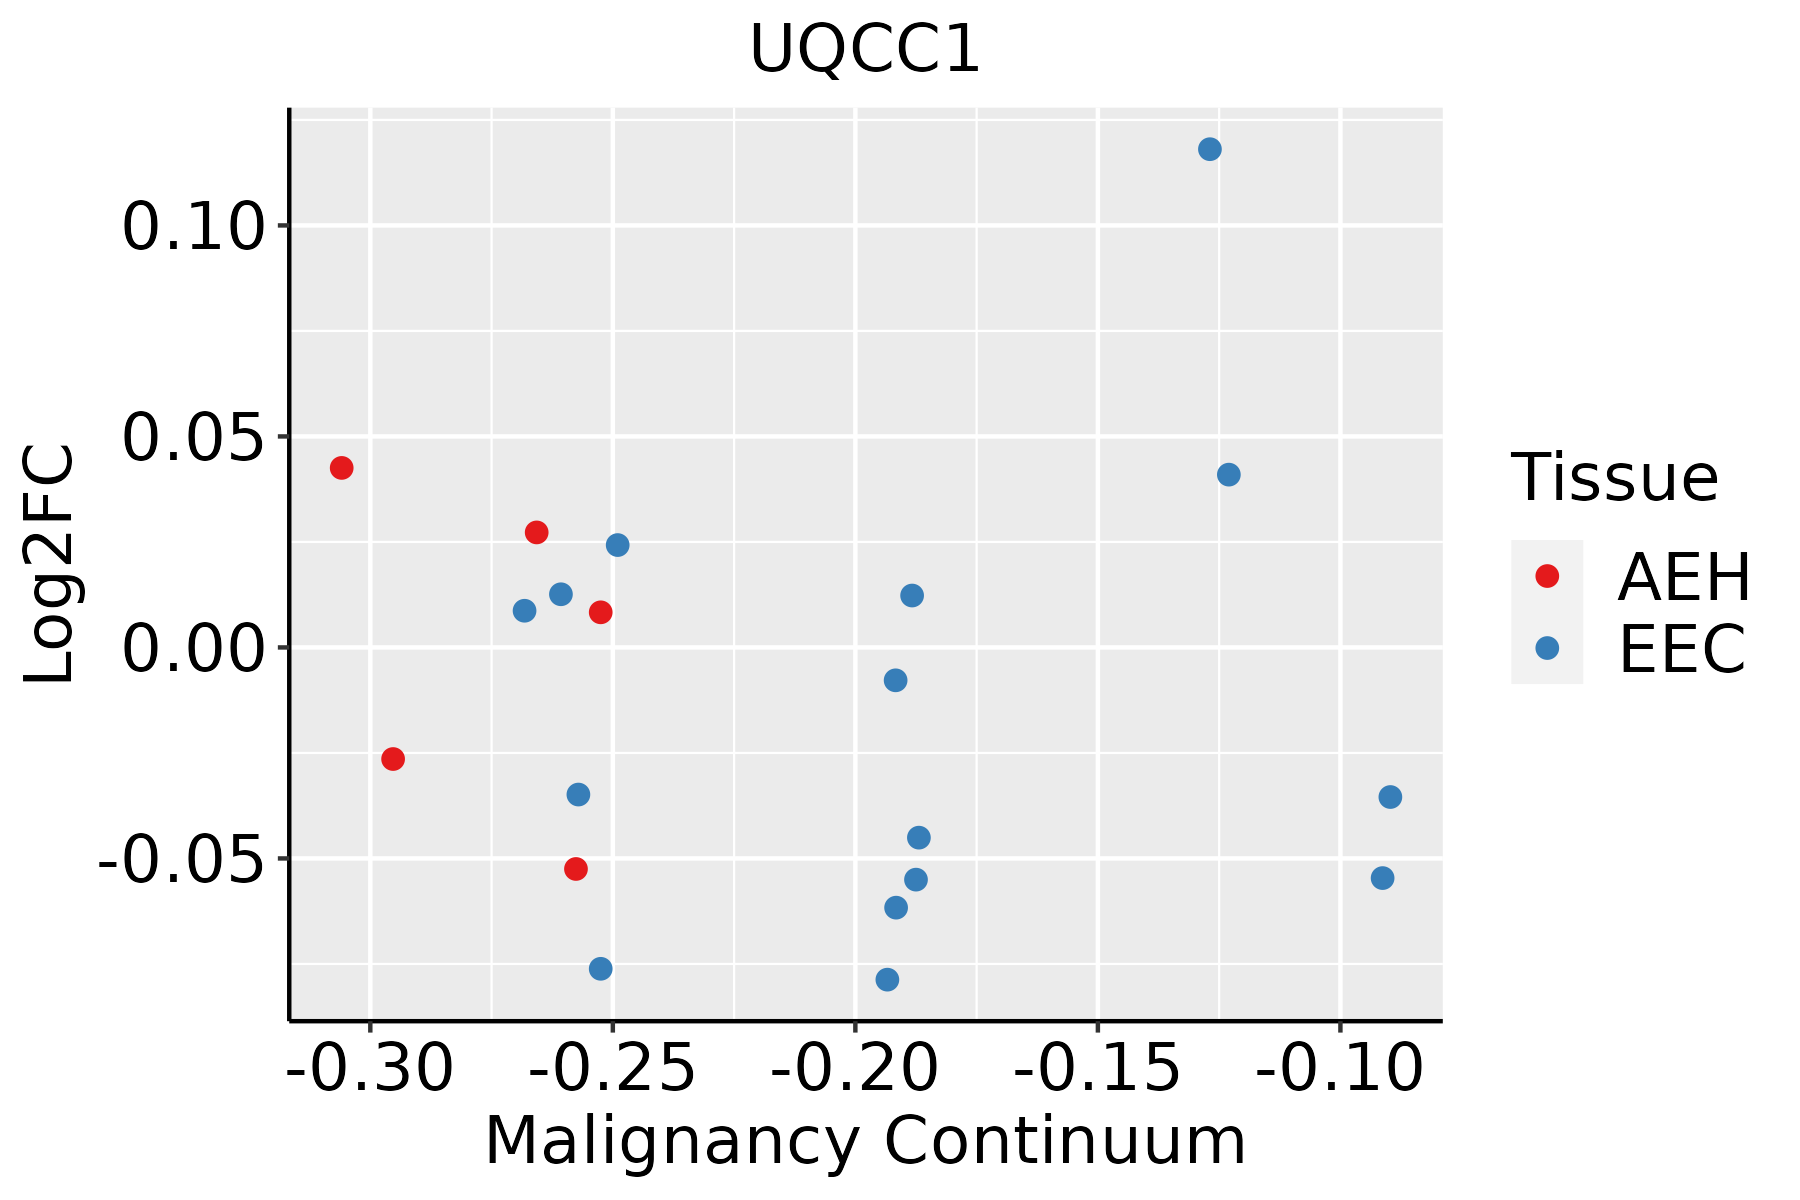 | AEH: Atypical endometrial hyperplasia |
| EEC: Endometrioid Cancer | ||
| Esophagus | 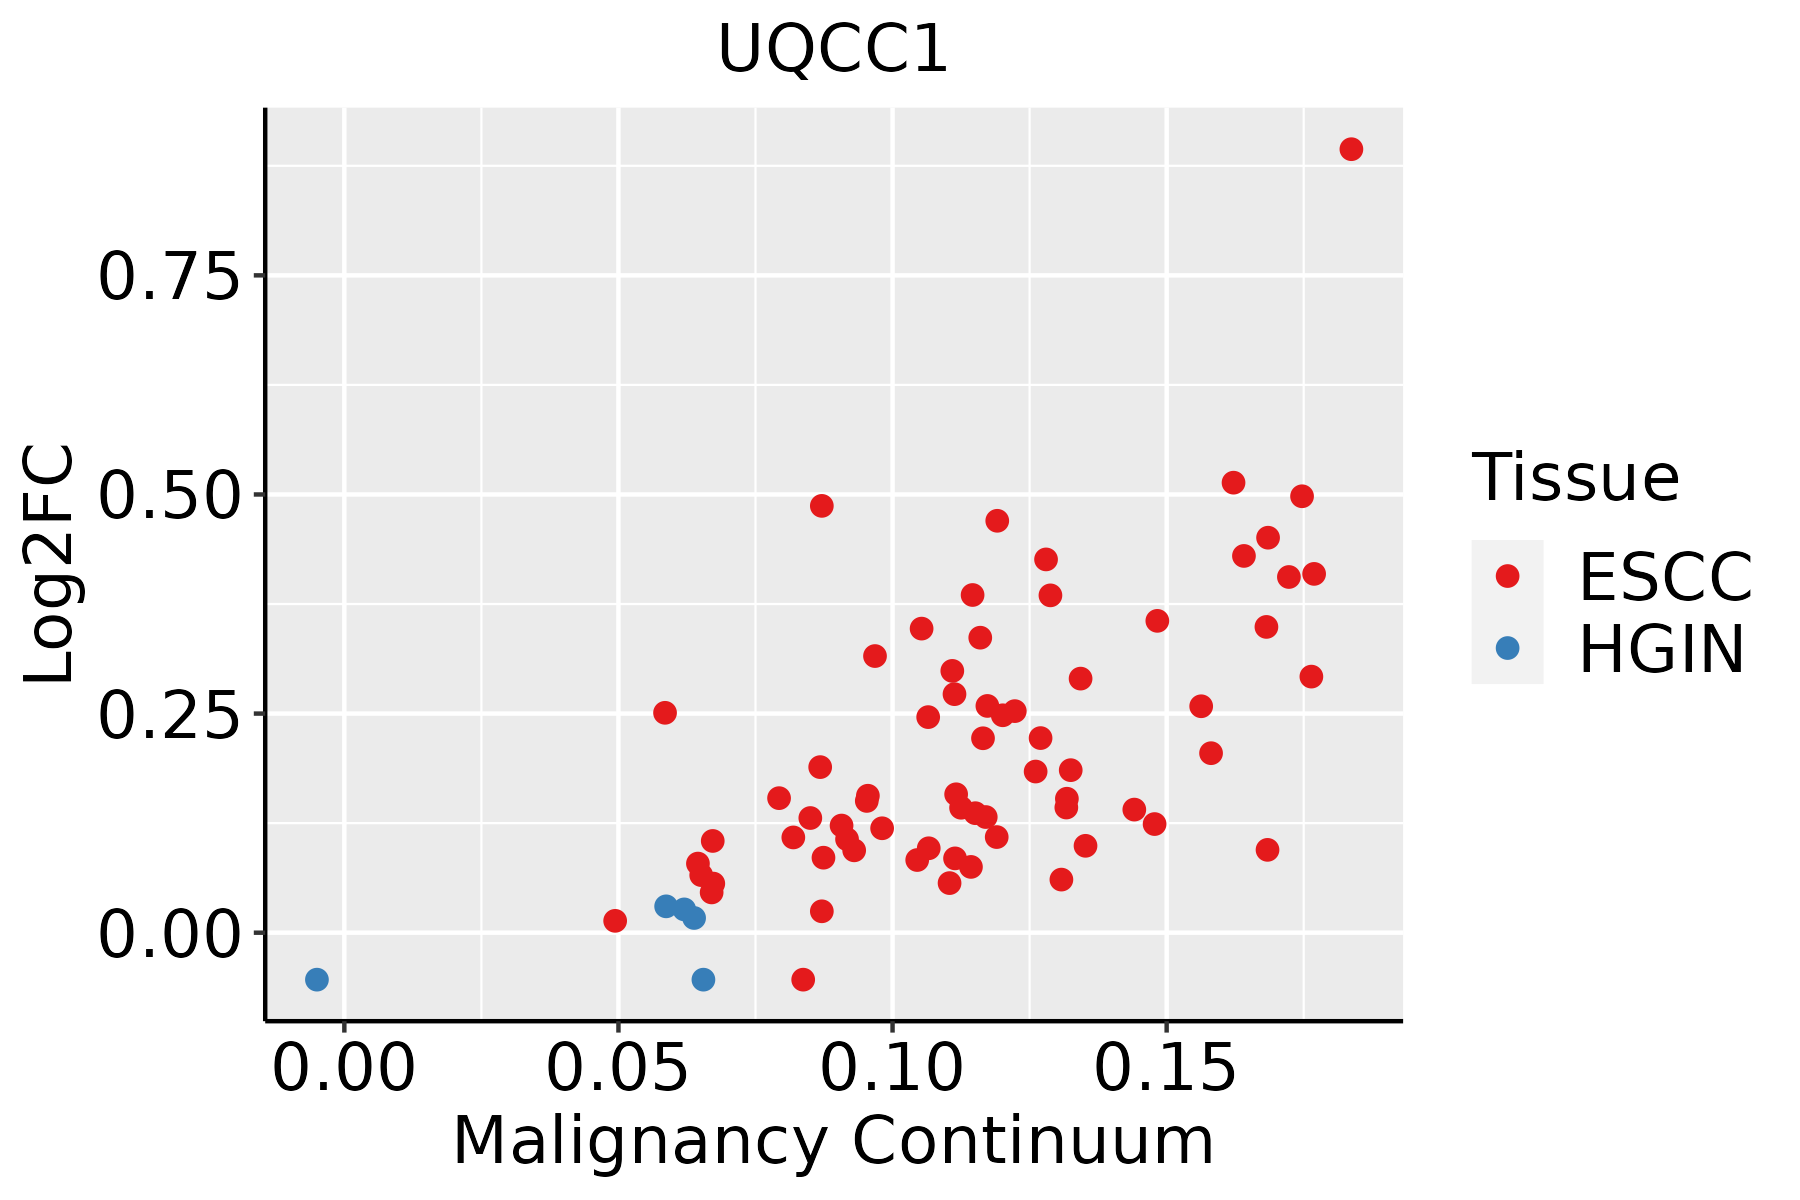 | ESCC: Esophageal squamous cell carcinoma |
| HGIN: High-grade intraepithelial neoplasias | ||
| LGIN: Low-grade intraepithelial neoplasias | ||
| Oral Cavity |  | EOLP: Erosive Oral lichen planus |
| LP: leukoplakia | ||
| NEOLP: Non-erosive oral lichen planus | ||
| OSCC: Oral squamous cell carcinoma |
| ∗log2FC in expression of this searched gene in stem-like cells from each diseased tissue sample relative to stem-like cells in normal samples in each tissue plotted against the malignancy continuum. Samples are colored based on if they are from different disease stage. |
Top |
Malignant transformation related pathway analysis |
| Find out the enriched GO biological processes and KEGG pathways involved in transition from healthy to precancer to cancer |
| Tissue | Disease Stage | Enriched GO biological Processes |
| Colorectum | AD |  |
| Colorectum | SER |  |
| Colorectum | MSS |  |
| Colorectum | MSI-H |  |
| Colorectum | FAP |  |
| ∗Top 15 enriched GO BP terms are showed in the bar plot of each disease state in each tissue. Each row represents a significant GO biological process which is colored according to the -log10(p.adjust). |
| Page: 1 2 3 4 5 6 7 8 9 |
| GO ID | Tissue | Disease Stage | Description | Gene Ratio | Bg Ratio | pvalue | p.adjust | Count |
| GO:003310815 | Endometrium | EEC | mitochondrial respiratory chain complex assembly | 31/2168 | 93/18723 | 2.46e-08 | 1.45e-06 | 31 |
| GO:0033108110 | Esophagus | ESCC | mitochondrial respiratory chain complex assembly | 83/8552 | 93/18723 | 9.56e-19 | 1.05e-16 | 83 |
| GO:001700413 | Esophagus | ESCC | cytochrome complex assembly | 34/8552 | 36/18723 | 5.08e-10 | 1.31e-08 | 34 |
| GO:003310818 | Oral cavity | OSCC | mitochondrial respiratory chain complex assembly | 75/7305 | 93/18723 | 2.17e-16 | 1.68e-14 | 75 |
| GO:00170043 | Oral cavity | OSCC | cytochrome complex assembly | 31/7305 | 36/18723 | 7.28e-09 | 1.53e-07 | 31 |
| GO:003310819 | Oral cavity | LP | mitochondrial respiratory chain complex assembly | 63/4623 | 93/18723 | 2.24e-18 | 4.13e-16 | 63 |
| GO:001700412 | Oral cavity | LP | cytochrome complex assembly | 25/4623 | 36/18723 | 1.93e-08 | 7.11e-07 | 25 |
| Page: 1 |
| Pathway ID | Tissue | Disease Stage | Description | Gene Ratio | Bg Ratio | pvalue | p.adjust | qvalue | Count |
| Page: 1 |
Top |
Cell-cell communication analysis |
| Identification of potential cell-cell interactions between two cell types and their ligand-receptor pairs for different disease states |
| Ligand | Receptor | LRpair | Pathway | Tissue | Disease Stage |
| Page: 1 |
Top |
Single-cell gene regulatory network inference analysis |
| Find out the significant the regulons (TFs) and the target genes of each regulon across cell types for different disease states |
| TF | Cell Type | Tissue | Disease Stage | Target Gene | RSS | Regulon Activity |
| ∗The dot plots of a searched regulon are shown for all cell subpopulations in each disease state of each tissue based on the regulon specific score inferred using pySCENIC and by calculating the average expression. |
| Page: 1 |
Top |
Somatic mutation of malignant transformation related genes |
| Annotation of somatic variants for genes involved in malignant transformation |
| Hugo Symbol | Variant Class | Variant Classification | dbSNP RS | HGVSc | HGVSp | HGVSp Short | SWISSPROT | BIOTYPE | SIFT | PolyPhen | Tumor Sample Barcode | Tissue | Histology | Sex | Age | Stage | Therapy Types | Drugs | Outcome |
| UQCC1 | SNV | Missense_Mutation | c.522C>G | p.Ile174Met | p.I174M | Q9NVA1 | protein_coding | tolerated(0.2) | benign(0.315) | TCGA-AC-A23H-01 | Breast | breast invasive carcinoma | Female | >=65 | I/II | Unknown | Unknown | PD | |
| UQCC1 | SNV | Missense_Mutation | c.842N>C | p.Lys281Thr | p.K281T | Q9NVA1 | protein_coding | tolerated(0.14) | benign(0.338) | TCGA-BH-A0AW-01 | Breast | breast invasive carcinoma | Female | <65 | I/II | Chemotherapy | carboplatin | SD | |
| UQCC1 | insertion | Frame_Shift_Ins | novel | c.782_783insTGTTCAGGCCAAGATACAGCCAGCCAGGCCTGTCGTCTGG | p.Met262ValfsTer84 | p.M262Vfs*84 | Q9NVA1 | protein_coding | TCGA-B6-A0IA-01 | Breast | breast invasive carcinoma | Female | <65 | I/II | Unknown | Unknown | SD | ||
| UQCC1 | SNV | Missense_Mutation | c.607N>A | p.Leu203Ile | p.L203I | Q9NVA1 | protein_coding | tolerated(0.39) | benign(0.003) | TCGA-A6-2686-01 | Colorectum | colon adenocarcinoma | Female | >=65 | I/II | Unknown | Unknown | SD | |
| UQCC1 | SNV | Missense_Mutation | c.614N>T | p.Thr205Ile | p.T205I | Q9NVA1 | protein_coding | deleterious(0) | benign(0.173) | TCGA-AA-3864-01 | Colorectum | colon adenocarcinoma | Male | >=65 | I/II | Unknown | Unknown | SD | |
| UQCC1 | SNV | Missense_Mutation | novel | c.624C>A | p.Phe208Leu | p.F208L | Q9NVA1 | protein_coding | deleterious(0.04) | possibly_damaging(0.682) | TCGA-AA-A00N-01 | Colorectum | colon adenocarcinoma | Male | >=65 | I/II | Unknown | Unknown | PD |
| UQCC1 | SNV | Missense_Mutation | rs765250406 | c.559N>A | p.Gly187Ser | p.G187S | Q9NVA1 | protein_coding | tolerated(0.27) | benign(0.023) | TCGA-D5-6530-01 | Colorectum | colon adenocarcinoma | Male | <65 | I/II | Unknown | Unknown | SD |
| UQCC1 | SNV | Missense_Mutation | c.361N>C | p.Tyr121His | p.Y121H | Q9NVA1 | protein_coding | deleterious(0) | probably_damaging(0.994) | TCGA-D5-6534-01 | Colorectum | colon adenocarcinoma | Female | <65 | I/II | Unknown | Unknown | SD | |
| UQCC1 | SNV | Missense_Mutation | novel | c.624C>A | p.Phe208Leu | p.F208L | Q9NVA1 | protein_coding | deleterious(0.04) | possibly_damaging(0.682) | TCGA-F5-6814-01 | Colorectum | rectum adenocarcinoma | Male | <65 | I/II | Unknown | Unknown | SD |
| UQCC1 | SNV | Missense_Mutation | novel | c.683N>T | p.Ala228Val | p.A228V | Q9NVA1 | protein_coding | deleterious(0) | possibly_damaging(0.677) | TCGA-A5-A0G2-01 | Endometrium | uterine corpus endometrioid carcinoma | Female | <65 | III/IV | Unknown | Unknown | SD |
| Page: 1 2 3 4 |
Top |
Related drugs of malignant transformation related genes |
| Identification of chemicals and drugs interact with genes involved in malignant transfromation |
| (DGIdb 4.0) |
| Entrez ID | Symbol | Category | Interaction Types | Drug Claim Name | Drug Name | PMIDs |
| Page: 1 |

Copyright 2023-Present -The University of Texas Health Science Center at Houston |