
|
|||||
|
 | |
| |
| |
| |
| |
| |
|
Gene: U2AF1 |
Gene summary for U2AF1 |
| Gene information | Species | Human | Gene symbol | U2AF1 | Gene ID | 7307 |
| Gene name | U2 small nuclear RNA auxiliary factor 1 | |
| Gene Alias | FP793 | |
| Cytomap | 21q22.3 | |
| Gene Type | protein-coding | GO ID | GO:0000375 | UniProtAcc | Q01081 |
Top |
Malignant transformation analysis |
| Identification of the aberrant gene expression in precancerous and cancerous lesions by comparing the gene expression of stem-like cells in diseased tissues with normal stem cells |
| Entrez ID | Symbol | Replicates | Species | Organ | Tissue | Adj P-value | Log2FC | Malignancy |
| 7307 | U2AF1 | AEH-subject1 | Human | Endometrium | AEH | 2.60e-36 | -5.37e-01 | -0.3059 |
| 7307 | U2AF1 | AEH-subject2 | Human | Endometrium | AEH | 3.36e-37 | -5.84e-01 | -0.2525 |
| 7307 | U2AF1 | AEH-subject3 | Human | Endometrium | AEH | 8.06e-40 | -5.54e-01 | -0.2576 |
| 7307 | U2AF1 | AEH-subject4 | Human | Endometrium | AEH | 2.95e-20 | -5.13e-01 | -0.2657 |
| 7307 | U2AF1 | AEH-subject5 | Human | Endometrium | AEH | 9.66e-22 | -4.84e-01 | -0.2953 |
| 7307 | U2AF1 | EEC-subject1 | Human | Endometrium | EEC | 5.45e-26 | -4.96e-01 | -0.2682 |
| 7307 | U2AF1 | EEC-subject2 | Human | Endometrium | EEC | 1.25e-32 | -5.36e-01 | -0.2607 |
| 7307 | U2AF1 | EEC-subject3 | Human | Endometrium | EEC | 5.30e-44 | -5.75e-01 | -0.2525 |
| 7307 | U2AF1 | EEC-subject4 | Human | Endometrium | EEC | 7.18e-38 | -5.70e-01 | -0.2571 |
| 7307 | U2AF1 | EEC-subject5 | Human | Endometrium | EEC | 3.20e-31 | -4.93e-01 | -0.249 |
| 7307 | U2AF1 | GSM5276934 | Human | Endometrium | EEC | 5.21e-28 | -5.09e-01 | -0.0913 |
| 7307 | U2AF1 | GSM5276935 | Human | Endometrium | EEC | 1.03e-41 | -5.81e-01 | -0.123 |
| 7307 | U2AF1 | GSM5276937 | Human | Endometrium | EEC | 3.92e-36 | -5.94e-01 | -0.0897 |
| 7307 | U2AF1 | GSM6177620_NYU_UCEC1_lib1_lib1 | Human | Endometrium | EEC | 4.37e-36 | -6.07e-01 | -0.1869 |
| 7307 | U2AF1 | GSM6177620_NYU_UCEC1_lib2_lib2 | Human | Endometrium | EEC | 2.31e-32 | -6.07e-01 | -0.1875 |
| 7307 | U2AF1 | GSM6177620_NYU_UCEC1_lib3_lib3 | Human | Endometrium | EEC | 2.81e-37 | -6.07e-01 | -0.1883 |
| 7307 | U2AF1 | GSM6177621_NYU_UCEC2_lib1_lib1 | Human | Endometrium | EEC | 7.22e-51 | -6.03e-01 | -0.1934 |
| 7307 | U2AF1 | GSM6177622_NYU_UCEC3_lib1_lib1 | Human | Endometrium | EEC | 5.24e-49 | -6.07e-01 | -0.1917 |
| 7307 | U2AF1 | GSM6177622_NYU_UCEC3_lib2_lib2 | Human | Endometrium | EEC | 1.83e-47 | -6.07e-01 | -0.1916 |
| 7307 | U2AF1 | GSM6177623_NYU_UCEC3_Vis | Human | Endometrium | EEC | 1.30e-33 | -5.64e-01 | -0.1269 |
| Page: 1 2 3 4 5 6 7 8 9 |
| Tissue | Expression Dynamics | Abbreviation |
| Colorectum (GSE201348) |  | FAP: Familial adenomatous polyposis |
| CRC: Colorectal cancer | ||
| Colorectum (HTA11) |  | AD: Adenomas |
| SER: Sessile serrated lesions | ||
| MSI-H: Microsatellite-high colorectal cancer | ||
| MSS: Microsatellite stable colorectal cancer | ||
| Endometrium |  | AEH: Atypical endometrial hyperplasia |
| EEC: Endometrioid Cancer | ||
| Esophagus | 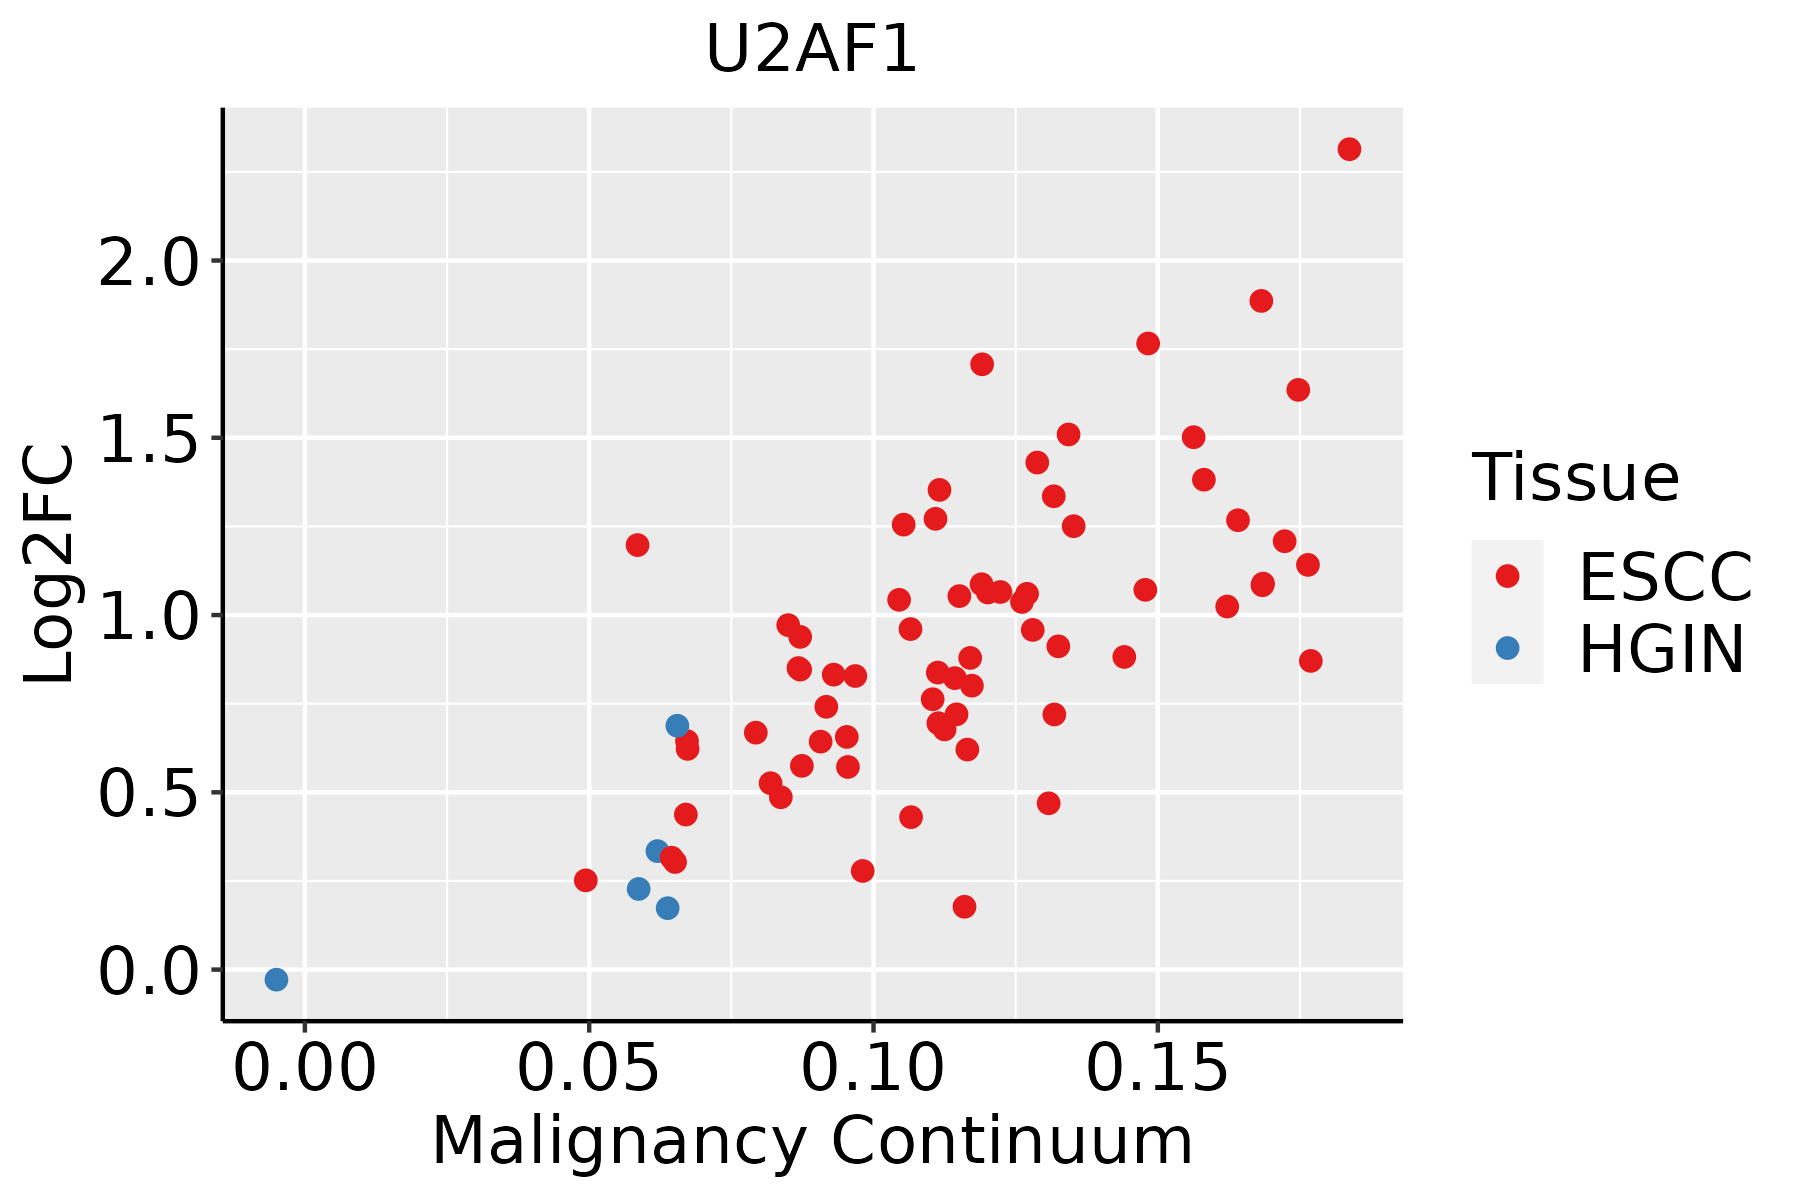 | ESCC: Esophageal squamous cell carcinoma |
| HGIN: High-grade intraepithelial neoplasias | ||
| LGIN: Low-grade intraepithelial neoplasias | ||
| GC | 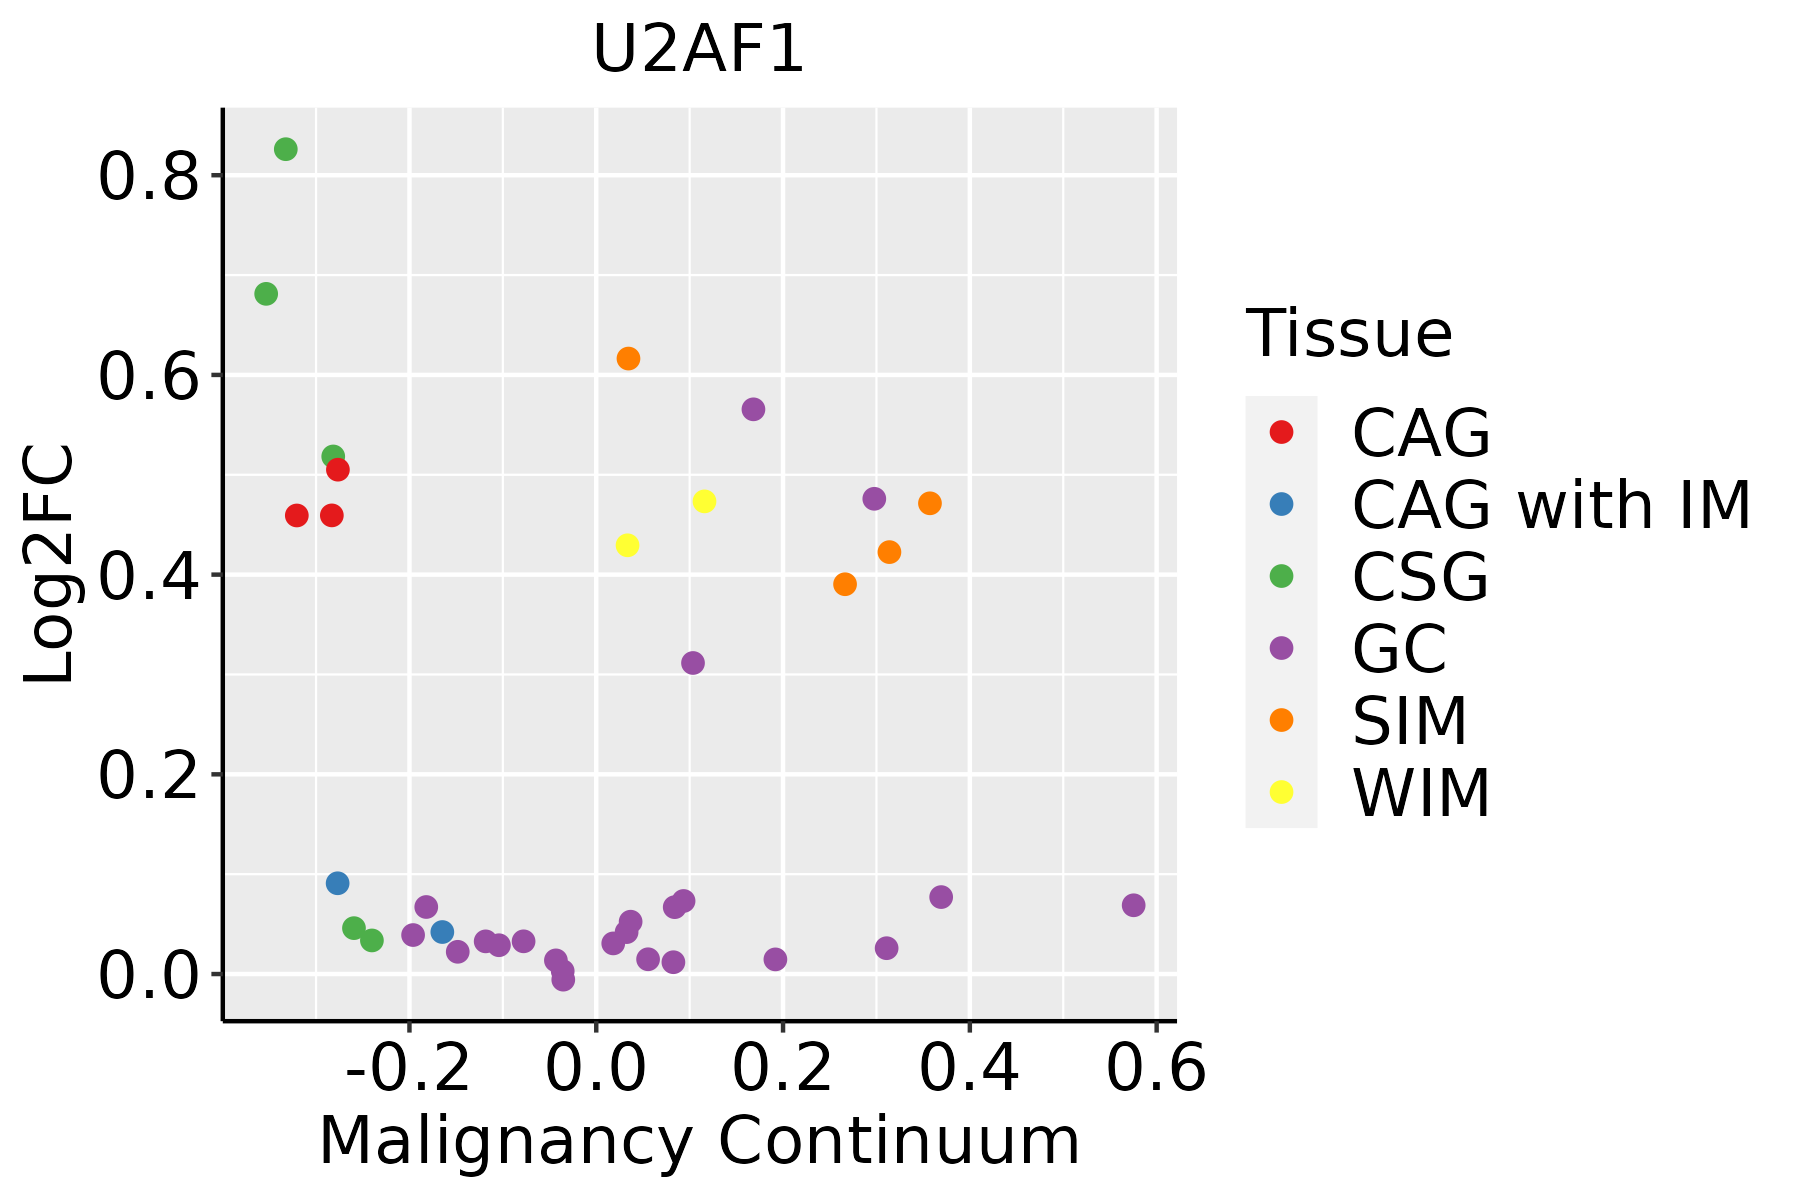 | CAG: Chronic atrophic gastritis |
| CAG with IM: Chronic atrophic gastritis with intestinal metaplasia | ||
| CSG: Chronic superficial gastritis | ||
| GC: Gastric cancer | ||
| SIM: Severe intestinal metaplasia | ||
| WIM: Wild intestinal metaplasia | ||
| Liver |  | HCC: Hepatocellular carcinoma |
| NAFLD: Non-alcoholic fatty liver disease | ||
| Oral Cavity | 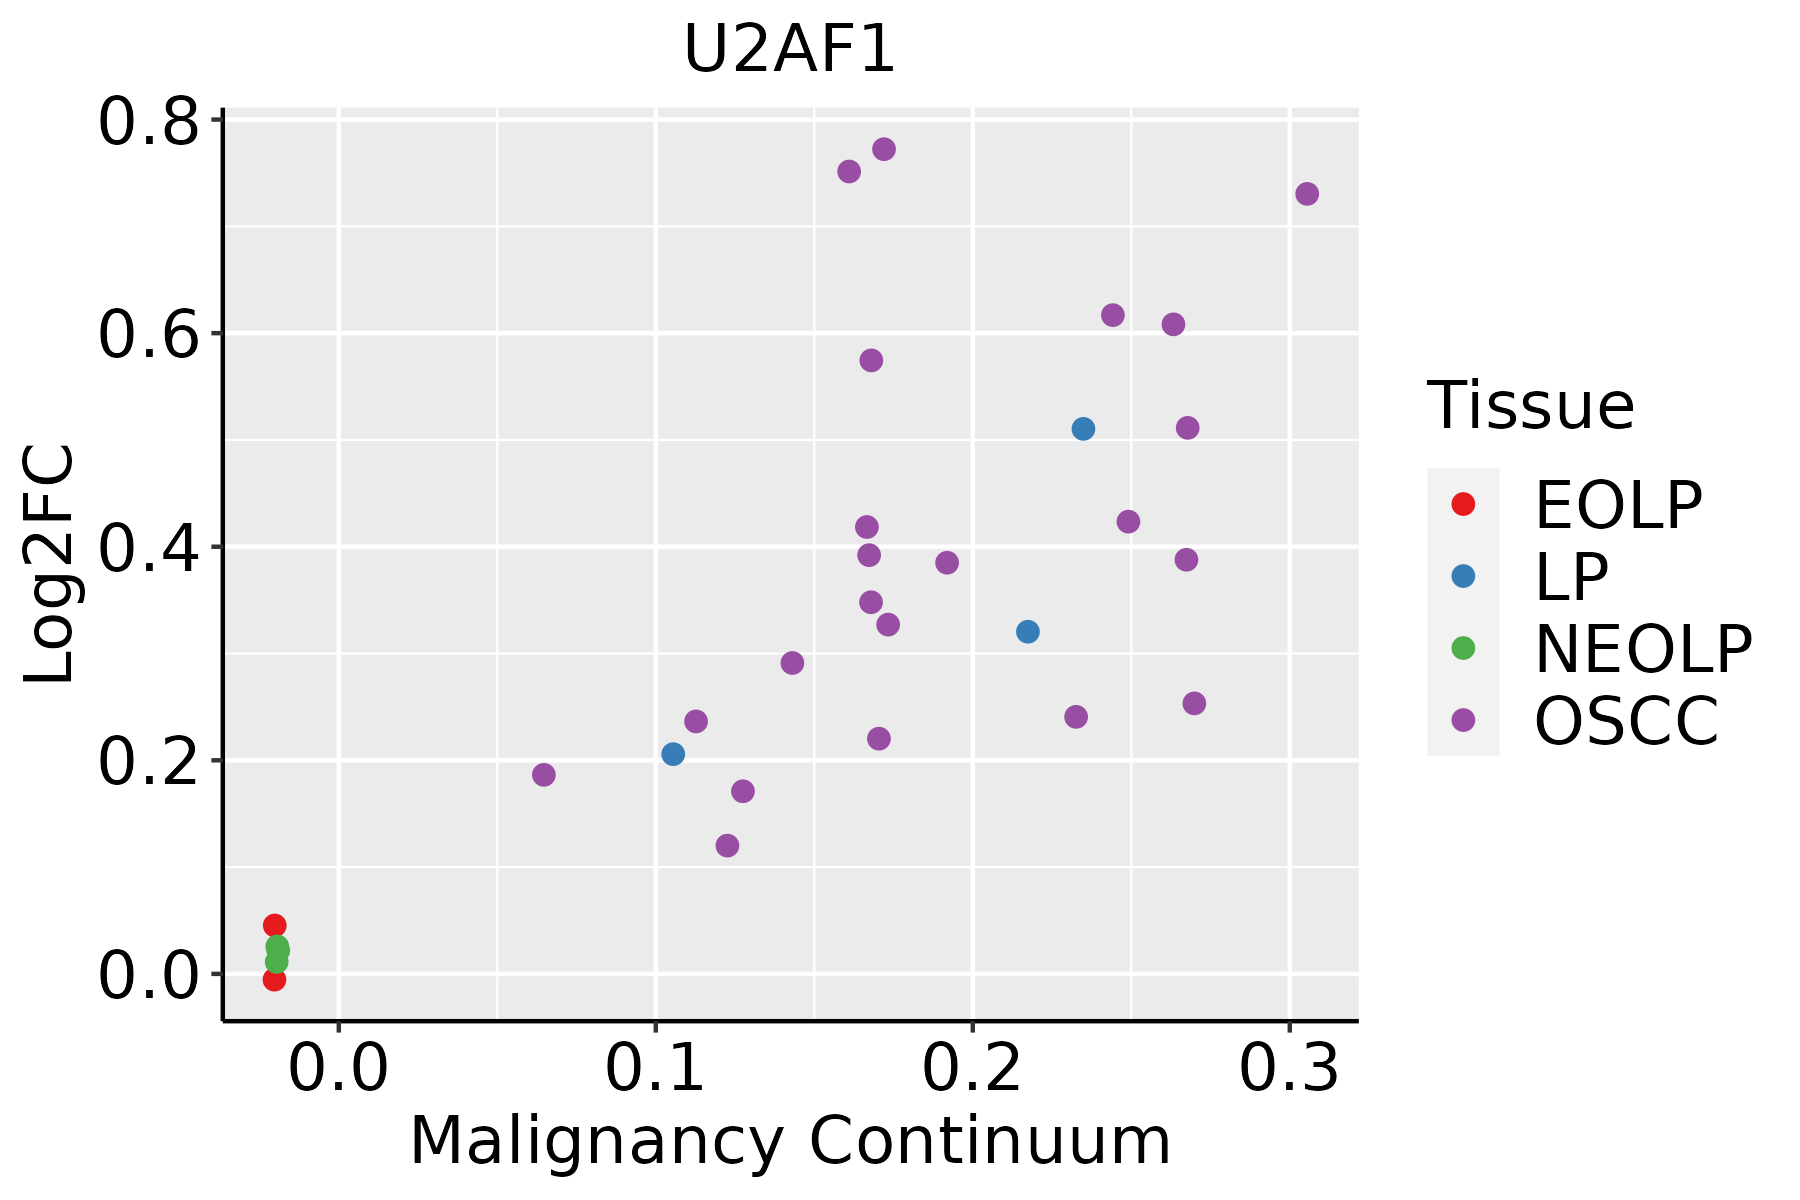 | EOLP: Erosive Oral lichen planus |
| LP: leukoplakia | ||
| NEOLP: Non-erosive oral lichen planus | ||
| OSCC: Oral squamous cell carcinoma | ||
| Prostate |  | BPH: Benign Prostatic Hyperplasia |
| Skin |  | AK: Actinic keratosis |
| cSCC: Cutaneous squamous cell carcinoma | ||
| SCCIS:squamous cell carcinoma in situ |
| ∗log2FC in expression of this searched gene in stem-like cells from each diseased tissue sample relative to stem-like cells in normal samples in each tissue plotted against the malignancy continuum. Samples are colored based on if they are from different disease stage. |
Top |
Malignant transformation related pathway analysis |
| Find out the enriched GO biological processes and KEGG pathways involved in transition from healthy to precancer to cancer |
| Tissue | Disease Stage | Enriched GO biological Processes |
| Colorectum | AD |  |
| Colorectum | SER |  |
| Colorectum | MSS |  |
| Colorectum | MSI-H |  |
| Colorectum | FAP |  |
| ∗Top 15 enriched GO BP terms are showed in the bar plot of each disease state in each tissue. Each row represents a significant GO biological process which is colored according to the -log10(p.adjust). |
| Page: 1 2 3 4 5 6 7 8 9 |
| GO ID | Tissue | Disease Stage | Description | Gene Ratio | Bg Ratio | pvalue | p.adjust | Count |
| GO:0008380 | Colorectum | AD | RNA splicing | 169/3918 | 434/18723 | 3.59e-18 | 2.04e-15 | 169 |
| GO:0000377 | Colorectum | AD | RNA splicing, via transesterification reactions with bulged adenosine as nucleophile | 130/3918 | 320/18723 | 5.88e-16 | 2.16e-13 | 130 |
| GO:0000398 | Colorectum | AD | mRNA splicing, via spliceosome | 130/3918 | 320/18723 | 5.88e-16 | 2.16e-13 | 130 |
| GO:0000375 | Colorectum | AD | RNA splicing, via transesterification reactions | 131/3918 | 324/18723 | 7.11e-16 | 2.22e-13 | 131 |
| GO:00083801 | Colorectum | SER | RNA splicing | 123/2897 | 434/18723 | 3.84e-12 | 8.41e-10 | 123 |
| GO:00003751 | Colorectum | SER | RNA splicing, via transesterification reactions | 90/2897 | 324/18723 | 8.68e-09 | 7.50e-07 | 90 |
| GO:00003771 | Colorectum | SER | RNA splicing, via transesterification reactions with bulged adenosine as nucleophile | 89/2897 | 320/18723 | 9.82e-09 | 8.14e-07 | 89 |
| GO:00003981 | Colorectum | SER | mRNA splicing, via spliceosome | 89/2897 | 320/18723 | 9.82e-09 | 8.14e-07 | 89 |
| GO:00083802 | Colorectum | MSS | RNA splicing | 159/3467 | 434/18723 | 1.75e-19 | 1.22e-16 | 159 |
| GO:00003772 | Colorectum | MSS | RNA splicing, via transesterification reactions with bulged adenosine as nucleophile | 121/3467 | 320/18723 | 2.52e-16 | 8.27e-14 | 121 |
| GO:00003982 | Colorectum | MSS | mRNA splicing, via spliceosome | 121/3467 | 320/18723 | 2.52e-16 | 8.27e-14 | 121 |
| GO:00003752 | Colorectum | MSS | RNA splicing, via transesterification reactions | 122/3467 | 324/18723 | 2.75e-16 | 8.58e-14 | 122 |
| GO:00083803 | Colorectum | MSI-H | RNA splicing | 82/1319 | 434/18723 | 1.22e-16 | 4.53e-14 | 82 |
| GO:00003753 | Colorectum | MSI-H | RNA splicing, via transesterification reactions | 67/1319 | 324/18723 | 7.99e-16 | 2.61e-13 | 67 |
| GO:00003773 | Colorectum | MSI-H | RNA splicing, via transesterification reactions with bulged adenosine as nucleophile | 66/1319 | 320/18723 | 1.51e-15 | 4.41e-13 | 66 |
| GO:00003983 | Colorectum | MSI-H | mRNA splicing, via spliceosome | 66/1319 | 320/18723 | 1.51e-15 | 4.41e-13 | 66 |
| GO:000838016 | Endometrium | AEH | RNA splicing | 111/2100 | 434/18723 | 2.42e-17 | 1.12e-14 | 111 |
| GO:000037515 | Endometrium | AEH | RNA splicing, via transesterification reactions | 88/2100 | 324/18723 | 1.11e-15 | 3.91e-13 | 88 |
| GO:000037715 | Endometrium | AEH | RNA splicing, via transesterification reactions with bulged adenosine as nucleophile | 87/2100 | 320/18723 | 1.51e-15 | 4.78e-13 | 87 |
| GO:000039815 | Endometrium | AEH | mRNA splicing, via spliceosome | 87/2100 | 320/18723 | 1.51e-15 | 4.78e-13 | 87 |
| Page: 1 2 3 4 |
| Pathway ID | Tissue | Disease Stage | Description | Gene Ratio | Bg Ratio | pvalue | p.adjust | qvalue | Count |
| hsa05131 | Colorectum | AD | Shigellosis | 109/2092 | 247/8465 | 1.09e-11 | 2.44e-10 | 1.55e-10 | 109 |
| hsa03040 | Colorectum | AD | Spliceosome | 73/2092 | 217/8465 | 1.73e-03 | 9.68e-03 | 6.18e-03 | 73 |
| hsa051311 | Colorectum | AD | Shigellosis | 109/2092 | 247/8465 | 1.09e-11 | 2.44e-10 | 1.55e-10 | 109 |
| hsa030401 | Colorectum | AD | Spliceosome | 73/2092 | 217/8465 | 1.73e-03 | 9.68e-03 | 6.18e-03 | 73 |
| hsa051312 | Colorectum | SER | Shigellosis | 87/1580 | 247/8465 | 3.07e-10 | 7.27e-09 | 5.28e-09 | 87 |
| hsa051313 | Colorectum | SER | Shigellosis | 87/1580 | 247/8465 | 3.07e-10 | 7.27e-09 | 5.28e-09 | 87 |
| hsa051314 | Colorectum | MSS | Shigellosis | 94/1875 | 247/8465 | 6.82e-09 | 1.34e-07 | 8.23e-08 | 94 |
| hsa030402 | Colorectum | MSS | Spliceosome | 66/1875 | 217/8465 | 2.58e-03 | 1.27e-02 | 7.81e-03 | 66 |
| hsa051315 | Colorectum | MSS | Shigellosis | 94/1875 | 247/8465 | 6.82e-09 | 1.34e-07 | 8.23e-08 | 94 |
| hsa030403 | Colorectum | MSS | Spliceosome | 66/1875 | 217/8465 | 2.58e-03 | 1.27e-02 | 7.81e-03 | 66 |
| hsa030404 | Colorectum | MSI-H | Spliceosome | 37/797 | 217/8465 | 2.49e-04 | 3.23e-03 | 2.70e-03 | 37 |
| hsa051316 | Colorectum | MSI-H | Shigellosis | 40/797 | 247/8465 | 4.28e-04 | 5.34e-03 | 4.47e-03 | 40 |
| hsa030405 | Colorectum | MSI-H | Spliceosome | 37/797 | 217/8465 | 2.49e-04 | 3.23e-03 | 2.70e-03 | 37 |
| hsa051317 | Colorectum | MSI-H | Shigellosis | 40/797 | 247/8465 | 4.28e-04 | 5.34e-03 | 4.47e-03 | 40 |
| hsa0513126 | Endometrium | AEH | Shigellosis | 78/1197 | 247/8465 | 9.23e-13 | 2.00e-11 | 1.46e-11 | 78 |
| hsa030409 | Endometrium | AEH | Spliceosome | 54/1197 | 217/8465 | 1.47e-05 | 1.65e-04 | 1.21e-04 | 54 |
| hsa05131111 | Endometrium | AEH | Shigellosis | 78/1197 | 247/8465 | 9.23e-13 | 2.00e-11 | 1.46e-11 | 78 |
| hsa0304014 | Endometrium | AEH | Spliceosome | 54/1197 | 217/8465 | 1.47e-05 | 1.65e-04 | 1.21e-04 | 54 |
| hsa0513127 | Endometrium | EEC | Shigellosis | 79/1237 | 247/8465 | 1.80e-12 | 3.95e-11 | 2.95e-11 | 79 |
| hsa0304024 | Endometrium | EEC | Spliceosome | 54/1237 | 217/8465 | 3.78e-05 | 3.88e-04 | 2.89e-04 | 54 |
| Page: 1 2 3 |
Top |
Cell-cell communication analysis |
| Identification of potential cell-cell interactions between two cell types and their ligand-receptor pairs for different disease states |
| Ligand | Receptor | LRpair | Pathway | Tissue | Disease Stage |
| Page: 1 |
Top |
Single-cell gene regulatory network inference analysis |
| Find out the significant the regulons (TFs) and the target genes of each regulon across cell types for different disease states |
| TF | Cell Type | Tissue | Disease Stage | Target Gene | RSS | Regulon Activity |
| U2AF1 | PERI | Pancreas | PDAC | SEPP1,ATP5F1E,RACK1, etc. | 1.45e-01 |  |
| U2AF1 | ICAF | Pancreas | PDAC | SEPP1,ATP5F1E,RACK1, etc. | 1.54e-01 | |
| ∗The dot plots of a searched regulon are shown for all cell subpopulations in each disease state of each tissue based on the regulon specific score inferred using pySCENIC and by calculating the average expression. |
| Page: 1 |
Top |
Somatic mutation of malignant transformation related genes |
| Annotation of somatic variants for genes involved in malignant transformation |
| Hugo Symbol | Variant Class | Variant Classification | dbSNP RS | HGVSc | HGVSp | HGVSp Short | SWISSPROT | BIOTYPE | SIFT | PolyPhen | Tumor Sample Barcode | Tissue | Histology | Sex | Age | Stage | Therapy Types | Drugs | Outcome |
| U2AF1 | SNV | Missense_Mutation | c.291G>T | p.Glu97Asp | p.E97D | Q01081 | protein_coding | tolerated(0.07) | benign(0.047) | TCGA-CM-5861-01 | Colorectum | colon adenocarcinoma | Female | <65 | I/II | Unknown | Unknown | PD | |
| U2AF1 | SNV | Missense_Mutation | c.343N>A | p.Val115Ile | p.V115I | Q01081 | protein_coding | tolerated(0.17) | benign(0.044) | TCGA-BR-6452-01 | Stomach | stomach adenocarcinoma | Female | >=65 | I/II | Unknown | Unknown | SD |
| Page: 1 |
Top |
Related drugs of malignant transformation related genes |
| Identification of chemicals and drugs interact with genes involved in malignant transfromation |
| (DGIdb 4.0) |
| Entrez ID | Symbol | Category | Interaction Types | Drug Claim Name | Drug Name | PMIDs |
| 7307 | U2AF1 | CLINICALLY ACTIONABLE | N/A | 25465125,22389253,22158538 | ||
| 7307 | U2AF1 | CLINICALLY ACTIONABLE | H3B-8800 |
| Page: 1 |

Copyright 2023-Present -The University of Texas Health Science Center at Houston |