
|
|||||
|
 | |
| |
| |
| |
| |
| |
|
Gene: TXNDC12 |
Gene summary for TXNDC12 |
| Gene information | Species | Human | Gene symbol | TXNDC12 | Gene ID | 51060 |
| Gene name | thioredoxin domain containing 12 | |
| Gene Alias | AG1 | |
| Cytomap | 1p32.3 | |
| Gene Type | protein-coding | GO ID | GO:0006915 | UniProtAcc | O95881 |
Top |
Malignant transformation analysis |
| Identification of the aberrant gene expression in precancerous and cancerous lesions by comparing the gene expression of stem-like cells in diseased tissues with normal stem cells |
| Entrez ID | Symbol | Replicates | Species | Organ | Tissue | Adj P-value | Log2FC | Malignancy |
| 51060 | TXNDC12 | P17T-E | Human | Esophagus | ESCC | 6.36e-17 | 9.52e-01 | 0.1278 |
| 51060 | TXNDC12 | P19T-E | Human | Esophagus | ESCC | 2.81e-14 | 1.32e+00 | 0.1662 |
| 51060 | TXNDC12 | P20T-E | Human | Esophagus | ESCC | 3.34e-53 | 1.20e+00 | 0.1124 |
| 51060 | TXNDC12 | P21T-E | Human | Esophagus | ESCC | 5.50e-49 | 1.25e+00 | 0.1617 |
| 51060 | TXNDC12 | P22T-E | Human | Esophagus | ESCC | 5.25e-49 | 9.62e-01 | 0.1236 |
| 51060 | TXNDC12 | P23T-E | Human | Esophagus | ESCC | 7.94e-50 | 1.29e+00 | 0.108 |
| 51060 | TXNDC12 | P24T-E | Human | Esophagus | ESCC | 1.77e-36 | 8.49e-01 | 0.1287 |
| 51060 | TXNDC12 | P26T-E | Human | Esophagus | ESCC | 4.78e-44 | 8.89e-01 | 0.1276 |
| 51060 | TXNDC12 | P27T-E | Human | Esophagus | ESCC | 1.12e-29 | 8.43e-01 | 0.1055 |
| 51060 | TXNDC12 | P28T-E | Human | Esophagus | ESCC | 6.66e-39 | 9.30e-01 | 0.1149 |
| 51060 | TXNDC12 | P30T-E | Human | Esophagus | ESCC | 6.15e-37 | 1.42e+00 | 0.137 |
| 51060 | TXNDC12 | P31T-E | Human | Esophagus | ESCC | 1.48e-55 | 1.04e+00 | 0.1251 |
| 51060 | TXNDC12 | P32T-E | Human | Esophagus | ESCC | 6.34e-74 | 1.57e+00 | 0.1666 |
| 51060 | TXNDC12 | P36T-E | Human | Esophagus | ESCC | 9.01e-28 | 1.05e+00 | 0.1187 |
| 51060 | TXNDC12 | P37T-E | Human | Esophagus | ESCC | 3.04e-51 | 1.78e+00 | 0.1371 |
| 51060 | TXNDC12 | P38T-E | Human | Esophagus | ESCC | 2.85e-09 | 5.02e-01 | 0.127 |
| 51060 | TXNDC12 | P39T-E | Human | Esophagus | ESCC | 1.06e-24 | 6.90e-01 | 0.0894 |
| 51060 | TXNDC12 | P40T-E | Human | Esophagus | ESCC | 9.60e-19 | 7.91e-01 | 0.109 |
| 51060 | TXNDC12 | P42T-E | Human | Esophagus | ESCC | 3.40e-34 | 9.11e-01 | 0.1175 |
| 51060 | TXNDC12 | P44T-E | Human | Esophagus | ESCC | 4.18e-26 | 8.17e-01 | 0.1096 |
| Page: 1 2 3 4 5 6 7 |
| Tissue | Expression Dynamics | Abbreviation |
| Esophagus | 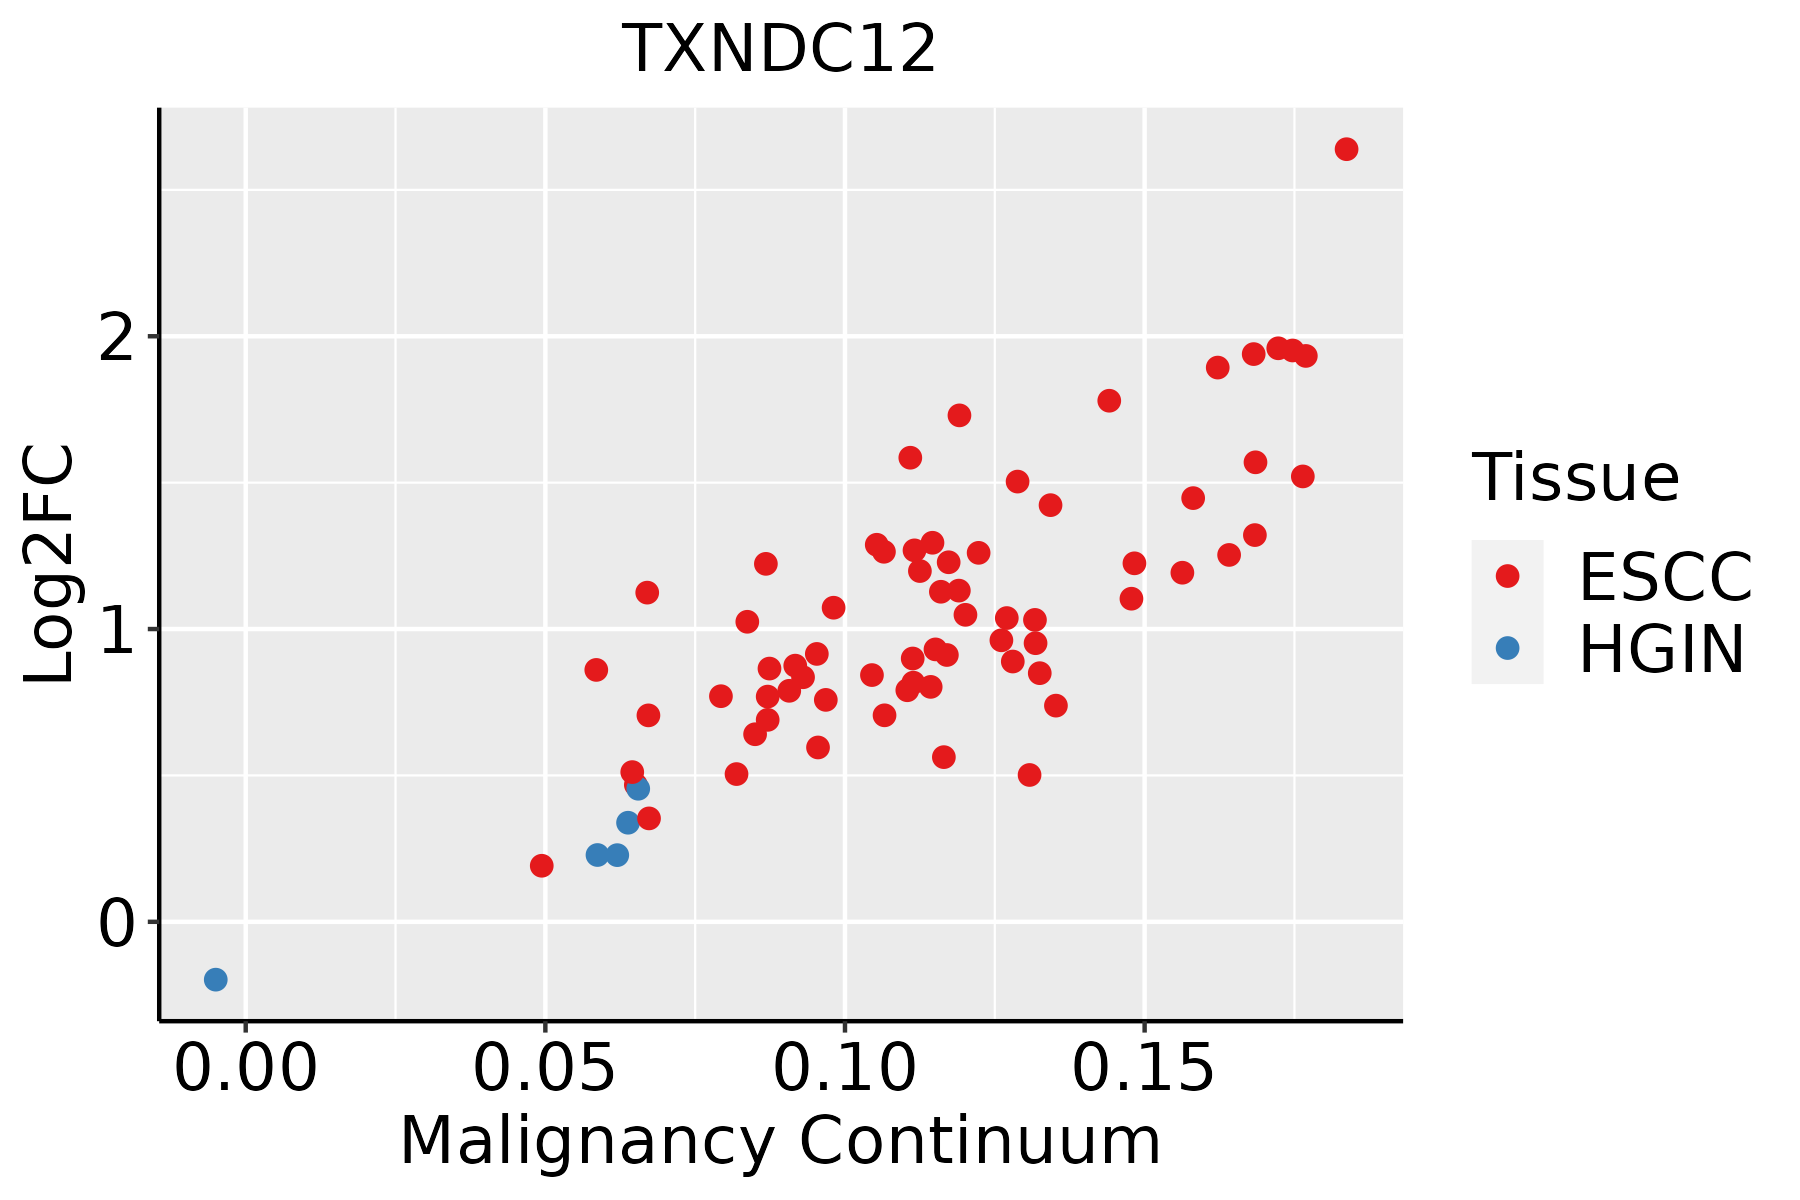 | ESCC: Esophageal squamous cell carcinoma |
| HGIN: High-grade intraepithelial neoplasias | ||
| LGIN: Low-grade intraepithelial neoplasias | ||
| Liver |  | HCC: Hepatocellular carcinoma |
| NAFLD: Non-alcoholic fatty liver disease | ||
| Oral Cavity | 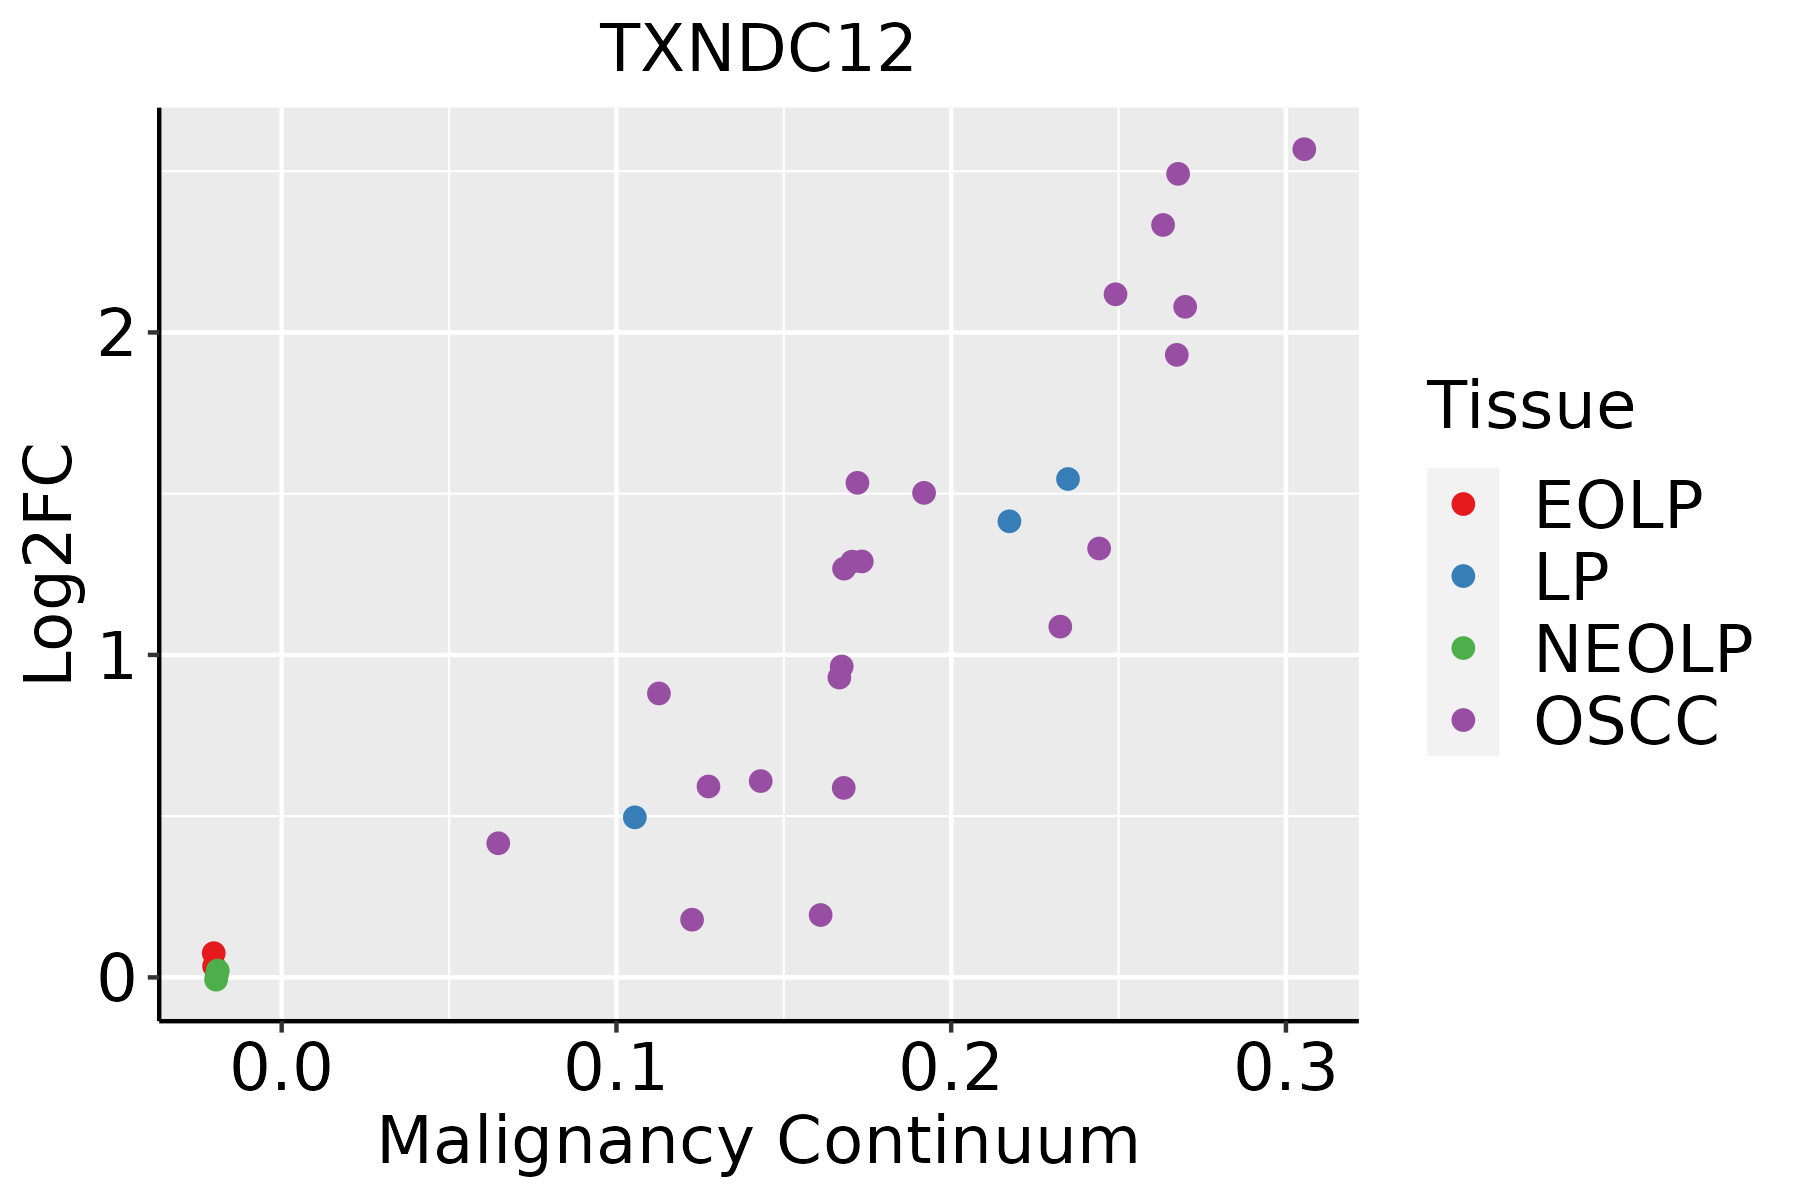 | EOLP: Erosive Oral lichen planus |
| LP: leukoplakia | ||
| NEOLP: Non-erosive oral lichen planus | ||
| OSCC: Oral squamous cell carcinoma | ||
| Skin |  | AK: Actinic keratosis |
| cSCC: Cutaneous squamous cell carcinoma | ||
| SCCIS:squamous cell carcinoma in situ | ||
| Thyroid |  | ATC: Anaplastic thyroid cancer |
| HT: Hashimoto's thyroiditis | ||
| PTC: Papillary thyroid cancer |
| ∗log2FC in expression of this searched gene in stem-like cells from each diseased tissue sample relative to stem-like cells in normal samples in each tissue plotted against the malignancy continuum. Samples are colored based on if they are from different disease stage. |
Top |
Malignant transformation related pathway analysis |
| Find out the enriched GO biological processes and KEGG pathways involved in transition from healthy to precancer to cancer |
| Tissue | Disease Stage | Enriched GO biological Processes |
| Colorectum | AD |  |
| Colorectum | SER |  |
| Colorectum | MSS |  |
| Colorectum | MSI-H |  |
| Colorectum | FAP |  |
| ∗Top 15 enriched GO BP terms are showed in the bar plot of each disease state in each tissue. Each row represents a significant GO biological process which is colored according to the -log10(p.adjust). |
| Page: 1 2 3 4 5 6 7 8 9 |
| GO ID | Tissue | Disease Stage | Description | Gene Ratio | Bg Ratio | pvalue | p.adjust | Count |
| GO:009719327 | Esophagus | HGIN | intrinsic apoptotic signaling pathway | 90/2587 | 288/18723 | 1.50e-14 | 2.80e-12 | 90 |
| GO:003497625 | Esophagus | HGIN | response to endoplasmic reticulum stress | 81/2587 | 256/18723 | 1.47e-13 | 2.32e-11 | 81 |
| GO:200124227 | Esophagus | HGIN | regulation of intrinsic apoptotic signaling pathway | 58/2587 | 164/18723 | 2.57e-12 | 3.58e-10 | 58 |
| GO:200123327 | Esophagus | HGIN | regulation of apoptotic signaling pathway | 97/2587 | 356/18723 | 1.36e-11 | 1.57e-09 | 97 |
| GO:190589725 | Esophagus | HGIN | regulation of response to endoplasmic reticulum stress | 31/2587 | 82/18723 | 5.25e-08 | 2.91e-06 | 31 |
| GO:007005920 | Esophagus | HGIN | intrinsic apoptotic signaling pathway in response to endoplasmic reticulum stress | 25/2587 | 63/18723 | 3.41e-07 | 1.57e-05 | 25 |
| GO:200123427 | Esophagus | HGIN | negative regulation of apoptotic signaling pathway | 59/2587 | 224/18723 | 4.68e-07 | 2.07e-05 | 59 |
| GO:200124325 | Esophagus | HGIN | negative regulation of intrinsic apoptotic signaling pathway | 33/2587 | 98/18723 | 4.73e-07 | 2.07e-05 | 33 |
| GO:19022359 | Esophagus | HGIN | regulation of endoplasmic reticulum stress-induced intrinsic apoptotic signaling pathway | 15/2587 | 32/18723 | 6.76e-06 | 2.08e-04 | 15 |
| GO:190357320 | Esophagus | HGIN | negative regulation of response to endoplasmic reticulum stress | 18/2587 | 44/18723 | 8.97e-06 | 2.64e-04 | 18 |
| GO:190223620 | Esophagus | HGIN | negative regulation of endoplasmic reticulum stress-induced intrinsic apoptotic signaling pathway | 11/2587 | 20/18723 | 1.73e-05 | 4.71e-04 | 11 |
| GO:0097193111 | Esophagus | ESCC | intrinsic apoptotic signaling pathway | 222/8552 | 288/18723 | 5.87e-28 | 2.02e-25 | 222 |
| GO:2001233111 | Esophagus | ESCC | regulation of apoptotic signaling pathway | 256/8552 | 356/18723 | 4.11e-24 | 1.04e-21 | 256 |
| GO:0034976111 | Esophagus | ESCC | response to endoplasmic reticulum stress | 192/8552 | 256/18723 | 7.15e-22 | 1.30e-19 | 192 |
| GO:2001242111 | Esophagus | ESCC | regulation of intrinsic apoptotic signaling pathway | 128/8552 | 164/18723 | 1.75e-17 | 1.50e-15 | 128 |
| GO:2001234111 | Esophagus | ESCC | negative regulation of apoptotic signaling pathway | 161/8552 | 224/18723 | 1.24e-15 | 8.09e-14 | 161 |
| GO:2001243111 | Esophagus | ESCC | negative regulation of intrinsic apoptotic signaling pathway | 78/8552 | 98/18723 | 5.50e-12 | 2.10e-10 | 78 |
| GO:1905897111 | Esophagus | ESCC | regulation of response to endoplasmic reticulum stress | 63/8552 | 82/18723 | 8.16e-09 | 1.66e-07 | 63 |
| GO:0070059111 | Esophagus | ESCC | intrinsic apoptotic signaling pathway in response to endoplasmic reticulum stress | 50/8552 | 63/18723 | 4.37e-08 | 7.96e-07 | 50 |
| GO:1903573111 | Esophagus | ESCC | negative regulation of response to endoplasmic reticulum stress | 34/8552 | 44/18723 | 1.90e-05 | 1.67e-04 | 34 |
| Page: 1 2 3 4 5 |
| Pathway ID | Tissue | Disease Stage | Description | Gene Ratio | Bg Ratio | pvalue | p.adjust | qvalue | Count |
| hsa0048018 | Esophagus | ESCC | Glutathione metabolism | 44/4205 | 57/8465 | 1.81e-05 | 9.03e-05 | 4.63e-05 | 44 |
| hsa0048019 | Esophagus | ESCC | Glutathione metabolism | 44/4205 | 57/8465 | 1.81e-05 | 9.03e-05 | 4.63e-05 | 44 |
| hsa004809 | Liver | Cirrhotic | Glutathione metabolism | 30/2530 | 57/8465 | 2.63e-04 | 1.72e-03 | 1.06e-03 | 30 |
| hsa0048012 | Liver | Cirrhotic | Glutathione metabolism | 30/2530 | 57/8465 | 2.63e-04 | 1.72e-03 | 1.06e-03 | 30 |
| hsa0048022 | Liver | HCC | Glutathione metabolism | 42/4020 | 57/8465 | 5.00e-05 | 2.62e-04 | 1.46e-04 | 42 |
| hsa0048032 | Liver | HCC | Glutathione metabolism | 42/4020 | 57/8465 | 5.00e-05 | 2.62e-04 | 1.46e-04 | 42 |
| hsa0048016 | Oral cavity | OSCC | Glutathione metabolism | 36/3704 | 57/8465 | 2.41e-03 | 6.41e-03 | 3.26e-03 | 36 |
| hsa0048017 | Oral cavity | OSCC | Glutathione metabolism | 36/3704 | 57/8465 | 2.41e-03 | 6.41e-03 | 3.26e-03 | 36 |
| hsa0048024 | Oral cavity | LP | Glutathione metabolism | 25/2418 | 57/8465 | 9.58e-03 | 3.47e-02 | 2.24e-02 | 25 |
| hsa0048034 | Oral cavity | LP | Glutathione metabolism | 25/2418 | 57/8465 | 9.58e-03 | 3.47e-02 | 2.24e-02 | 25 |
| Page: 1 |
Top |
Cell-cell communication analysis |
| Identification of potential cell-cell interactions between two cell types and their ligand-receptor pairs for different disease states |
| Ligand | Receptor | LRpair | Pathway | Tissue | Disease Stage |
| Page: 1 |
Top |
Single-cell gene regulatory network inference analysis |
| Find out the significant the regulons (TFs) and the target genes of each regulon across cell types for different disease states |
| TF | Cell Type | Tissue | Disease Stage | Target Gene | RSS | Regulon Activity |
| ∗The dot plots of a searched regulon are shown for all cell subpopulations in each disease state of each tissue based on the regulon specific score inferred using pySCENIC and by calculating the average expression. |
| Page: 1 |
Top |
Somatic mutation of malignant transformation related genes |
| Annotation of somatic variants for genes involved in malignant transformation |
| Hugo Symbol | Variant Class | Variant Classification | dbSNP RS | HGVSc | HGVSp | HGVSp Short | SWISSPROT | BIOTYPE | SIFT | PolyPhen | Tumor Sample Barcode | Tissue | Histology | Sex | Age | Stage | Therapy Types | Drugs | Outcome |
| TXNDC12 | SNV | Missense_Mutation | novel | c.51N>A | p.Phe17Leu | p.F17L | O95881 | protein_coding | tolerated(0.34) | benign(0) | TCGA-CA-6717-01 | Colorectum | colon adenocarcinoma | Male | <65 | I/II | Chemotherapy | oxaliplatin | CR |
| TXNDC12 | SNV | Missense_Mutation | c.310G>T | p.Asp104Tyr | p.D104Y | O95881 | protein_coding | deleterious(0.04) | probably_damaging(0.911) | TCGA-AG-A002-01 | Colorectum | rectum adenocarcinoma | Male | <65 | I/II | Unknown | Unknown | SD | |
| TXNDC12 | SNV | Missense_Mutation | rs779015159 | c.359C>T | p.Pro120Leu | p.P120L | O95881 | protein_coding | deleterious(0) | possibly_damaging(0.681) | TCGA-A5-A1OF-01 | Endometrium | uterine corpus endometrioid carcinoma | Female | <65 | I/II | Unknown | Unknown | SD |
| TXNDC12 | SNV | Missense_Mutation | novel | c.309A>C | p.Glu103Asp | p.E103D | O95881 | protein_coding | tolerated(0.22) | benign(0) | TCGA-A5-A1OF-01 | Endometrium | uterine corpus endometrioid carcinoma | Female | <65 | I/II | Unknown | Unknown | SD |
| TXNDC12 | SNV | Missense_Mutation | novel | c.303N>C | p.Lys101Asn | p.K101N | O95881 | protein_coding | tolerated(0.13) | benign(0.019) | TCGA-AJ-A5DW-01 | Endometrium | uterine corpus endometrioid carcinoma | Female | <65 | I/II | Unknown | Unknown | SD |
| TXNDC12 | SNV | Missense_Mutation | rs763663263 | c.433N>A | p.Glu145Lys | p.E145K | O95881 | protein_coding | tolerated(0.14) | benign(0.035) | TCGA-AP-A0LM-01 | Endometrium | uterine corpus endometrioid carcinoma | Female | <65 | III/IV | Chemotherapy | cisplatin | SD |
| TXNDC12 | SNV | Missense_Mutation | c.225N>C | p.Lys75Asn | p.K75N | O95881 | protein_coding | deleterious(0.02) | probably_damaging(0.975) | TCGA-AX-A0J0-01 | Endometrium | uterine corpus endometrioid carcinoma | Female | <65 | I/II | Unknown | Unknown | SD | |
| TXNDC12 | SNV | Missense_Mutation | c.58N>A | p.Leu20Ile | p.L20I | O95881 | protein_coding | tolerated(0.55) | benign(0.001) | TCGA-BS-A0TA-01 | Endometrium | uterine corpus endometrioid carcinoma | Female | <65 | III/IV | Chemotherapy | taxol | PD | |
| TXNDC12 | SNV | Missense_Mutation | novel | c.106G>A | p.Asp36Asn | p.D36N | O95881 | protein_coding | deleterious(0.01) | benign(0.301) | TCGA-EO-A22X-01 | Endometrium | uterine corpus endometrioid carcinoma | Female | <65 | III/IV | Unspecific | Carboplatin | Complete Response |
| TXNDC12 | SNV | Missense_Mutation | novel | c.283N>C | p.Glu95Gln | p.E95Q | O95881 | protein_coding | tolerated(0.12) | benign(0.33) | TCGA-49-AARQ-01 | Lung | lung adenocarcinoma | Female | <65 | I/II | Unknown | Unknown | SD |
| Page: 1 2 |
Top |
Related drugs of malignant transformation related genes |
| Identification of chemicals and drugs interact with genes involved in malignant transfromation |
| (DGIdb 4.0) |
| Entrez ID | Symbol | Category | Interaction Types | Drug Claim Name | Drug Name | PMIDs |
| Page: 1 |

Copyright 2023-Present -The University of Texas Health Science Center at Houston |