
|
|||||
|
 | |
| |
| |
| |
| |
| |
|
Gene: TTC8 |
Gene summary for TTC8 |
| Gene information | Species | Human | Gene symbol | TTC8 | Gene ID | 123016 |
| Gene name | tetratricopeptide repeat domain 8 | |
| Gene Alias | BBS8 | |
| Cytomap | 14q31.3 | |
| Gene Type | protein-coding | GO ID | GO:0000902 | UniProtAcc | A0A0C4DGX9 |
Top |
Malignant transformation analysis |
| Identification of the aberrant gene expression in precancerous and cancerous lesions by comparing the gene expression of stem-like cells in diseased tissues with normal stem cells |
| Entrez ID | Symbol | Replicates | Species | Organ | Tissue | Adj P-value | Log2FC | Malignancy |
| 123016 | TTC8 | P23T-E | Human | Esophagus | ESCC | 2.29e-14 | 2.98e-01 | 0.108 |
| 123016 | TTC8 | P24T-E | Human | Esophagus | ESCC | 2.42e-11 | 1.10e-01 | 0.1287 |
| 123016 | TTC8 | P26T-E | Human | Esophagus | ESCC | 8.38e-14 | 1.93e-01 | 0.1276 |
| 123016 | TTC8 | P27T-E | Human | Esophagus | ESCC | 7.48e-21 | 2.37e-01 | 0.1055 |
| 123016 | TTC8 | P28T-E | Human | Esophagus | ESCC | 6.36e-12 | 1.51e-01 | 0.1149 |
| 123016 | TTC8 | P30T-E | Human | Esophagus | ESCC | 1.77e-10 | 3.04e-01 | 0.137 |
| 123016 | TTC8 | P31T-E | Human | Esophagus | ESCC | 6.07e-23 | 1.22e-01 | 0.1251 |
| 123016 | TTC8 | P32T-E | Human | Esophagus | ESCC | 2.17e-18 | 2.37e-01 | 0.1666 |
| 123016 | TTC8 | P36T-E | Human | Esophagus | ESCC | 6.80e-08 | 2.44e-01 | 0.1187 |
| 123016 | TTC8 | P37T-E | Human | Esophagus | ESCC | 1.05e-23 | 4.07e-01 | 0.1371 |
| 123016 | TTC8 | P38T-E | Human | Esophagus | ESCC | 5.95e-06 | 2.24e-01 | 0.127 |
| 123016 | TTC8 | P39T-E | Human | Esophagus | ESCC | 1.09e-06 | 3.33e-02 | 0.0894 |
| 123016 | TTC8 | P40T-E | Human | Esophagus | ESCC | 2.04e-05 | 9.22e-02 | 0.109 |
| 123016 | TTC8 | P42T-E | Human | Esophagus | ESCC | 3.14e-11 | 2.58e-01 | 0.1175 |
| 123016 | TTC8 | P44T-E | Human | Esophagus | ESCC | 2.82e-05 | 1.76e-01 | 0.1096 |
| 123016 | TTC8 | P47T-E | Human | Esophagus | ESCC | 1.62e-10 | 1.38e-01 | 0.1067 |
| 123016 | TTC8 | P48T-E | Human | Esophagus | ESCC | 6.00e-09 | 1.12e-01 | 0.0959 |
| 123016 | TTC8 | P49T-E | Human | Esophagus | ESCC | 6.64e-13 | 9.61e-01 | 0.1768 |
| 123016 | TTC8 | P52T-E | Human | Esophagus | ESCC | 2.07e-08 | 1.82e-01 | 0.1555 |
| 123016 | TTC8 | P54T-E | Human | Esophagus | ESCC | 5.55e-12 | 1.97e-01 | 0.0975 |
| Page: 1 2 3 4 |
| Tissue | Expression Dynamics | Abbreviation |
| Esophagus | 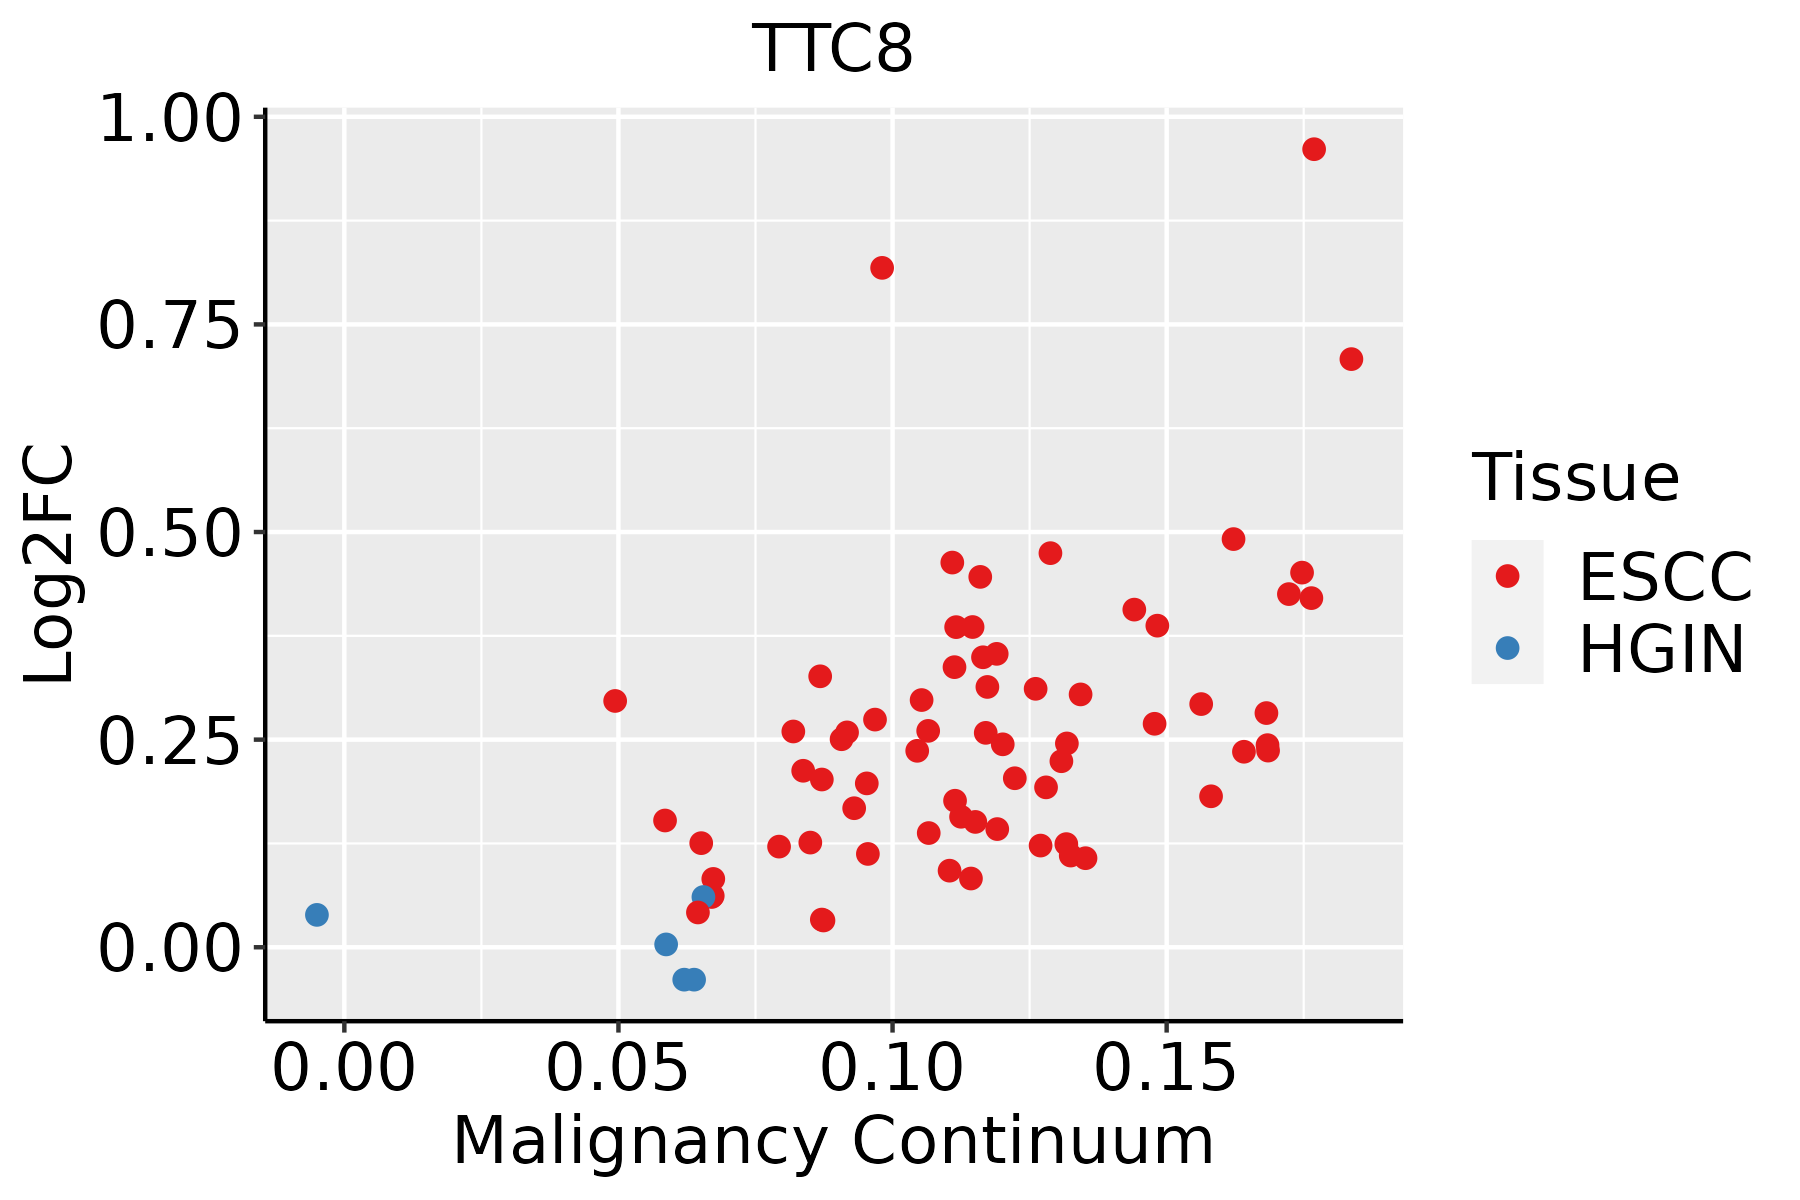 | ESCC: Esophageal squamous cell carcinoma |
| HGIN: High-grade intraepithelial neoplasias | ||
| LGIN: Low-grade intraepithelial neoplasias |
| ∗log2FC in expression of this searched gene in stem-like cells from each diseased tissue sample relative to stem-like cells in normal samples in each tissue plotted against the malignancy continuum. Samples are colored based on if they are from different disease stage. |
Top |
Malignant transformation related pathway analysis |
| Find out the enriched GO biological processes and KEGG pathways involved in transition from healthy to precancer to cancer |
| Tissue | Disease Stage | Enriched GO biological Processes |
| Colorectum | AD |  |
| Colorectum | SER |  |
| Colorectum | MSS |  |
| Colorectum | MSI-H |  |
| Colorectum | FAP |  |
| ∗Top 15 enriched GO BP terms are showed in the bar plot of each disease state in each tissue. Each row represents a significant GO biological process which is colored according to the -log10(p.adjust). |
| Page: 1 2 3 4 5 6 7 8 9 |
| GO ID | Tissue | Disease Stage | Description | Gene Ratio | Bg Ratio | pvalue | p.adjust | Count |
| GO:0072659110 | Esophagus | ESCC | protein localization to plasma membrane | 193/8552 | 284/18723 | 1.95e-14 | 1.03e-12 | 193 |
| GO:199077819 | Esophagus | ESCC | protein localization to cell periphery | 217/8552 | 333/18723 | 4.08e-13 | 1.88e-11 | 217 |
| GO:1902903111 | Esophagus | ESCC | regulation of supramolecular fiber organization | 237/8552 | 383/18723 | 9.06e-11 | 2.75e-09 | 237 |
| GO:000716320 | Esophagus | ESCC | establishment or maintenance of cell polarity | 143/8552 | 218/18723 | 2.05e-09 | 4.65e-08 | 143 |
| GO:000701527 | Esophagus | ESCC | actin filament organization | 259/8552 | 442/18723 | 2.37e-08 | 4.50e-07 | 259 |
| GO:003001018 | Esophagus | ESCC | establishment of cell polarity | 96/8552 | 143/18723 | 1.69e-07 | 2.67e-06 | 96 |
| GO:0032970111 | Esophagus | ESCC | regulation of actin filament-based process | 231/8552 | 397/18723 | 2.91e-07 | 4.20e-06 | 231 |
| GO:0032956111 | Esophagus | ESCC | regulation of actin cytoskeleton organization | 210/8552 | 358/18723 | 4.40e-07 | 6.00e-06 | 210 |
| GO:011005327 | Esophagus | ESCC | regulation of actin filament organization | 166/8552 | 278/18723 | 1.54e-06 | 1.85e-05 | 166 |
| GO:005101727 | Esophagus | ESCC | actin filament bundle assembly | 100/8552 | 157/18723 | 3.87e-06 | 4.17e-05 | 100 |
| GO:006157227 | Esophagus | ESCC | actin filament bundle organization | 101/8552 | 161/18723 | 9.22e-06 | 8.82e-05 | 101 |
| GO:00017387 | Esophagus | ESCC | morphogenesis of a polarized epithelium | 63/8552 | 94/18723 | 2.34e-05 | 2.00e-04 | 63 |
| GO:00454449 | Esophagus | ESCC | fat cell differentiation | 135/8552 | 229/18723 | 3.38e-05 | 2.78e-04 | 135 |
| GO:009016216 | Esophagus | ESCC | establishment of epithelial cell polarity | 25/8552 | 31/18723 | 7.13e-05 | 5.38e-04 | 25 |
| GO:00308595 | Esophagus | ESCC | polarized epithelial cell differentiation | 20/8552 | 24/18723 | 1.69e-04 | 1.11e-03 | 20 |
| GO:00611625 | Esophagus | ESCC | establishment of monopolar cell polarity | 20/8552 | 24/18723 | 1.69e-04 | 1.11e-03 | 20 |
| GO:0051346110 | Esophagus | ESCC | negative regulation of hydrolase activity | 208/8552 | 379/18723 | 1.76e-04 | 1.14e-03 | 208 |
| GO:003003820 | Esophagus | ESCC | contractile actin filament bundle assembly | 67/8552 | 106/18723 | 2.03e-04 | 1.28e-03 | 67 |
| GO:004314920 | Esophagus | ESCC | stress fiber assembly | 67/8552 | 106/18723 | 2.03e-04 | 1.28e-03 | 67 |
| GO:006156415 | Esophagus | ESCC | axon development | 251/8552 | 467/18723 | 2.41e-04 | 1.49e-03 | 251 |
| Page: 1 2 |
| Pathway ID | Tissue | Disease Stage | Description | Gene Ratio | Bg Ratio | pvalue | p.adjust | qvalue | Count |
| Page: 1 |
Top |
Cell-cell communication analysis |
| Identification of potential cell-cell interactions between two cell types and their ligand-receptor pairs for different disease states |
| Ligand | Receptor | LRpair | Pathway | Tissue | Disease Stage |
| Page: 1 |
Top |
Single-cell gene regulatory network inference analysis |
| Find out the significant the regulons (TFs) and the target genes of each regulon across cell types for different disease states |
| TF | Cell Type | Tissue | Disease Stage | Target Gene | RSS | Regulon Activity |
| ∗The dot plots of a searched regulon are shown for all cell subpopulations in each disease state of each tissue based on the regulon specific score inferred using pySCENIC and by calculating the average expression. |
| Page: 1 |
Top |
Somatic mutation of malignant transformation related genes |
| Annotation of somatic variants for genes involved in malignant transformation |
| Hugo Symbol | Variant Class | Variant Classification | dbSNP RS | HGVSc | HGVSp | HGVSp Short | SWISSPROT | BIOTYPE | SIFT | PolyPhen | Tumor Sample Barcode | Tissue | Histology | Sex | Age | Stage | Therapy Types | Drugs | Outcome |
| TTC8 | SNV | Missense_Mutation | novel | c.797N>T | p.Ser266Leu | p.S266L | protein_coding | deleterious(0) | possibly_damaging(0.749) | TCGA-AN-A0AS-01 | Breast | breast invasive carcinoma | Female | >=65 | III/IV | Unknown | Unknown | SD | |
| TTC8 | SNV | Missense_Mutation | c.1494N>C | p.Gln498His | p.Q498H | protein_coding | tolerated(0.14) | benign(0.25) | TCGA-C5-A1BQ-01 | Cervix | cervical & endocervical cancer | Female | >=65 | III/IV | Chemotherapy | cisplatin | CR | ||
| TTC8 | SNV | Missense_Mutation | rs755412340 | c.1099N>T | p.Arg367Trp | p.R367W | protein_coding | deleterious(0) | probably_damaging(0.988) | TCGA-AA-A010-01 | Colorectum | colon adenocarcinoma | Female | <65 | I/II | Chemotherapy | folinic | CR | |
| TTC8 | SNV | Missense_Mutation | c.492T>A | p.Phe164Leu | p.F164L | protein_coding | deleterious(0) | possibly_damaging(0.835) | TCGA-AD-6901-01 | Colorectum | colon adenocarcinoma | Male | >=65 | I/II | Chemotherapy | xeloda | PD | ||
| TTC8 | SNV | Missense_Mutation | novel | c.1211C>A | p.Ser404Tyr | p.S404Y | protein_coding | tolerated(0.42) | benign(0.031) | TCGA-CA-6717-01 | Colorectum | colon adenocarcinoma | Male | <65 | I/II | Chemotherapy | oxaliplatin | CR | |
| TTC8 | SNV | Missense_Mutation | rs760040510 | c.773N>A | p.Arg258His | p.R258H | protein_coding | deleterious(0) | probably_damaging(0.981) | TCGA-G4-6588-01 | Colorectum | colon adenocarcinoma | Female | <65 | I/II | Unknown | Unknown | SD | |
| TTC8 | insertion | Frame_Shift_Ins | novel | c.805_806insGGATGAATAG | p.Lys269ArgfsTer38 | p.K269Rfs*38 | protein_coding | TCGA-AM-5820-01 | Colorectum | colon adenocarcinoma | Female | <65 | I/II | Unknown | Unknown | SD | |||
| TTC8 | SNV | Missense_Mutation | c.452N>C | p.Leu151Pro | p.L151P | protein_coding | deleterious(0.02) | probably_damaging(0.951) | TCGA-A5-A0GB-01 | Endometrium | uterine corpus endometrioid carcinoma | Female | >=65 | I/II | Unknown | Unknown | SD | ||
| TTC8 | SNV | Missense_Mutation | c.168A>C | p.Glu56Asp | p.E56D | protein_coding | tolerated(0.74) | benign(0.02) | TCGA-AP-A056-01 | Endometrium | uterine corpus endometrioid carcinoma | Female | <65 | I/II | Unknown | Unknown | SD | ||
| TTC8 | SNV | Missense_Mutation | novel | c.1022A>G | p.His341Arg | p.H341R | protein_coding | deleterious(0.01) | benign(0.355) | TCGA-AP-A1DK-01 | Endometrium | uterine corpus endometrioid carcinoma | Female | <65 | I/II | Unknown | Unknown | SD |
| Page: 1 2 3 4 5 6 |
Top |
Related drugs of malignant transformation related genes |
| Identification of chemicals and drugs interact with genes involved in malignant transfromation |
| (DGIdb 4.0) |
| Entrez ID | Symbol | Category | Interaction Types | Drug Claim Name | Drug Name | PMIDs |
| Page: 1 |

Copyright 2023-Present -The University of Texas Health Science Center at Houston |