
|
|||||
|
 | |
| |
| |
| |
| |
| |
|
Gene: TTC4 |
Gene summary for TTC4 |
| Gene information | Species | Human | Gene symbol | TTC4 | Gene ID | 7268 |
| Gene name | tetratricopeptide repeat domain 4 | |
| Gene Alias | CNS1 | |
| Cytomap | 1p32.3 | |
| Gene Type | protein-coding | GO ID | GO:0002376 | UniProtAcc | O95801 |
Top |
Malignant transformation analysis |
| Identification of the aberrant gene expression in precancerous and cancerous lesions by comparing the gene expression of stem-like cells in diseased tissues with normal stem cells |
| Entrez ID | Symbol | Replicates | Species | Organ | Tissue | Adj P-value | Log2FC | Malignancy |
| 7268 | TTC4 | P20T-E | Human | Esophagus | ESCC | 1.16e-15 | 3.38e-01 | 0.1124 |
| 7268 | TTC4 | P21T-E | Human | Esophagus | ESCC | 3.58e-28 | 4.65e-01 | 0.1617 |
| 7268 | TTC4 | P22T-E | Human | Esophagus | ESCC | 1.88e-04 | 1.21e-01 | 0.1236 |
| 7268 | TTC4 | P23T-E | Human | Esophagus | ESCC | 6.91e-16 | 4.04e-01 | 0.108 |
| 7268 | TTC4 | P24T-E | Human | Esophagus | ESCC | 1.88e-11 | 2.64e-01 | 0.1287 |
| 7268 | TTC4 | P26T-E | Human | Esophagus | ESCC | 3.28e-14 | 2.60e-01 | 0.1276 |
| 7268 | TTC4 | P27T-E | Human | Esophagus | ESCC | 3.28e-14 | 2.92e-01 | 0.1055 |
| 7268 | TTC4 | P28T-E | Human | Esophagus | ESCC | 2.03e-09 | 1.76e-01 | 0.1149 |
| 7268 | TTC4 | P30T-E | Human | Esophagus | ESCC | 1.19e-09 | 3.03e-01 | 0.137 |
| 7268 | TTC4 | P31T-E | Human | Esophagus | ESCC | 2.27e-21 | 3.61e-01 | 0.1251 |
| 7268 | TTC4 | P32T-E | Human | Esophagus | ESCC | 1.25e-26 | 4.71e-01 | 0.1666 |
| 7268 | TTC4 | P36T-E | Human | Esophagus | ESCC | 3.71e-09 | 2.71e-01 | 0.1187 |
| 7268 | TTC4 | P37T-E | Human | Esophagus | ESCC | 3.37e-15 | 2.81e-01 | 0.1371 |
| 7268 | TTC4 | P38T-E | Human | Esophagus | ESCC | 6.95e-06 | 2.02e-01 | 0.127 |
| 7268 | TTC4 | P39T-E | Human | Esophagus | ESCC | 2.93e-15 | 3.20e-01 | 0.0894 |
| 7268 | TTC4 | P40T-E | Human | Esophagus | ESCC | 2.37e-02 | 1.07e-01 | 0.109 |
| 7268 | TTC4 | P42T-E | Human | Esophagus | ESCC | 1.72e-09 | 2.55e-01 | 0.1175 |
| 7268 | TTC4 | P44T-E | Human | Esophagus | ESCC | 2.29e-03 | 1.35e-01 | 0.1096 |
| 7268 | TTC4 | P47T-E | Human | Esophagus | ESCC | 3.50e-02 | 8.66e-02 | 0.1067 |
| 7268 | TTC4 | P48T-E | Human | Esophagus | ESCC | 2.06e-08 | 1.62e-01 | 0.0959 |
| Page: 1 2 3 4 |
| Tissue | Expression Dynamics | Abbreviation |
| Esophagus | 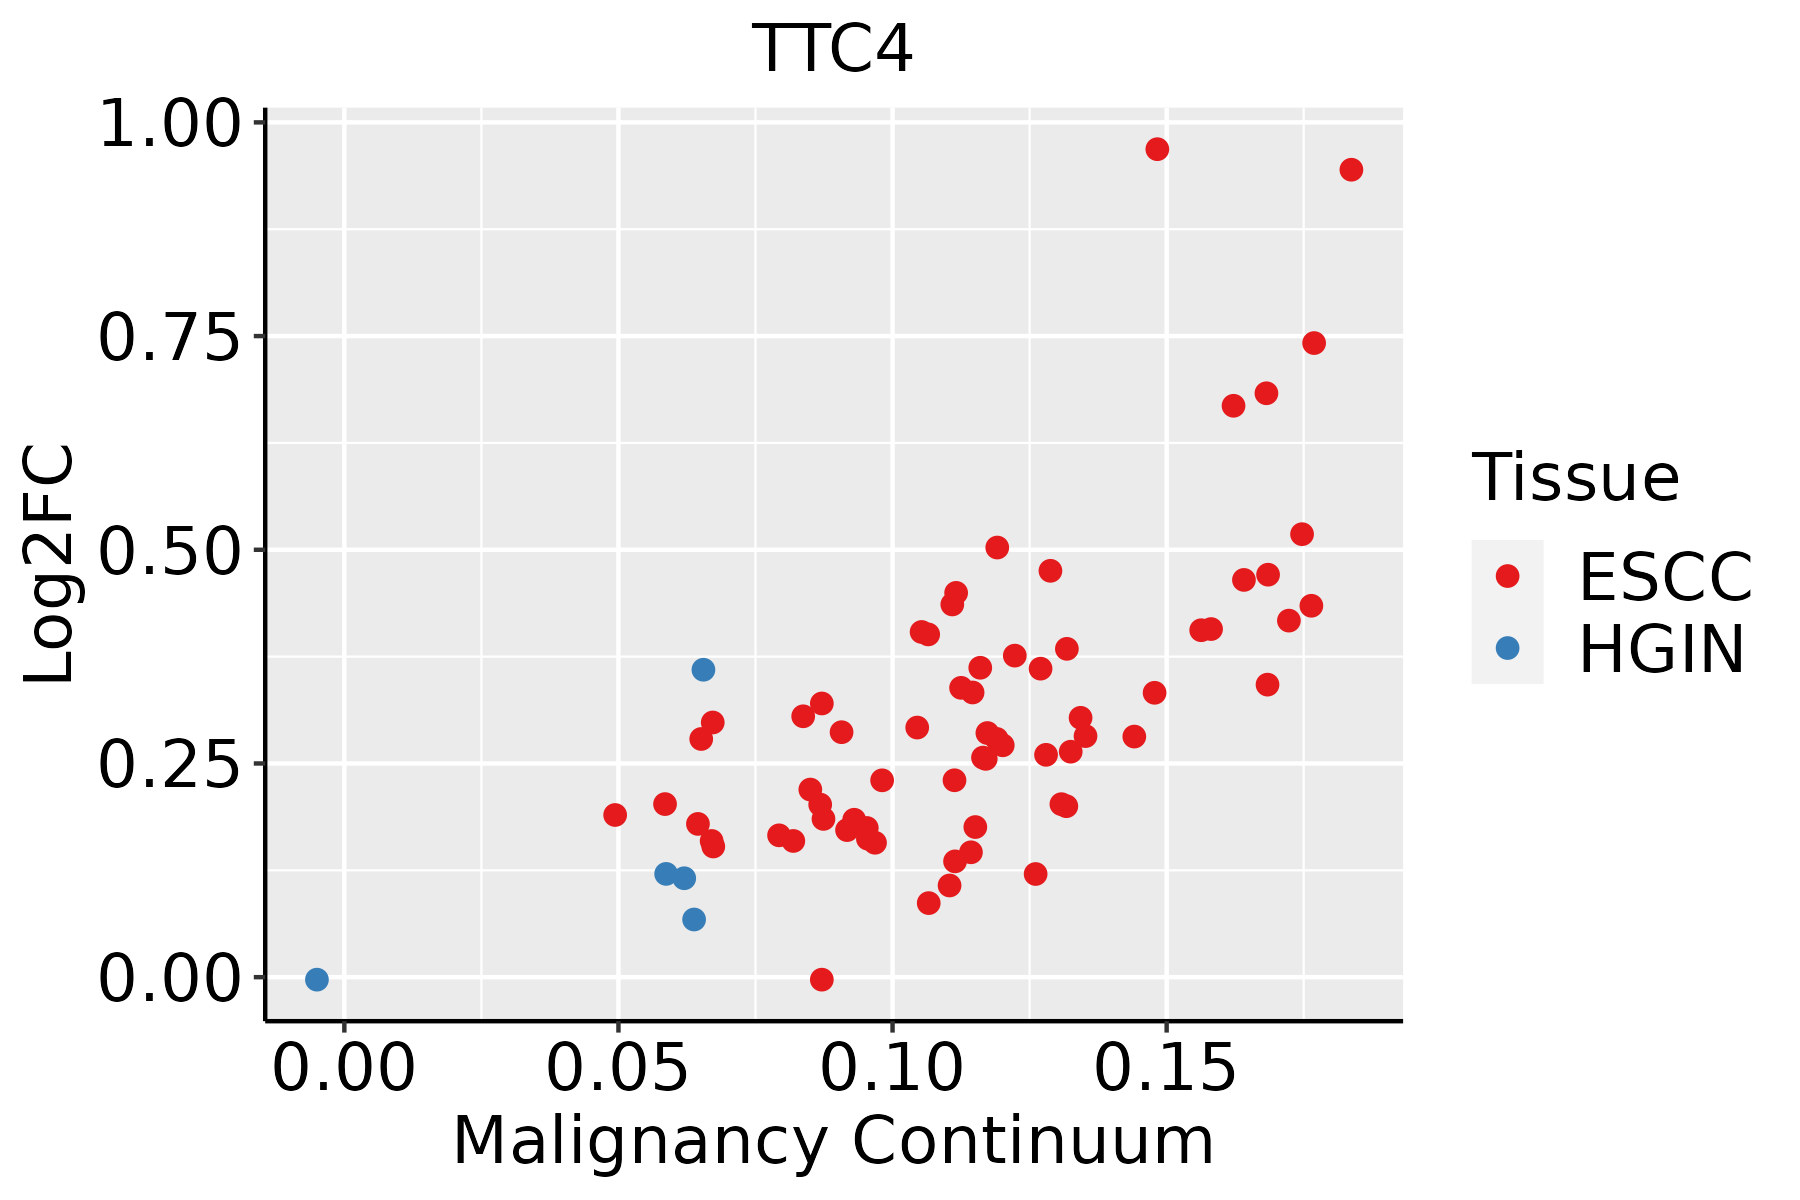 | ESCC: Esophageal squamous cell carcinoma |
| HGIN: High-grade intraepithelial neoplasias | ||
| LGIN: Low-grade intraepithelial neoplasias |
| ∗log2FC in expression of this searched gene in stem-like cells from each diseased tissue sample relative to stem-like cells in normal samples in each tissue plotted against the malignancy continuum. Samples are colored based on if they are from different disease stage. |
Top |
Malignant transformation related pathway analysis |
| Find out the enriched GO biological processes and KEGG pathways involved in transition from healthy to precancer to cancer |
| Tissue | Disease Stage | Enriched GO biological Processes |
| Colorectum | AD |  |
| Colorectum | SER |  |
| Colorectum | MSS |  |
| Colorectum | MSI-H |  |
| Colorectum | FAP |  |
| ∗Top 15 enriched GO BP terms are showed in the bar plot of each disease state in each tissue. Each row represents a significant GO biological process which is colored according to the -log10(p.adjust). |
| Page: 1 2 3 4 5 6 7 8 9 |
| GO ID | Tissue | Disease Stage | Description | Gene Ratio | Bg Ratio | pvalue | p.adjust | Count |
| GO:000961518 | Esophagus | ESCC | response to virus | 238/8552 | 367/18723 | 6.65e-14 | 3.32e-12 | 238 |
| GO:00516075 | Esophagus | ESCC | defense response to virus | 171/8552 | 265/18723 | 3.91e-10 | 1.05e-08 | 171 |
| GO:01405465 | Esophagus | ESCC | defense response to symbiont | 171/8552 | 265/18723 | 3.91e-10 | 1.05e-08 | 171 |
| Page: 1 |
| Pathway ID | Tissue | Disease Stage | Description | Gene Ratio | Bg Ratio | pvalue | p.adjust | qvalue | Count |
| Page: 1 |
Top |
Cell-cell communication analysis |
| Identification of potential cell-cell interactions between two cell types and their ligand-receptor pairs for different disease states |
| Ligand | Receptor | LRpair | Pathway | Tissue | Disease Stage |
| Page: 1 |
Top |
Single-cell gene regulatory network inference analysis |
| Find out the significant the regulons (TFs) and the target genes of each regulon across cell types for different disease states |
| TF | Cell Type | Tissue | Disease Stage | Target Gene | RSS | Regulon Activity |
| ∗The dot plots of a searched regulon are shown for all cell subpopulations in each disease state of each tissue based on the regulon specific score inferred using pySCENIC and by calculating the average expression. |
| Page: 1 |
Top |
Somatic mutation of malignant transformation related genes |
| Annotation of somatic variants for genes involved in malignant transformation |
| Hugo Symbol | Variant Class | Variant Classification | dbSNP RS | HGVSc | HGVSp | HGVSp Short | SWISSPROT | BIOTYPE | SIFT | PolyPhen | Tumor Sample Barcode | Tissue | Histology | Sex | Age | Stage | Therapy Types | Drugs | Outcome |
| TTC4 | SNV | Missense_Mutation | c.639G>C | p.Lys213Asn | p.K213N | O95801 | protein_coding | deleterious(0.01) | possibly_damaging(0.859) | TCGA-A8-A09G-01 | Breast | breast invasive carcinoma | Female | >=65 | III/IV | Unknown | Unknown | SD | |
| TTC4 | SNV | Missense_Mutation | c.668T>C | p.Leu223Pro | p.L223P | O95801 | protein_coding | deleterious(0) | benign(0.024) | TCGA-A8-A09T-01 | Breast | breast invasive carcinoma | Female | >=65 | I/II | Hormone Therapy | anastrozole | SD | |
| TTC4 | SNV | Missense_Mutation | novel | c.448N>A | p.His150Asn | p.H150N | O95801 | protein_coding | deleterious(0) | possibly_damaging(0.889) | TCGA-AN-A0AK-01 | Breast | breast invasive carcinoma | Female | >=65 | I/II | Unknown | Unknown | SD |
| TTC4 | SNV | Missense_Mutation | c.572G>C | p.Arg191Thr | p.R191T | O95801 | protein_coding | deleterious(0) | possibly_damaging(0.893) | TCGA-B6-A0RU-01 | Breast | breast invasive carcinoma | Female | <65 | I/II | Unknown | Unknown | PD | |
| TTC4 | SNV | Missense_Mutation | c.118N>C | p.Glu40Gln | p.E40Q | O95801 | protein_coding | deleterious(0.02) | benign(0.054) | TCGA-GM-A2D9-01 | Breast | breast invasive carcinoma | Female | >=65 | I/II | Hormone Therapy | arimidex | SD | |
| TTC4 | insertion | Nonsense_Mutation | novel | c.553_554insTATTTTTCTGATAATTCTGATTATTCATT | p.Lys185IlefsTer4 | p.K185Ifs*4 | O95801 | protein_coding | TCGA-B6-A0IA-01 | Breast | breast invasive carcinoma | Female | <65 | I/II | Unknown | Unknown | SD | ||
| TTC4 | SNV | Missense_Mutation | novel | c.739N>A | p.Gly247Ser | p.G247S | O95801 | protein_coding | tolerated(0.06) | benign(0.007) | TCGA-CA-6717-01 | Colorectum | colon adenocarcinoma | Male | <65 | I/II | Chemotherapy | oxaliplatin | CR |
| TTC4 | SNV | Missense_Mutation | c.251A>G | p.Asp84Gly | p.D84G | O95801 | protein_coding | deleterious(0.03) | benign(0.081) | TCGA-CK-5914-01 | Colorectum | colon adenocarcinoma | Male | >=65 | III/IV | Unknown | Unknown | SD | |
| TTC4 | SNV | Missense_Mutation | novel | c.745N>T | p.Gly249Cys | p.G249C | O95801 | protein_coding | deleterious(0.04) | benign(0.237) | TCGA-AP-A1DK-01 | Endometrium | uterine corpus endometrioid carcinoma | Female | <65 | I/II | Unknown | Unknown | SD |
| TTC4 | SNV | Missense_Mutation | novel | c.190N>A | p.Leu64Ile | p.L64I | O95801 | protein_coding | tolerated(0.21) | benign(0.059) | TCGA-AP-A1DV-01 | Endometrium | uterine corpus endometrioid carcinoma | Female | <65 | I/II | Unknown | Unknown | SD |
| Page: 1 2 3 4 |
Top |
Related drugs of malignant transformation related genes |
| Identification of chemicals and drugs interact with genes involved in malignant transfromation |
| (DGIdb 4.0) |
| Entrez ID | Symbol | Category | Interaction Types | Drug Claim Name | Drug Name | PMIDs |
| Page: 1 |

Copyright 2023-Present -The University of Texas Health Science Center at Houston |