
|
|||||
|
 | |
| |
| |
| |
| |
| |
|
Gene: TRIB2 |
Gene summary for TRIB2 |
| Gene information | Species | Human | Gene symbol | TRIB2 | Gene ID | 28951 |
| Gene name | tribbles pseudokinase 2 | |
| Gene Alias | C5FW | |
| Cytomap | 2p24.3 | |
| Gene Type | protein-coding | GO ID | GO:0001816 | UniProtAcc | Q92519 |
Top |
Malignant transformation analysis |
| Identification of the aberrant gene expression in precancerous and cancerous lesions by comparing the gene expression of stem-like cells in diseased tissues with normal stem cells |
| Entrez ID | Symbol | Replicates | Species | Organ | Tissue | Adj P-value | Log2FC | Malignancy |
| 28951 | TRIB2 | P26T-E | Human | Esophagus | ESCC | 4.92e-12 | 2.79e-01 | 0.1276 |
| 28951 | TRIB2 | P27T-E | Human | Esophagus | ESCC | 3.69e-12 | 2.13e-01 | 0.1055 |
| 28951 | TRIB2 | P28T-E | Human | Esophagus | ESCC | 1.46e-13 | 3.22e-01 | 0.1149 |
| 28951 | TRIB2 | P30T-E | Human | Esophagus | ESCC | 4.62e-24 | 9.09e-01 | 0.137 |
| 28951 | TRIB2 | P31T-E | Human | Esophagus | ESCC | 1.08e-10 | 1.29e-01 | 0.1251 |
| 28951 | TRIB2 | P32T-E | Human | Esophagus | ESCC | 6.12e-12 | 3.51e-01 | 0.1666 |
| 28951 | TRIB2 | P36T-E | Human | Esophagus | ESCC | 7.82e-05 | 2.79e-01 | 0.1187 |
| 28951 | TRIB2 | P37T-E | Human | Esophagus | ESCC | 1.57e-02 | 8.35e-02 | 0.1371 |
| 28951 | TRIB2 | P39T-E | Human | Esophagus | ESCC | 7.63e-09 | 5.00e-03 | 0.0894 |
| 28951 | TRIB2 | P40T-E | Human | Esophagus | ESCC | 3.56e-09 | 2.60e-01 | 0.109 |
| 28951 | TRIB2 | P42T-E | Human | Esophagus | ESCC | 5.18e-17 | 5.12e-01 | 0.1175 |
| 28951 | TRIB2 | P47T-E | Human | Esophagus | ESCC | 9.65e-09 | 1.10e-02 | 0.1067 |
| 28951 | TRIB2 | P48T-E | Human | Esophagus | ESCC | 3.21e-17 | 2.44e-01 | 0.0959 |
| 28951 | TRIB2 | P49T-E | Human | Esophagus | ESCC | 3.27e-13 | 1.57e+00 | 0.1768 |
| 28951 | TRIB2 | P52T-E | Human | Esophagus | ESCC | 5.70e-11 | 1.47e-01 | 0.1555 |
| 28951 | TRIB2 | P54T-E | Human | Esophagus | ESCC | 5.06e-10 | 1.28e-01 | 0.0975 |
| 28951 | TRIB2 | P56T-E | Human | Esophagus | ESCC | 1.58e-06 | 1.17e+00 | 0.1613 |
| 28951 | TRIB2 | P57T-E | Human | Esophagus | ESCC | 1.63e-07 | 2.62e-01 | 0.0926 |
| 28951 | TRIB2 | P61T-E | Human | Esophagus | ESCC | 2.52e-11 | 3.20e-01 | 0.099 |
| 28951 | TRIB2 | P62T-E | Human | Esophagus | ESCC | 3.08e-45 | 9.02e-01 | 0.1302 |
| Page: 1 2 3 4 5 |
| Tissue | Expression Dynamics | Abbreviation |
| Esophagus | 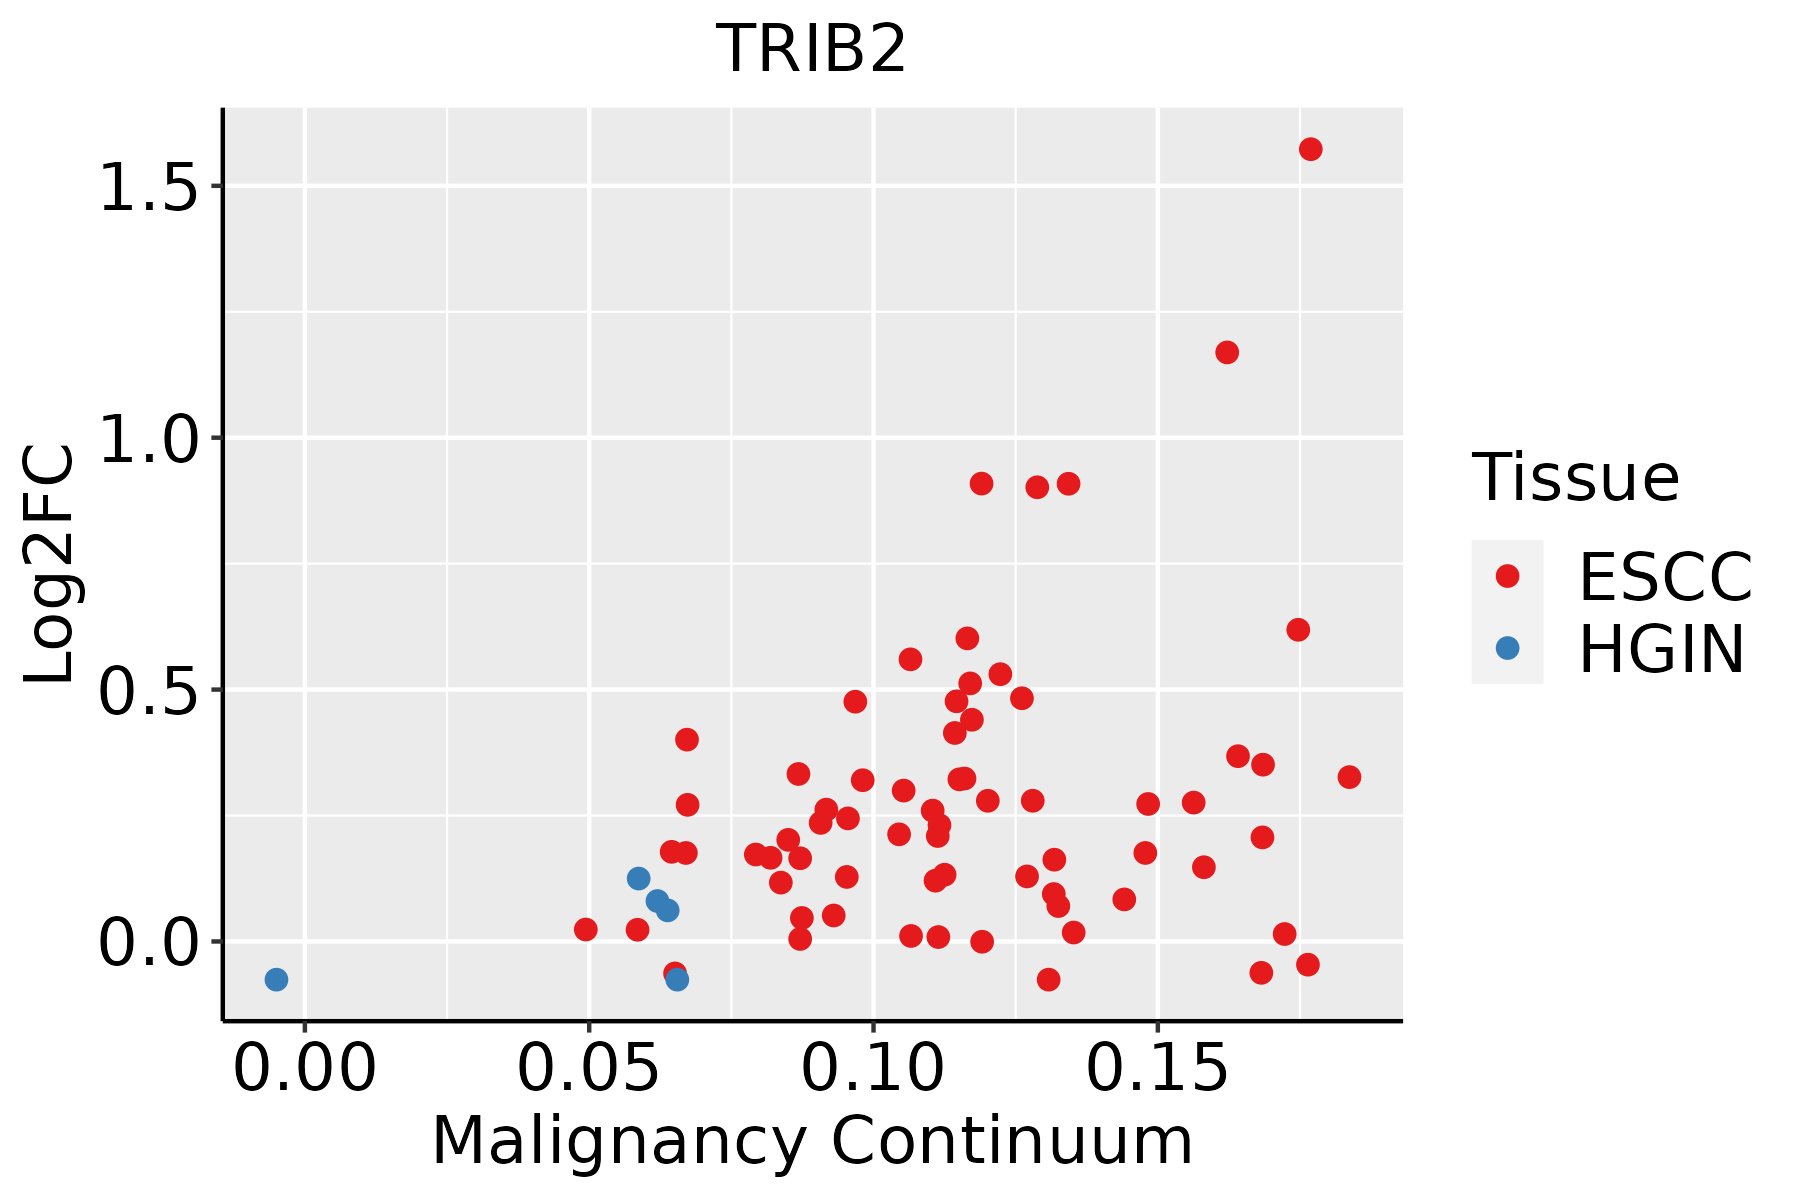 | ESCC: Esophageal squamous cell carcinoma |
| HGIN: High-grade intraepithelial neoplasias | ||
| LGIN: Low-grade intraepithelial neoplasias | ||
| Liver | 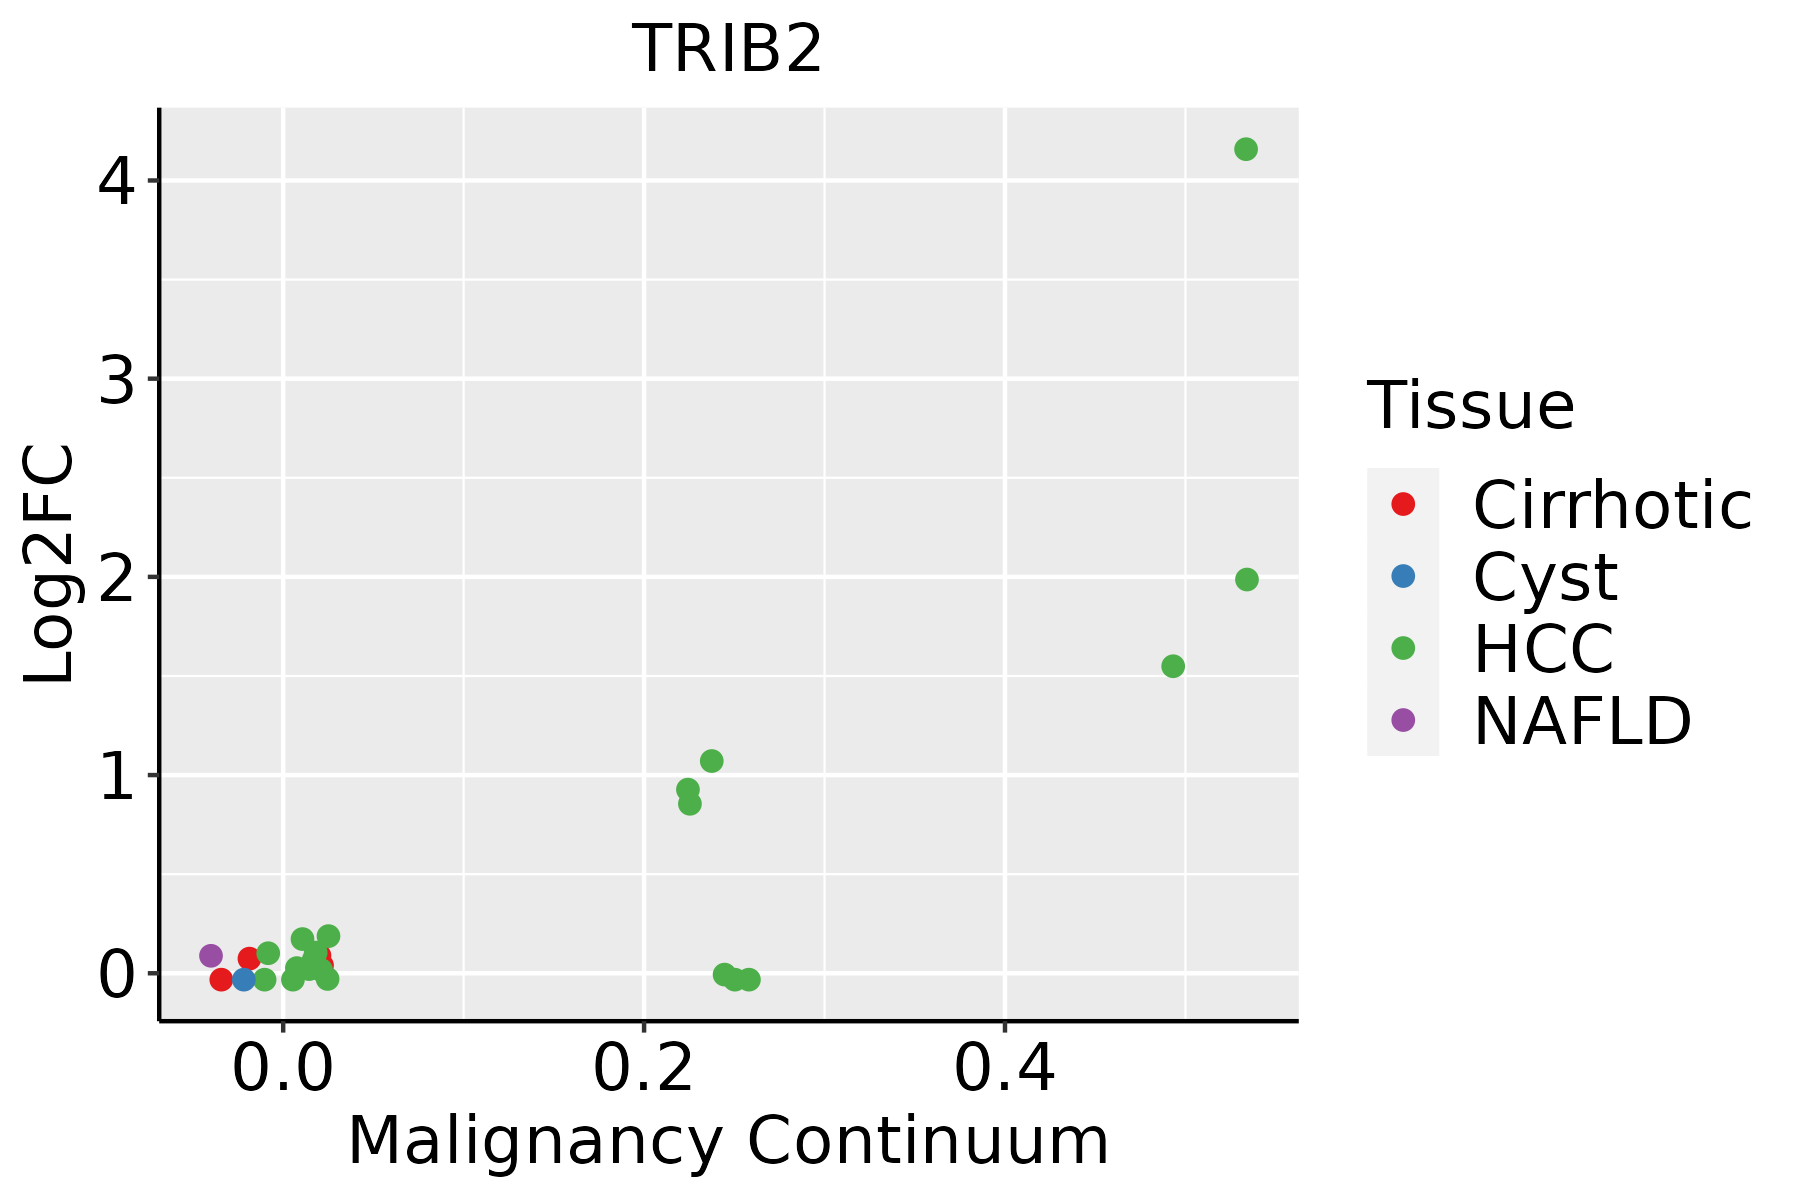 | HCC: Hepatocellular carcinoma |
| NAFLD: Non-alcoholic fatty liver disease | ||
| Oral Cavity | 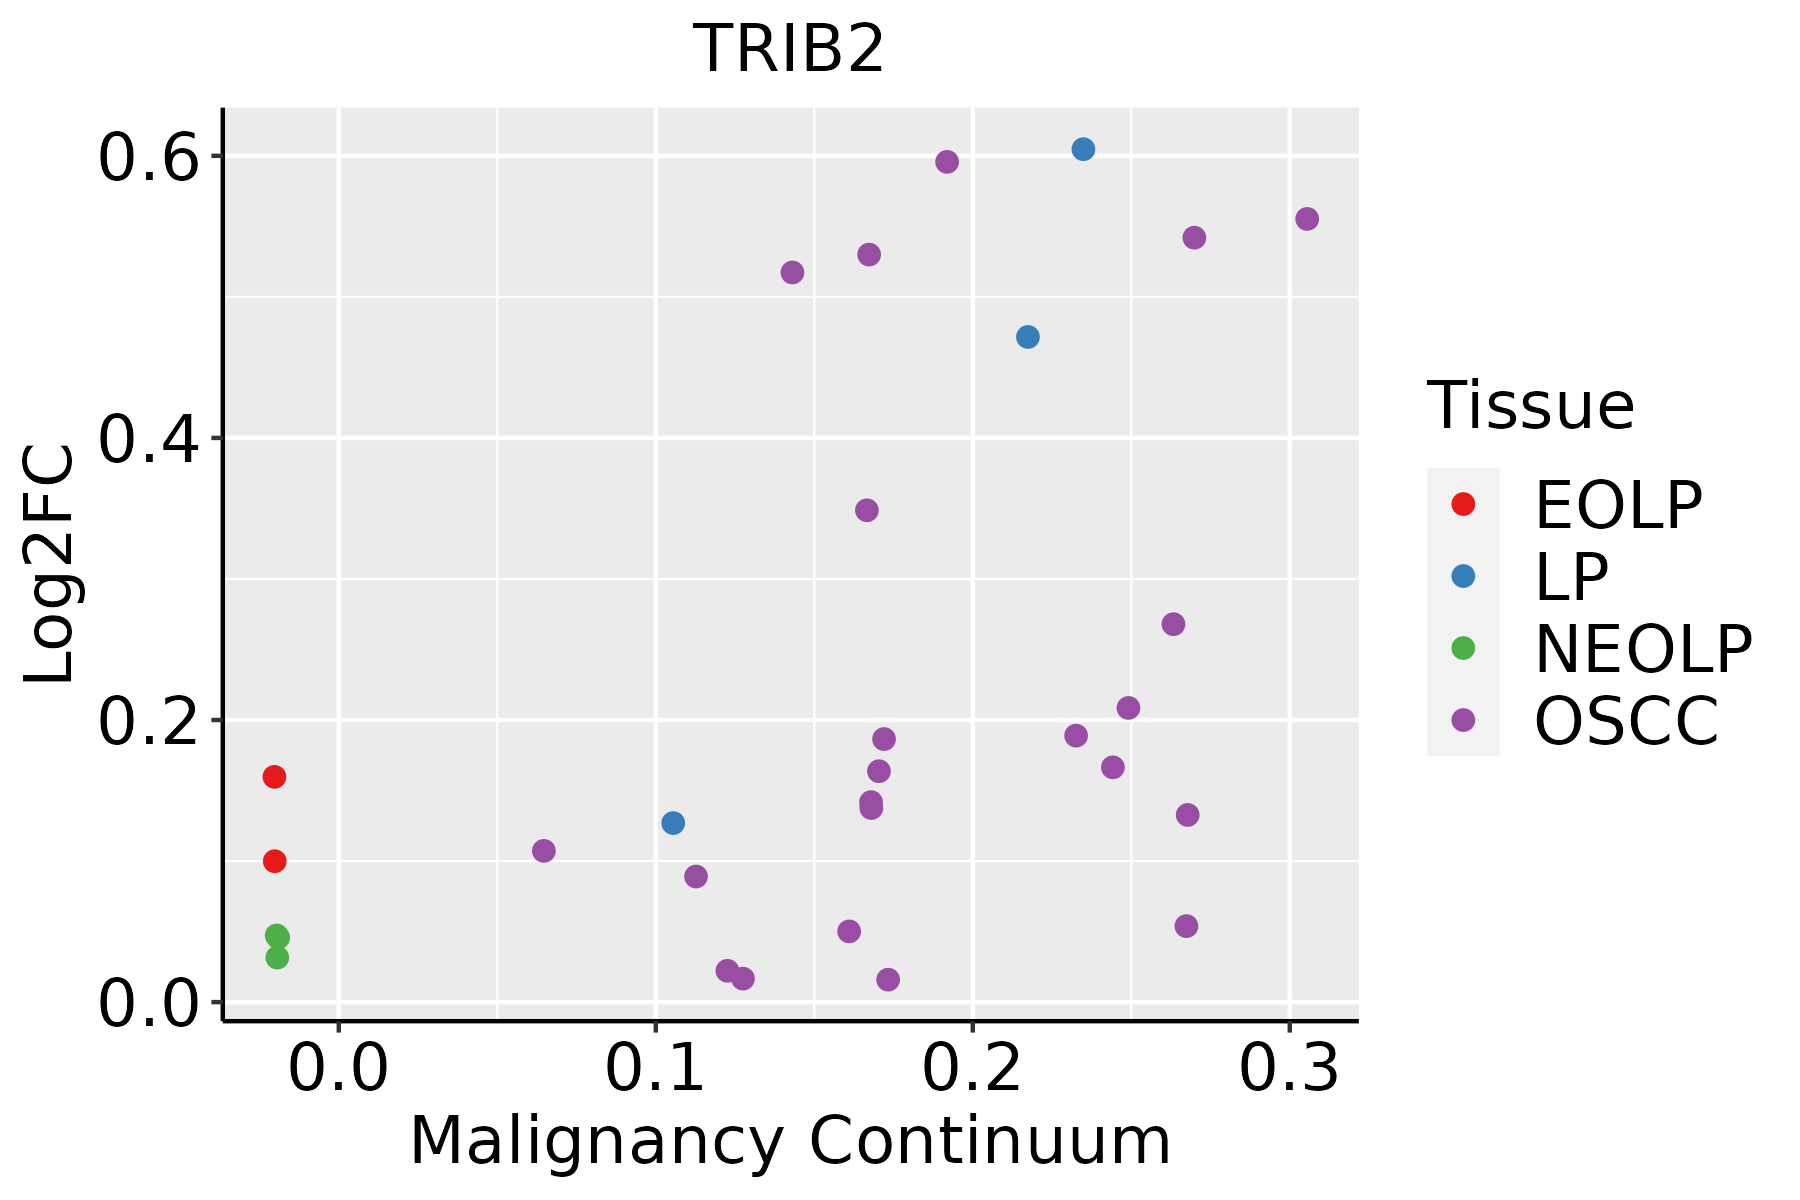 | EOLP: Erosive Oral lichen planus |
| LP: leukoplakia | ||
| NEOLP: Non-erosive oral lichen planus | ||
| OSCC: Oral squamous cell carcinoma | ||
| Prostate |  | BPH: Benign Prostatic Hyperplasia |
| Thyroid |  | ATC: Anaplastic thyroid cancer |
| HT: Hashimoto's thyroiditis | ||
| PTC: Papillary thyroid cancer |
| ∗log2FC in expression of this searched gene in stem-like cells from each diseased tissue sample relative to stem-like cells in normal samples in each tissue plotted against the malignancy continuum. Samples are colored based on if they are from different disease stage. |
Top |
Malignant transformation related pathway analysis |
| Find out the enriched GO biological processes and KEGG pathways involved in transition from healthy to precancer to cancer |
| Tissue | Disease Stage | Enriched GO biological Processes |
| Colorectum | AD |  |
| Colorectum | SER |  |
| Colorectum | MSS |  |
| Colorectum | MSI-H |  |
| Colorectum | FAP |  |
| ∗Top 15 enriched GO BP terms are showed in the bar plot of each disease state in each tissue. Each row represents a significant GO biological process which is colored according to the -log10(p.adjust). |
| Page: 1 2 3 4 5 6 7 8 9 |
| GO ID | Tissue | Disease Stage | Description | Gene Ratio | Bg Ratio | pvalue | p.adjust | Count |
| GO:0010498111 | Esophagus | ESCC | proteasomal protein catabolic process | 369/8552 | 490/18723 | 1.13e-41 | 1.80e-38 | 369 |
| GO:0043161111 | Esophagus | ESCC | proteasome-mediated ubiquitin-dependent protein catabolic process | 312/8552 | 412/18723 | 3.53e-36 | 4.48e-33 | 312 |
| GO:0042176111 | Esophagus | ESCC | regulation of protein catabolic process | 280/8552 | 391/18723 | 8.65e-26 | 2.39e-23 | 280 |
| GO:0009896111 | Esophagus | ESCC | positive regulation of catabolic process | 332/8552 | 492/18723 | 4.36e-23 | 9.22e-21 | 332 |
| GO:0031331111 | Esophagus | ESCC | positive regulation of cellular catabolic process | 292/8552 | 427/18723 | 8.67e-22 | 1.53e-19 | 292 |
| GO:1903362111 | Esophagus | ESCC | regulation of cellular protein catabolic process | 188/8552 | 255/18723 | 5.12e-20 | 6.62e-18 | 188 |
| GO:0045862111 | Esophagus | ESCC | positive regulation of proteolysis | 256/8552 | 372/18723 | 7.88e-20 | 9.43e-18 | 256 |
| GO:1903050111 | Esophagus | ESCC | regulation of proteolysis involved in cellular protein catabolic process | 163/8552 | 221/18723 | 1.44e-17 | 1.27e-15 | 163 |
| GO:0061136111 | Esophagus | ESCC | regulation of proteasomal protein catabolic process | 142/8552 | 187/18723 | 2.40e-17 | 2.00e-15 | 142 |
| GO:0045732111 | Esophagus | ESCC | positive regulation of protein catabolic process | 167/8552 | 231/18723 | 1.47e-16 | 1.14e-14 | 167 |
| GO:0032434111 | Esophagus | ESCC | regulation of proteasomal ubiquitin-dependent protein catabolic process | 107/8552 | 134/18723 | 4.06e-16 | 2.93e-14 | 107 |
| GO:2000058111 | Esophagus | ESCC | regulation of ubiquitin-dependent protein catabolic process | 125/8552 | 164/18723 | 1.17e-15 | 7.76e-14 | 125 |
| GO:1903364111 | Esophagus | ESCC | positive regulation of cellular protein catabolic process | 117/8552 | 155/18723 | 3.25e-14 | 1.66e-12 | 117 |
| GO:1901800110 | Esophagus | ESCC | positive regulation of proteasomal protein catabolic process | 91/8552 | 114/18723 | 6.74e-14 | 3.34e-12 | 91 |
| GO:1903052110 | Esophagus | ESCC | positive regulation of proteolysis involved in cellular protein catabolic process | 101/8552 | 133/18723 | 9.58e-13 | 4.19e-11 | 101 |
| GO:0010563111 | Esophagus | ESCC | negative regulation of phosphorus metabolic process | 274/8552 | 442/18723 | 2.32e-12 | 9.41e-11 | 274 |
| GO:0045936111 | Esophagus | ESCC | negative regulation of phosphate metabolic process | 273/8552 | 441/18723 | 3.18e-12 | 1.25e-10 | 273 |
| GO:0051348111 | Esophagus | ESCC | negative regulation of transferase activity | 177/8552 | 268/18723 | 1.08e-11 | 4.00e-10 | 177 |
| GO:007190016 | Esophagus | ESCC | regulation of protein serine/threonine kinase activity | 227/8552 | 359/18723 | 1.12e-11 | 4.10e-10 | 227 |
| GO:0032436111 | Esophagus | ESCC | positive regulation of proteasomal ubiquitin-dependent protein catabolic process | 72/8552 | 90/18723 | 2.30e-11 | 7.87e-10 | 72 |
| Page: 1 2 3 4 5 6 7 8 9 10 11 |
| Pathway ID | Tissue | Disease Stage | Description | Gene Ratio | Bg Ratio | pvalue | p.adjust | qvalue | Count |
| Page: 1 |
Top |
Cell-cell communication analysis |
| Identification of potential cell-cell interactions between two cell types and their ligand-receptor pairs for different disease states |
| Ligand | Receptor | LRpair | Pathway | Tissue | Disease Stage |
| Page: 1 |
Top |
Single-cell gene regulatory network inference analysis |
| Find out the significant the regulons (TFs) and the target genes of each regulon across cell types for different disease states |
| TF | Cell Type | Tissue | Disease Stage | Target Gene | RSS | Regulon Activity |
| ∗The dot plots of a searched regulon are shown for all cell subpopulations in each disease state of each tissue based on the regulon specific score inferred using pySCENIC and by calculating the average expression. |
| Page: 1 |
Top |
Somatic mutation of malignant transformation related genes |
| Annotation of somatic variants for genes involved in malignant transformation |
| Hugo Symbol | Variant Class | Variant Classification | dbSNP RS | HGVSc | HGVSp | HGVSp Short | SWISSPROT | BIOTYPE | SIFT | PolyPhen | Tumor Sample Barcode | Tissue | Histology | Sex | Age | Stage | Therapy Types | Drugs | Outcome |
| TRIB2 | SNV | Missense_Mutation | c.749G>A | p.Gly250Glu | p.G250E | Q92519 | protein_coding | deleterious(0) | probably_damaging(1) | TCGA-A2-A1G1-01 | Breast | breast invasive carcinoma | Female | >=65 | I/II | Unknown | Unknown | SD | |
| TRIB2 | SNV | Missense_Mutation | c.448N>A | p.Glu150Lys | p.E150K | Q92519 | protein_coding | tolerated(0.1) | possibly_damaging(0.622) | TCGA-A8-A076-01 | Breast | breast invasive carcinoma | Female | >=65 | I/II | Hormone Therapy | anastrozole | SD | |
| TRIB2 | SNV | Missense_Mutation | rs577789476 | c.857N>A | p.Arg286Gln | p.R286Q | Q92519 | protein_coding | tolerated(0.16) | benign(0.158) | TCGA-AN-A046-01 | Breast | breast invasive carcinoma | Female | >=65 | I/II | Unknown | Unknown | SD |
| TRIB2 | SNV | Missense_Mutation | novel | c.950N>T | p.Ser317Leu | p.S317L | Q92519 | protein_coding | tolerated(0.3) | benign(0.007) | TCGA-BH-A0HF-01 | Breast | breast invasive carcinoma | Female | >=65 | I/II | Hormone Therapy | arimidex | SD |
| TRIB2 | SNV | Missense_Mutation | novel | c.536N>A | p.Arg179Gln | p.R179Q | Q92519 | protein_coding | deleterious(0) | probably_damaging(1) | TCGA-EW-A1IZ-01 | Breast | breast invasive carcinoma | Female | <65 | III/IV | Chemotherapy | taxotere | SD |
| TRIB2 | SNV | Missense_Mutation | c.535C>T | p.Arg179Trp | p.R179W | Q92519 | protein_coding | deleterious(0) | probably_damaging(1) | TCGA-2W-A8YY-01 | Cervix | cervical & endocervical cancer | Female | <65 | I/II | Chemotherapy | cisplatin | CR | |
| TRIB2 | SNV | Missense_Mutation | novel | c.782N>T | p.Ser261Phe | p.S261F | Q92519 | protein_coding | deleterious(0.02) | possibly_damaging(0.848) | TCGA-JW-A5VL-01 | Cervix | cervical & endocervical cancer | Female | <65 | I/II | Unknown | Unknown | SD |
| TRIB2 | SNV | Missense_Mutation | rs376273712 | c.940N>A | p.Val314Ile | p.V314I | Q92519 | protein_coding | tolerated(0.33) | benign(0) | TCGA-A6-5661-01 | Colorectum | colon adenocarcinoma | Female | >=65 | I/II | Unknown | Unknown | SD |
| TRIB2 | SNV | Missense_Mutation | c.535N>T | p.Arg179Trp | p.R179W | Q92519 | protein_coding | deleterious(0) | probably_damaging(1) | TCGA-A6-6651-01 | Colorectum | colon adenocarcinoma | Female | <65 | III/IV | Ancillary | leucovorin | SD | |
| TRIB2 | SNV | Missense_Mutation | c.631N>A | p.Asp211Asn | p.D211N | Q92519 | protein_coding | deleterious(0) | probably_damaging(1) | TCGA-AA-3662-01 | Colorectum | colon adenocarcinoma | Female | >=65 | III/IV | Chemotherapy | capecitabine | PR |
| Page: 1 2 3 4 5 6 |
Top |
Related drugs of malignant transformation related genes |
| Identification of chemicals and drugs interact with genes involved in malignant transfromation |
| (DGIdb 4.0) |
| Entrez ID | Symbol | Category | Interaction Types | Drug Claim Name | Drug Name | PMIDs |
| 28951 | TRIB2 | KINASE, TRANSCRIPTION FACTOR, DRUGGABLE GENOME, SERINE THREONINE KINASE, ENZYME | allopurinol | ALLOPURINOL | 30924126 |
| Page: 1 |

Copyright 2023-Present -The University of Texas Health Science Center at Houston |