
|
|||||
|
 | |
| |
| |
| |
| |
| |
|
Gene: TNFSF9 |
Gene summary for TNFSF9 |
| Gene information | Species | Human | Gene symbol | TNFSF9 | Gene ID | 8744 |
| Gene name | TNF superfamily member 9 | |
| Gene Alias | 4-1BB-L | |
| Cytomap | 19p13.3 | |
| Gene Type | protein-coding | GO ID | GO:0001775 | UniProtAcc | A0A0U5J8I0 |
Top |
Malignant transformation analysis |
| Identification of the aberrant gene expression in precancerous and cancerous lesions by comparing the gene expression of stem-like cells in diseased tissues with normal stem cells |
| Entrez ID | Symbol | Replicates | Species | Organ | Tissue | Adj P-value | Log2FC | Malignancy |
| 8744 | TNFSF9 | P32T-E | Human | Esophagus | ESCC | 3.97e-04 | 1.10e-01 | 0.1666 |
| 8744 | TNFSF9 | P36T-E | Human | Esophagus | ESCC | 3.14e-02 | 1.31e-01 | 0.1187 |
| 8744 | TNFSF9 | P37T-E | Human | Esophagus | ESCC | 1.47e-09 | 3.39e-01 | 0.1371 |
| 8744 | TNFSF9 | P39T-E | Human | Esophagus | ESCC | 3.75e-03 | 1.24e-01 | 0.0894 |
| 8744 | TNFSF9 | P42T-E | Human | Esophagus | ESCC | 3.40e-15 | 4.80e-01 | 0.1175 |
| 8744 | TNFSF9 | P47T-E | Human | Esophagus | ESCC | 8.40e-04 | 1.19e-01 | 0.1067 |
| 8744 | TNFSF9 | P48T-E | Human | Esophagus | ESCC | 1.47e-14 | 3.10e-01 | 0.0959 |
| 8744 | TNFSF9 | P49T-E | Human | Esophagus | ESCC | 3.25e-03 | 4.74e-01 | 0.1768 |
| 8744 | TNFSF9 | P52T-E | Human | Esophagus | ESCC | 1.28e-23 | 6.20e-01 | 0.1555 |
| 8744 | TNFSF9 | P54T-E | Human | Esophagus | ESCC | 1.49e-28 | 8.97e-01 | 0.0975 |
| 8744 | TNFSF9 | P57T-E | Human | Esophagus | ESCC | 1.08e-04 | 1.54e-01 | 0.0926 |
| 8744 | TNFSF9 | P61T-E | Human | Esophagus | ESCC | 1.70e-21 | 9.63e-01 | 0.099 |
| 8744 | TNFSF9 | P62T-E | Human | Esophagus | ESCC | 2.07e-32 | 7.25e-01 | 0.1302 |
| 8744 | TNFSF9 | P65T-E | Human | Esophagus | ESCC | 1.92e-02 | 9.81e-02 | 0.0978 |
| 8744 | TNFSF9 | P74T-E | Human | Esophagus | ESCC | 7.64e-05 | 1.53e-01 | 0.1479 |
| 8744 | TNFSF9 | P75T-E | Human | Esophagus | ESCC | 1.16e-15 | 3.45e-01 | 0.1125 |
| 8744 | TNFSF9 | P80T-E | Human | Esophagus | ESCC | 5.87e-08 | 2.44e-01 | 0.155 |
| 8744 | TNFSF9 | P83T-E | Human | Esophagus | ESCC | 1.11e-07 | 2.07e-01 | 0.1738 |
| 8744 | TNFSF9 | P107T-E | Human | Esophagus | ESCC | 4.74e-06 | 2.45e-01 | 0.171 |
| 8744 | TNFSF9 | P126T-E | Human | Esophagus | ESCC | 1.42e-02 | 7.35e-01 | 0.1125 |
| Page: 1 2 3 |
| Tissue | Expression Dynamics | Abbreviation |
| Esophagus | 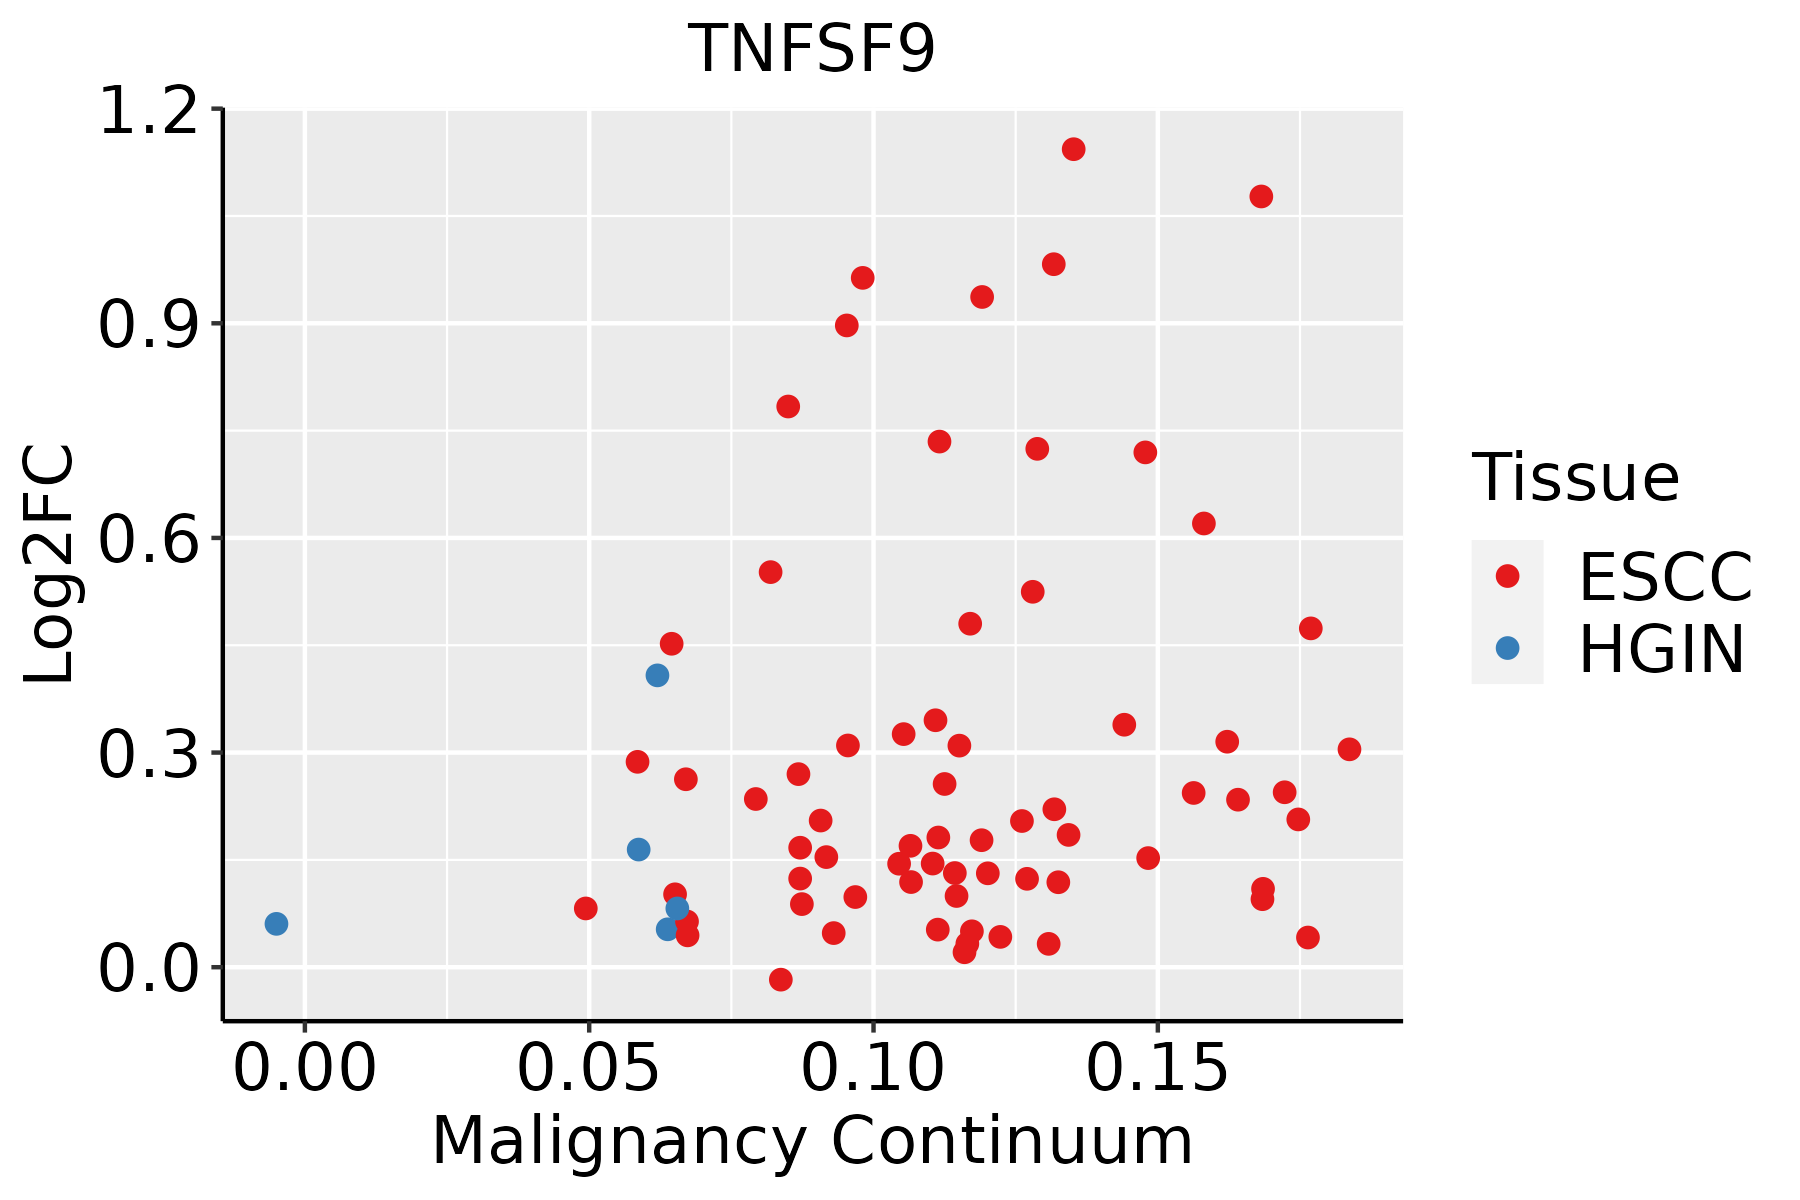 | ESCC: Esophageal squamous cell carcinoma |
| HGIN: High-grade intraepithelial neoplasias | ||
| LGIN: Low-grade intraepithelial neoplasias | ||
| Oral Cavity |  | EOLP: Erosive Oral lichen planus |
| LP: leukoplakia | ||
| NEOLP: Non-erosive oral lichen planus | ||
| OSCC: Oral squamous cell carcinoma | ||
| Thyroid | 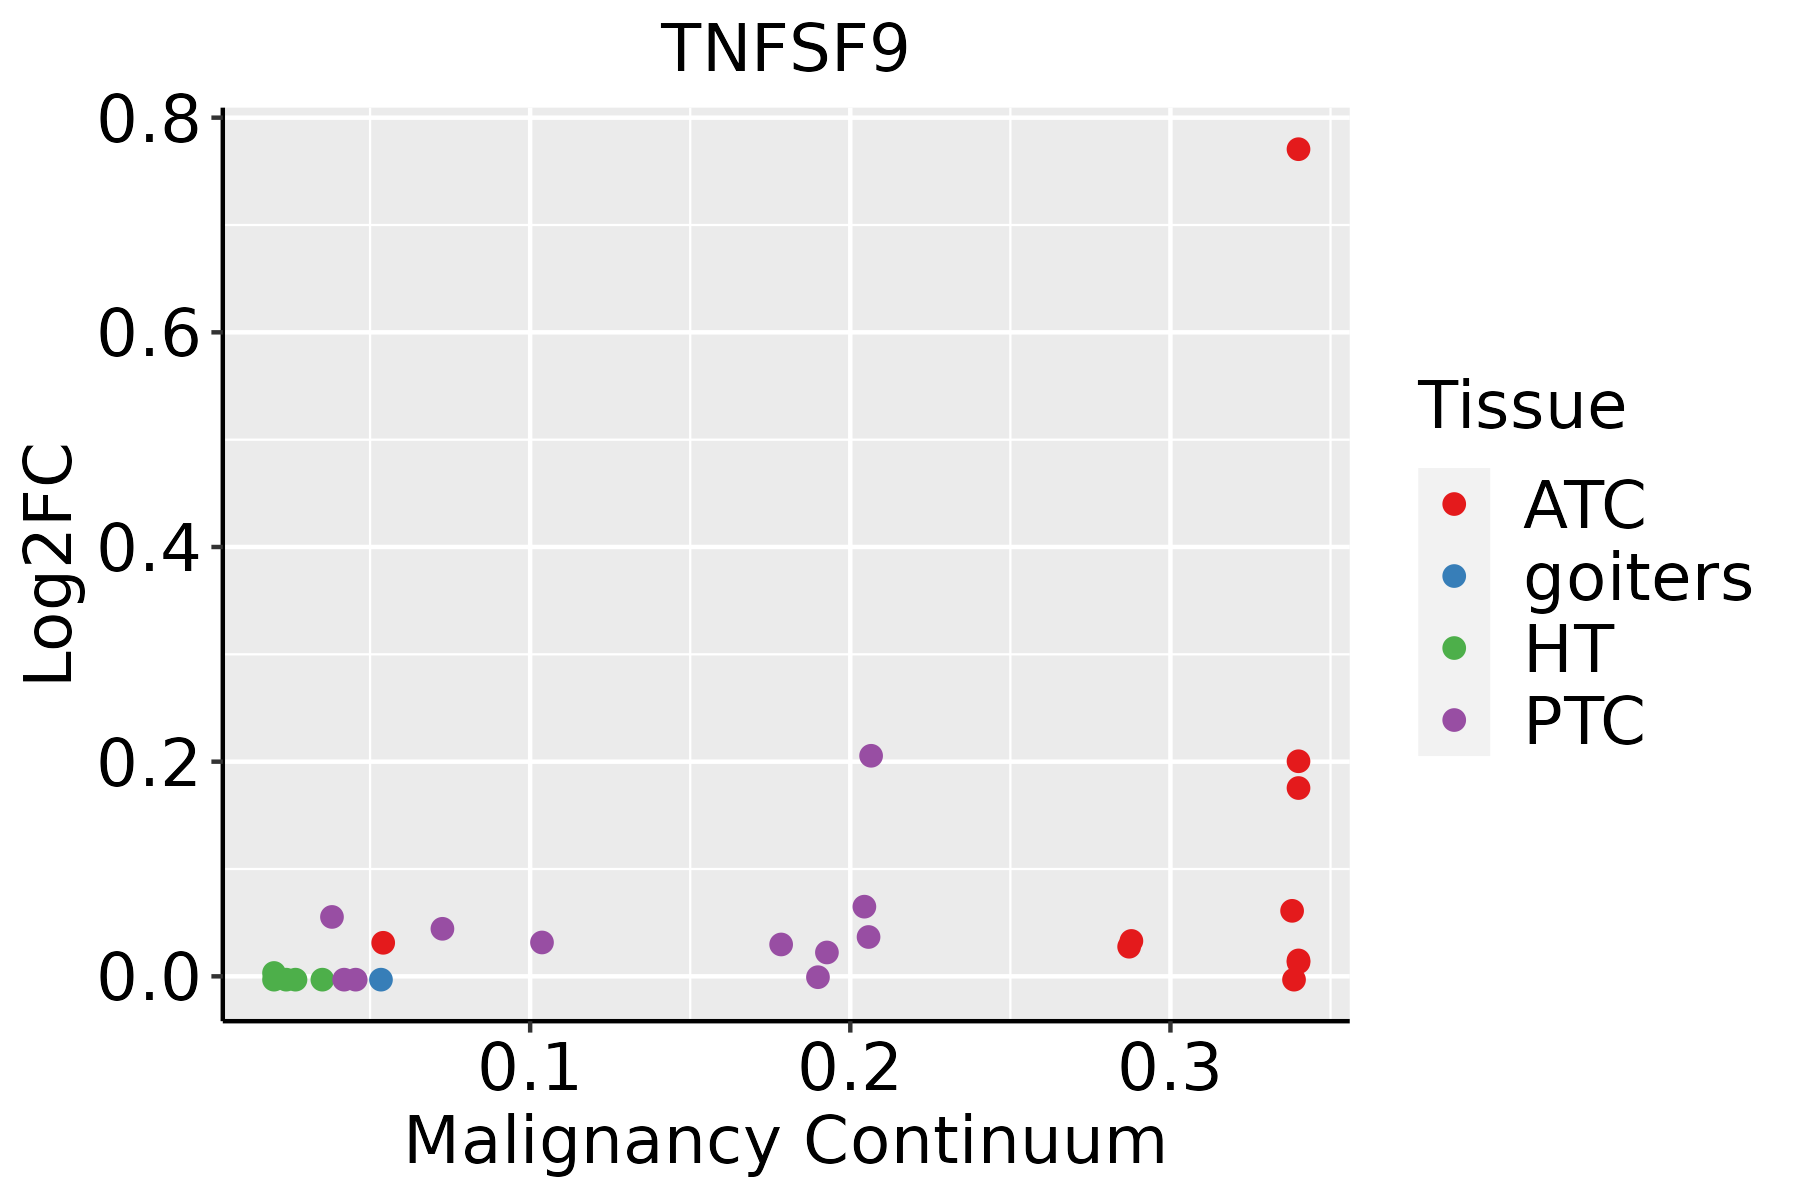 | ATC: Anaplastic thyroid cancer |
| HT: Hashimoto's thyroiditis | ||
| PTC: Papillary thyroid cancer |
| ∗log2FC in expression of this searched gene in stem-like cells from each diseased tissue sample relative to stem-like cells in normal samples in each tissue plotted against the malignancy continuum. Samples are colored based on if they are from different disease stage. |
Top |
Malignant transformation related pathway analysis |
| Find out the enriched GO biological processes and KEGG pathways involved in transition from healthy to precancer to cancer |
| Tissue | Disease Stage | Enriched GO biological Processes |
| Colorectum | AD |  |
| Colorectum | SER |  |
| Colorectum | MSS |  |
| Colorectum | MSI-H |  |
| Colorectum | FAP |  |
| ∗Top 15 enriched GO BP terms are showed in the bar plot of each disease state in each tissue. Each row represents a significant GO biological process which is colored according to the -log10(p.adjust). |
| Page: 1 2 3 4 5 6 7 8 9 |
| GO ID | Tissue | Disease Stage | Description | Gene Ratio | Bg Ratio | pvalue | p.adjust | Count |
| GO:190370620 | Esophagus | HGIN | regulation of hemopoiesis | 69/2587 | 367/18723 | 4.39e-03 | 3.86e-02 | 69 |
| GO:004578527 | Esophagus | ESCC | positive regulation of cell adhesion | 255/8552 | 437/18723 | 5.07e-08 | 9.11e-07 | 255 |
| GO:1903706110 | Esophagus | ESCC | regulation of hemopoiesis | 201/8552 | 367/18723 | 2.60e-04 | 1.58e-03 | 201 |
| GO:19021076 | Esophagus | ESCC | positive regulation of leukocyte differentiation | 93/8552 | 157/18723 | 4.20e-04 | 2.39e-03 | 93 |
| GO:19037086 | Esophagus | ESCC | positive regulation of hemopoiesis | 93/8552 | 157/18723 | 4.20e-04 | 2.39e-03 | 93 |
| GO:002240720 | Esophagus | ESCC | regulation of cell-cell adhesion | 239/8552 | 448/18723 | 5.88e-04 | 3.19e-03 | 239 |
| GO:004211018 | Esophagus | ESCC | T cell activation | 256/8552 | 487/18723 | 1.18e-03 | 5.87e-03 | 256 |
| GO:19031317 | Esophagus | ESCC | mononuclear cell differentiation | 226/8552 | 426/18723 | 1.20e-03 | 5.88e-03 | 226 |
| GO:002240919 | Esophagus | ESCC | positive regulation of cell-cell adhesion | 155/8552 | 284/18723 | 1.50e-03 | 7.06e-03 | 155 |
| GO:190210510 | Esophagus | ESCC | regulation of leukocyte differentiation | 152/8552 | 279/18723 | 1.82e-03 | 8.35e-03 | 152 |
| GO:00456213 | Esophagus | ESCC | positive regulation of lymphocyte differentiation | 61/8552 | 104/18723 | 5.22e-03 | 1.97e-02 | 61 |
| GO:005087015 | Esophagus | ESCC | positive regulation of T cell activation | 117/8552 | 216/18723 | 7.23e-03 | 2.62e-02 | 117 |
| GO:00302176 | Esophagus | ESCC | T cell differentiation | 137/8552 | 257/18723 | 8.09e-03 | 2.87e-02 | 137 |
| GO:190303916 | Esophagus | ESCC | positive regulation of leukocyte cell-cell adhesion | 128/8552 | 239/18723 | 8.40e-03 | 2.96e-02 | 128 |
| GO:000715918 | Esophagus | ESCC | leukocyte cell-cell adhesion | 192/8552 | 371/18723 | 1.03e-02 | 3.51e-02 | 192 |
| GO:190303717 | Esophagus | ESCC | regulation of leukocyte cell-cell adhesion | 174/8552 | 336/18723 | 1.36e-02 | 4.43e-02 | 174 |
| GO:00300984 | Esophagus | ESCC | lymphocyte differentiation | 192/8552 | 374/18723 | 1.52e-02 | 4.93e-02 | 192 |
| GO:004578520 | Oral cavity | OSCC | positive regulation of cell adhesion | 225/7305 | 437/18723 | 6.06e-08 | 1.09e-06 | 225 |
| GO:004211016 | Oral cavity | OSCC | T cell activation | 245/7305 | 487/18723 | 2.00e-07 | 3.22e-06 | 245 |
| GO:19031316 | Oral cavity | OSCC | mononuclear cell differentiation | 210/7305 | 426/18723 | 8.44e-06 | 9.02e-05 | 210 |
| Page: 1 2 3 |
| Pathway ID | Tissue | Disease Stage | Description | Gene Ratio | Bg Ratio | pvalue | p.adjust | qvalue | Count |
| Page: 1 |
Top |
Cell-cell communication analysis |
| Identification of potential cell-cell interactions between two cell types and their ligand-receptor pairs for different disease states |
| Ligand | Receptor | LRpair | Pathway | Tissue | Disease Stage |
| TNFSF9 | TNFRSF9 | TNFSF9_TNFRSF9 | CD137 | Breast | DCIS |
| TNFSF9 | TNFRSF9 | TNFSF9_TNFRSF9 | CD137 | Breast | Healthy |
| TNFSF9 | TNFRSF9 | TNFSF9_TNFRSF9 | CD137 | Cervix | CC |
| TNFSF9 | TNFRSF9 | TNFSF9_TNFRSF9 | CD137 | Cervix | Precancer |
| TNFSF9 | TNFRSF9 | TNFSF9_TNFRSF9 | CD137 | CRC | MSI-H |
| TNFSF9 | TNFRSF9 | TNFSF9_TNFRSF9 | CD137 | Endometrium | ADJ |
| TNFSF9 | TNFRSF9 | TNFSF9_TNFRSF9 | CD137 | Endometrium | AEH |
| TNFSF9 | TNFRSF9 | TNFSF9_TNFRSF9 | CD137 | HNSCC | OSCC |
| TNFSF9 | TNFRSF9 | TNFSF9_TNFRSF9 | CD137 | HNSCC | Precancer |
| TNFSF9 | TNFRSF9 | TNFSF9_TNFRSF9 | CD137 | Prostate | BPH |
| TNFSF9 | TNFRSF9 | TNFSF9_TNFRSF9 | CD137 | Prostate | Tumor |
| TNFSF9 | TNFRSF9 | TNFSF9_TNFRSF9 | CD137 | THCA | ADJ |
| TNFSF9 | TNFRSF9 | TNFSF9_TNFRSF9 | CD137 | THCA | Cancer |
| TNFSF9 | TNFRSF9 | TNFSF9_TNFRSF9 | CD137 | THCA | PTC |
| Page: 1 |
Top |
Single-cell gene regulatory network inference analysis |
| Find out the significant the regulons (TFs) and the target genes of each regulon across cell types for different disease states |
| TF | Cell Type | Tissue | Disease Stage | Target Gene | RSS | Regulon Activity |
| ∗The dot plots of a searched regulon are shown for all cell subpopulations in each disease state of each tissue based on the regulon specific score inferred using pySCENIC and by calculating the average expression. |
| Page: 1 |
Top |
Somatic mutation of malignant transformation related genes |
| Annotation of somatic variants for genes involved in malignant transformation |
| Hugo Symbol | Variant Class | Variant Classification | dbSNP RS | HGVSc | HGVSp | HGVSp Short | SWISSPROT | BIOTYPE | SIFT | PolyPhen | Tumor Sample Barcode | Tissue | Histology | Sex | Age | Stage | Therapy Types | Drugs | Outcome |
| TNFSF9 | SNV | Missense_Mutation | novel | c.34N>A | p.Glu12Lys | p.E12K | P41273 | protein_coding | deleterious(0) | possibly_damaging(0.56) | TCGA-3C-AALI-01 | Breast | breast invasive carcinoma | Female | <65 | I/II | Unspecific | Poly E | Complete Response |
| TNFSF9 | SNV | Missense_Mutation | rs749056775 | c.278N>T | p.Ala93Val | p.A93V | P41273 | protein_coding | deleterious(0) | possibly_damaging(0.887) | TCGA-VS-A952-01 | Cervix | cervical & endocervical cancer | Female | >=65 | I/II | Unknown | Unknown | SD |
| TNFSF9 | SNV | Missense_Mutation | c.352G>A | p.Val118Met | p.V118M | P41273 | protein_coding | deleterious(0) | probably_damaging(0.976) | TCGA-A6-2679-01 | Colorectum | colon adenocarcinoma | Female | >=65 | I/II | Unknown | Unknown | SD | |
| TNFSF9 | SNV | Missense_Mutation | rs778848855 | c.727G>A | p.Glu243Lys | p.E243K | P41273 | protein_coding | tolerated(0.52) | benign(0.006) | TCGA-AA-A010-01 | Colorectum | colon adenocarcinoma | Female | <65 | I/II | Chemotherapy | folinic | CR |
| TNFSF9 | SNV | Missense_Mutation | rs750244943 | c.451C>T | p.Arg151Cys | p.R151C | P41273 | protein_coding | deleterious(0) | probably_damaging(0.995) | TCGA-D5-6537-01 | Colorectum | colon adenocarcinoma | Male | <65 | III/IV | Unknown | Unknown | PD |
| TNFSF9 | SNV | Missense_Mutation | rs77313944 | c.448C>T | p.Arg150Trp | p.R150W | P41273 | protein_coding | deleterious(0) | benign(0.353) | TCGA-G4-6314-01 | Colorectum | colon adenocarcinoma | Female | >=65 | III/IV | Ancillary | leucovorin | SD |
| TNFSF9 | SNV | Missense_Mutation | novel | c.605G>C | p.Arg202Pro | p.R202P | P41273 | protein_coding | tolerated(0.37) | benign(0.23) | TCGA-AG-3583-01 | Colorectum | rectum adenocarcinoma | Male | >=65 | III/IV | Unknown | Unknown | PD |
| TNFSF9 | deletion | Frame_Shift_Del | c.363delN | p.Gly123AlafsTer2 | p.G123Afs*2 | P41273 | protein_coding | TCGA-F4-6570-01 | Colorectum | colon adenocarcinoma | Female | >=65 | I/II | Unknown | Unknown | SD | |||
| TNFSF9 | SNV | Missense_Mutation | novel | c.395N>T | p.Glu132Val | p.E132V | P41273 | protein_coding | deleterious(0) | probably_damaging(0.983) | TCGA-AJ-A2QO-01 | Endometrium | uterine corpus endometrioid carcinoma | Female | >=65 | I/II | Unknown | Unknown | SD |
| TNFSF9 | SNV | Missense_Mutation | c.521N>A | p.Ala174Asp | p.A174D | P41273 | protein_coding | tolerated(0.12) | benign(0.003) | TCGA-AP-A059-01 | Endometrium | uterine corpus endometrioid carcinoma | Female | >=65 | I/II | Unknown | Unknown | SD |
| Page: 1 2 |
Top |
Related drugs of malignant transformation related genes |
| Identification of chemicals and drugs interact with genes involved in malignant transfromation |
| (DGIdb 4.0) |
| Entrez ID | Symbol | Category | Interaction Types | Drug Claim Name | Drug Name | PMIDs |
| Page: 1 |

Copyright 2023-Present -The University of Texas Health Science Center at Houston |