
|
|||||
|
 | |
| |
| |
| |
| |
| |
|
Gene: TMEM205 |
Gene summary for TMEM205 |
| Gene information | Species | Human | Gene symbol | TMEM205 | Gene ID | 374882 |
| Gene name | transmembrane protein 205 | |
| Gene Alias | UNQ501 | |
| Cytomap | 19p13.2 | |
| Gene Type | protein-coding | GO ID | GO:0008150 | UniProtAcc | A0A024R7D3 |
Top |
Malignant transformation analysis |
| Identification of the aberrant gene expression in precancerous and cancerous lesions by comparing the gene expression of stem-like cells in diseased tissues with normal stem cells |
| Entrez ID | Symbol | Replicates | Species | Organ | Tissue | Adj P-value | Log2FC | Malignancy |
| 374882 | TMEM205 | P1 | Human | Breast | IDC | 5.76e-21 | 1.11e-01 | 0.1527 |
| 374882 | TMEM205 | P2 | Human | Breast | IDC | 4.21e-02 | -1.07e-01 | 0.21 |
| 374882 | TMEM205 | DCIS2 | Human | Breast | DCIS | 8.56e-46 | 1.21e-01 | 0.0085 |
| 374882 | TMEM205 | CA_HPV_1 | Human | Cervix | CC | 4.26e-11 | -3.67e-01 | 0.0264 |
| 374882 | TMEM205 | HSIL_HPV_1 | Human | Cervix | HSIL_HPV | 2.43e-03 | -3.41e-01 | 0.0116 |
| 374882 | TMEM205 | CCI_1 | Human | Cervix | CC | 2.58e-06 | -5.04e-01 | 0.528 |
| 374882 | TMEM205 | CCI_2 | Human | Cervix | CC | 1.08e-05 | -5.04e-01 | 0.5249 |
| 374882 | TMEM205 | CCI_3 | Human | Cervix | CC | 8.25e-09 | -5.04e-01 | 0.516 |
| 374882 | TMEM205 | CCII_1 | Human | Cervix | CC | 1.23e-12 | -5.04e-01 | 0.3249 |
| 374882 | TMEM205 | L1 | Human | Cervix | CC | 3.77e-05 | -3.69e-01 | 0.0802 |
| 374882 | TMEM205 | T3 | Human | Cervix | CC | 1.14e-02 | -2.19e-01 | 0.1389 |
| 374882 | TMEM205 | HTA11_3410_2000001011 | Human | Colorectum | AD | 7.49e-29 | 4.97e-01 | 0.0155 |
| 374882 | TMEM205 | HTA11_2487_2000001011 | Human | Colorectum | SER | 5.63e-22 | 6.28e-01 | -0.1808 |
| 374882 | TMEM205 | HTA11_2951_2000001011 | Human | Colorectum | AD | 3.03e-06 | 3.89e-01 | 0.0216 |
| 374882 | TMEM205 | HTA11_1938_2000001011 | Human | Colorectum | AD | 2.25e-33 | 8.02e-01 | -0.0811 |
| 374882 | TMEM205 | HTA11_78_2000001011 | Human | Colorectum | AD | 2.64e-09 | 2.91e-01 | -0.1088 |
| 374882 | TMEM205 | HTA11_347_2000001011 | Human | Colorectum | AD | 1.52e-31 | 5.64e-01 | -0.1954 |
| 374882 | TMEM205 | HTA11_411_2000001011 | Human | Colorectum | SER | 2.54e-19 | 1.05e+00 | -0.2602 |
| 374882 | TMEM205 | HTA11_2112_2000001011 | Human | Colorectum | SER | 3.88e-11 | 6.83e-01 | -0.2196 |
| 374882 | TMEM205 | HTA11_3361_2000001011 | Human | Colorectum | AD | 4.29e-27 | 6.14e-01 | -0.1207 |
| Page: 1 2 3 4 5 6 7 8 9 10 11 12 |
| Tissue | Expression Dynamics | Abbreviation |
| Breast |  | IDC: Invasive ductal carcinoma |
| DCIS: Ductal carcinoma in situ | ||
| Precancer(BRCA1-mut): Precancerous lesion from BRCA1 mutation carriers | ||
| Cervix | 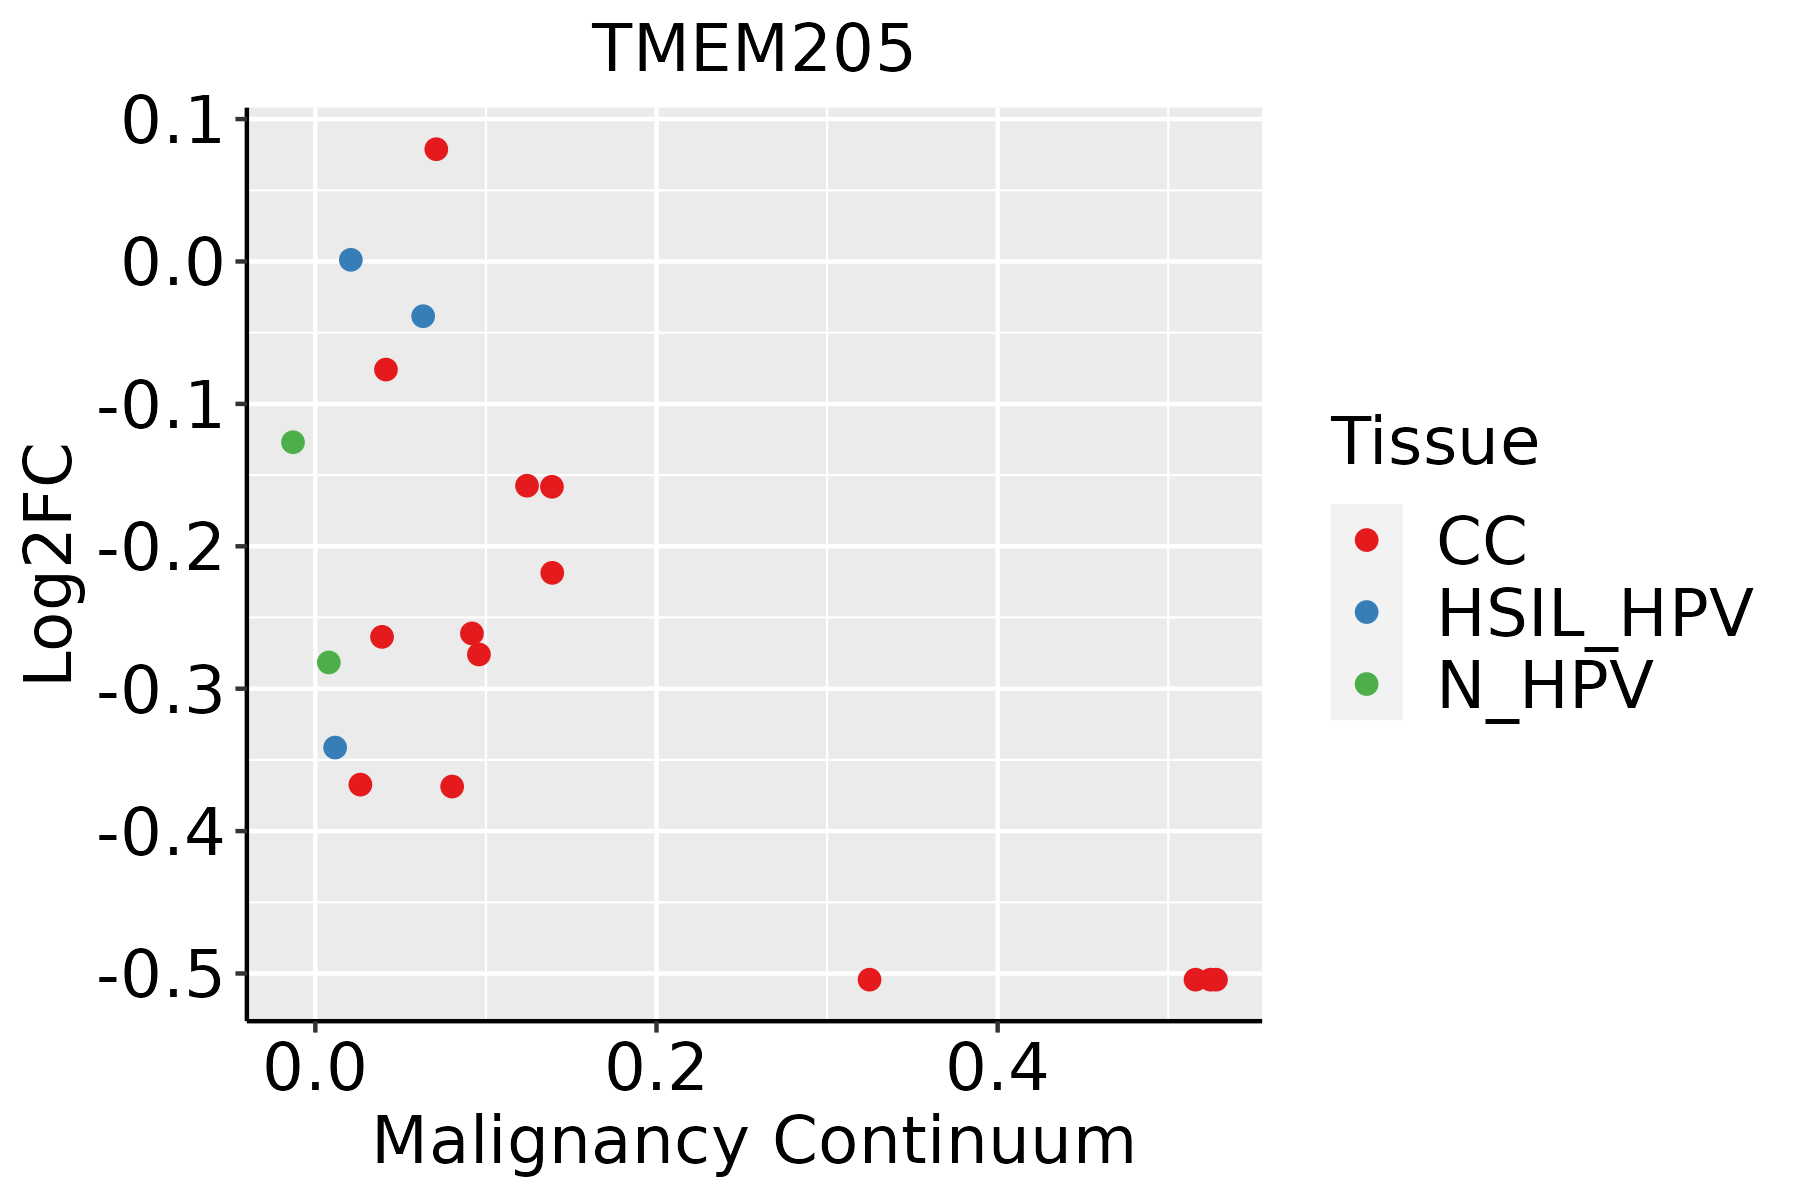 | CC: Cervix cancer |
| HSIL_HPV: HPV-infected high-grade squamous intraepithelial lesions | ||
| N_HPV: HPV-infected normal cervix | ||
| Colorectum (GSE201348) |  | FAP: Familial adenomatous polyposis |
| CRC: Colorectal cancer | ||
| Colorectum (HTA11) |  | AD: Adenomas |
| SER: Sessile serrated lesions | ||
| MSI-H: Microsatellite-high colorectal cancer | ||
| MSS: Microsatellite stable colorectal cancer | ||
| Endometrium |  | AEH: Atypical endometrial hyperplasia |
| EEC: Endometrioid Cancer | ||
| Esophagus | 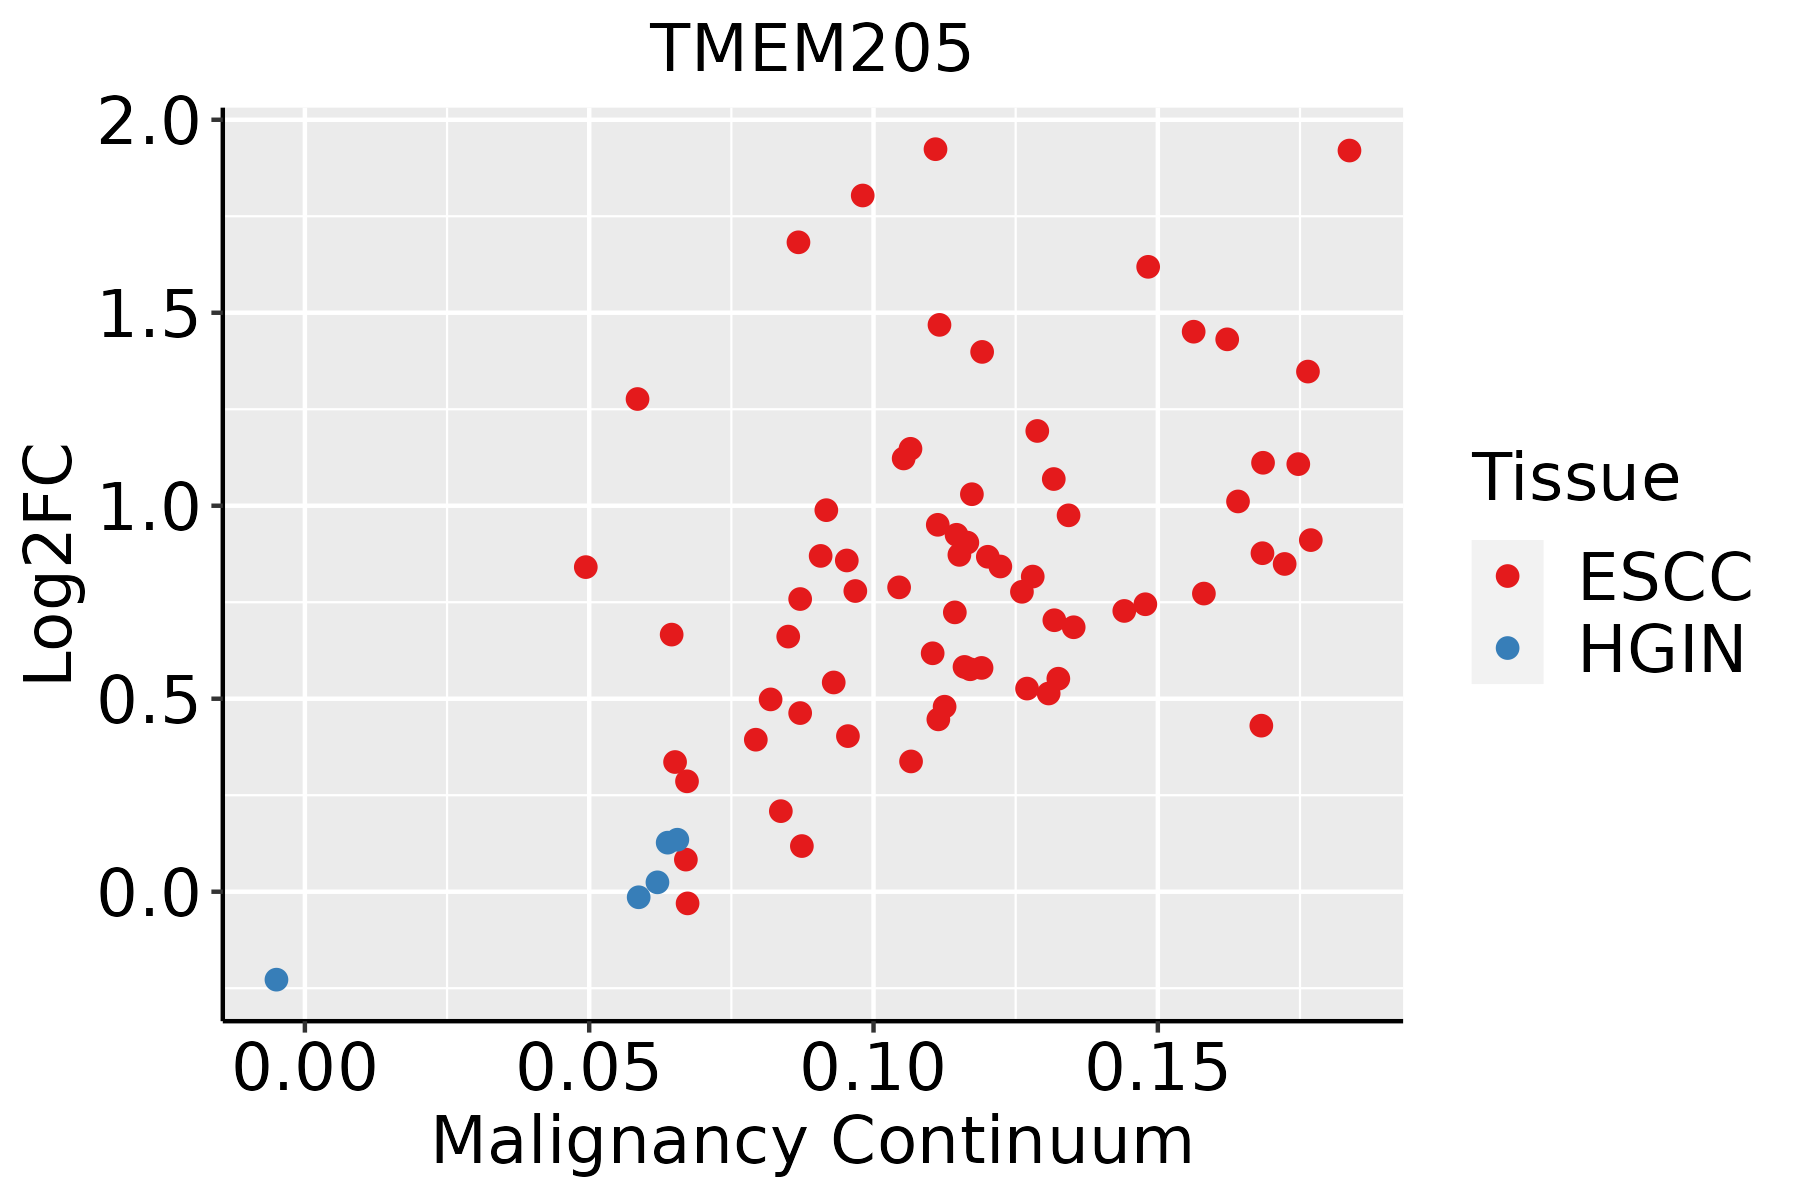 | ESCC: Esophageal squamous cell carcinoma |
| HGIN: High-grade intraepithelial neoplasias | ||
| LGIN: Low-grade intraepithelial neoplasias | ||
| Liver | 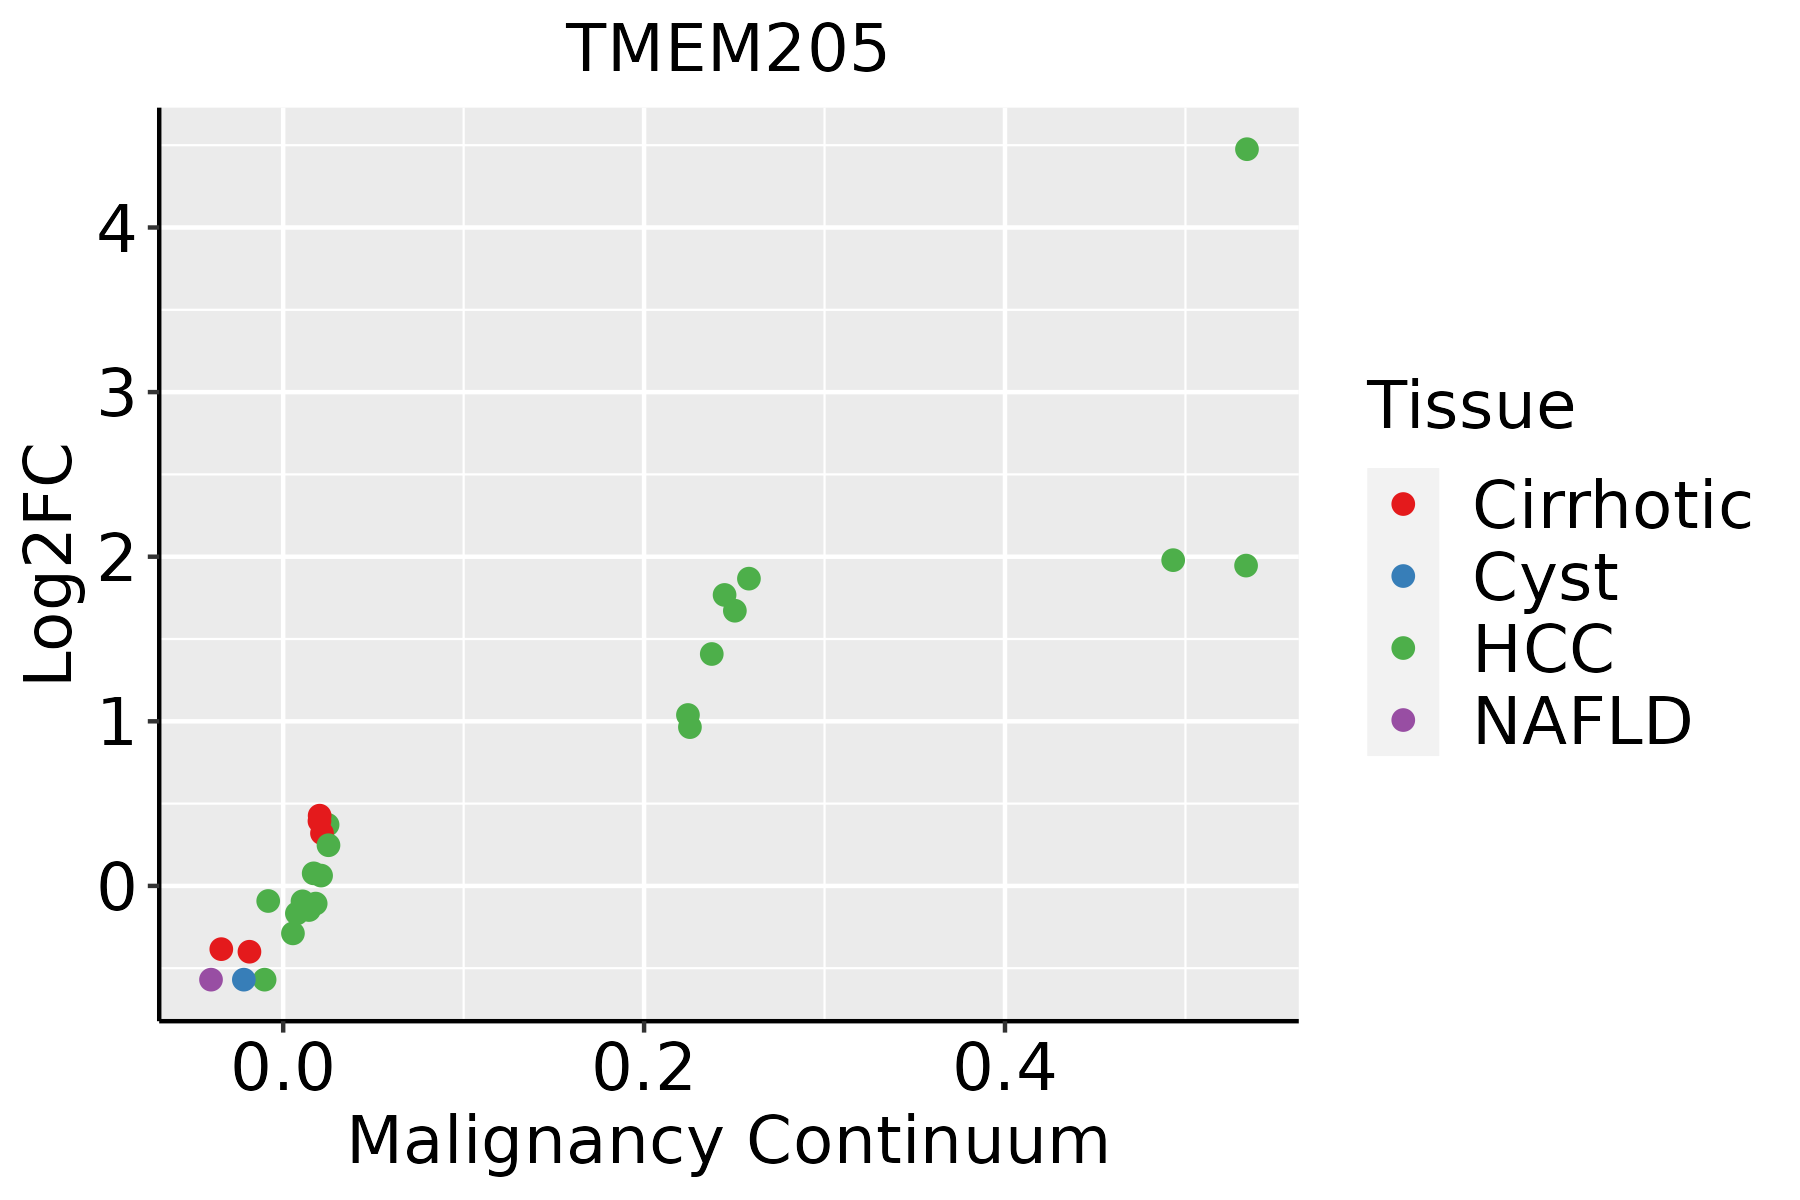 | HCC: Hepatocellular carcinoma |
| NAFLD: Non-alcoholic fatty liver disease | ||
| Oral Cavity | 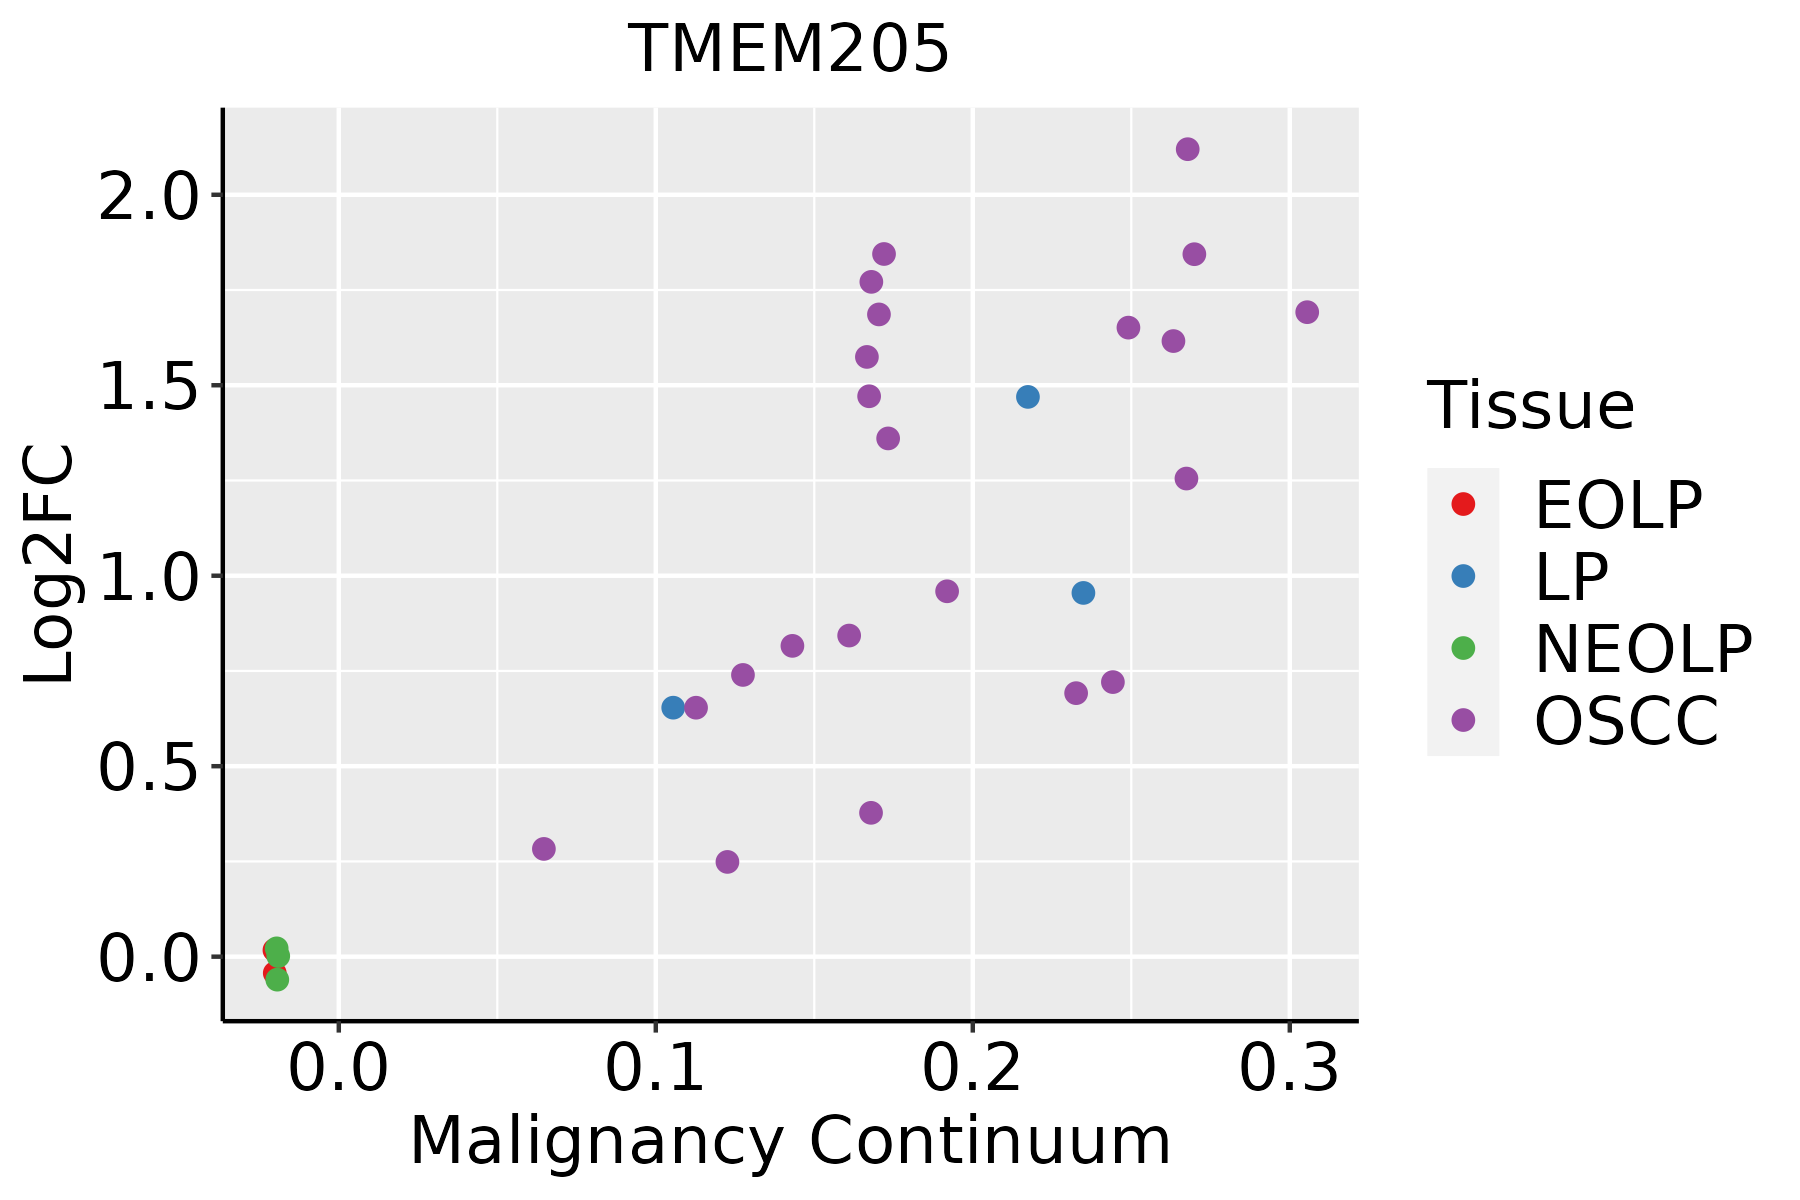 | EOLP: Erosive Oral lichen planus |
| LP: leukoplakia | ||
| NEOLP: Non-erosive oral lichen planus | ||
| OSCC: Oral squamous cell carcinoma | ||
| Prostate | 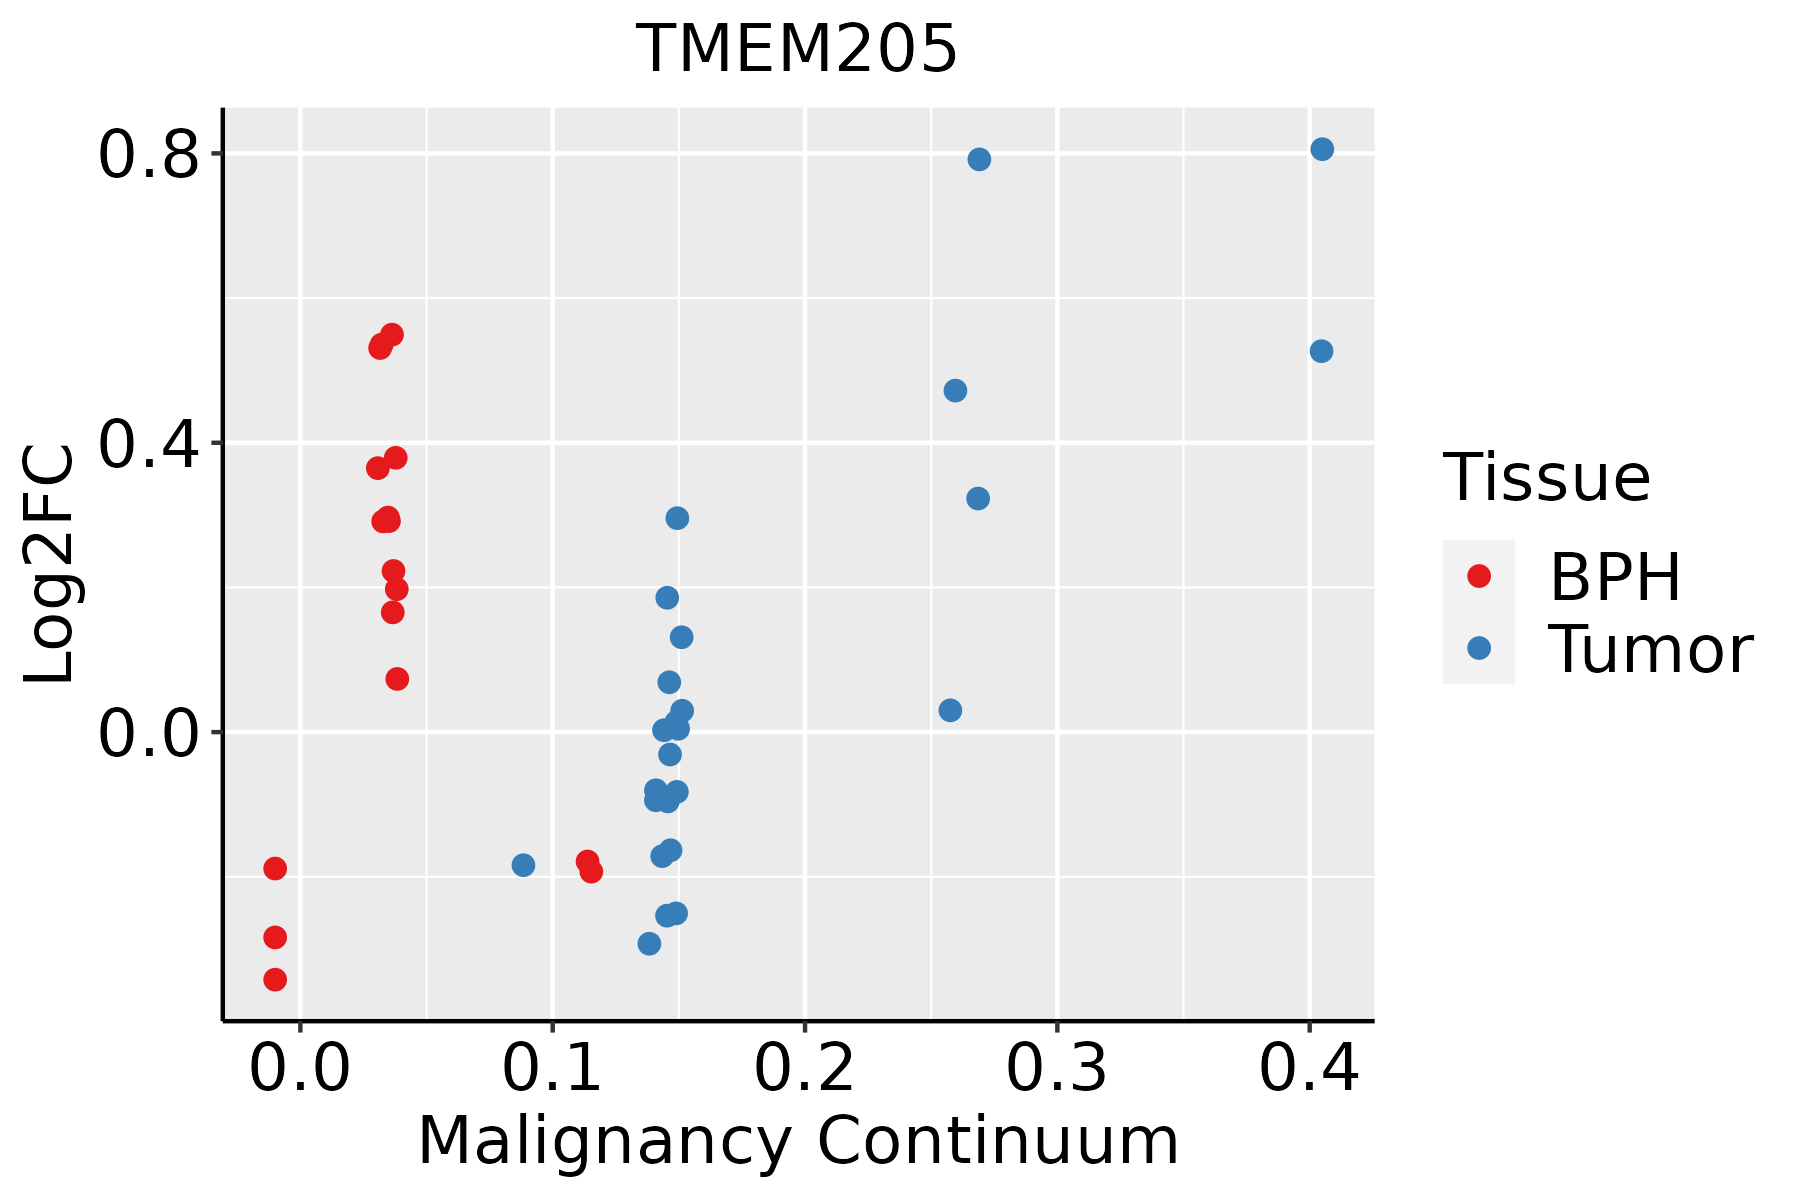 | BPH: Benign Prostatic Hyperplasia |
| Skin | 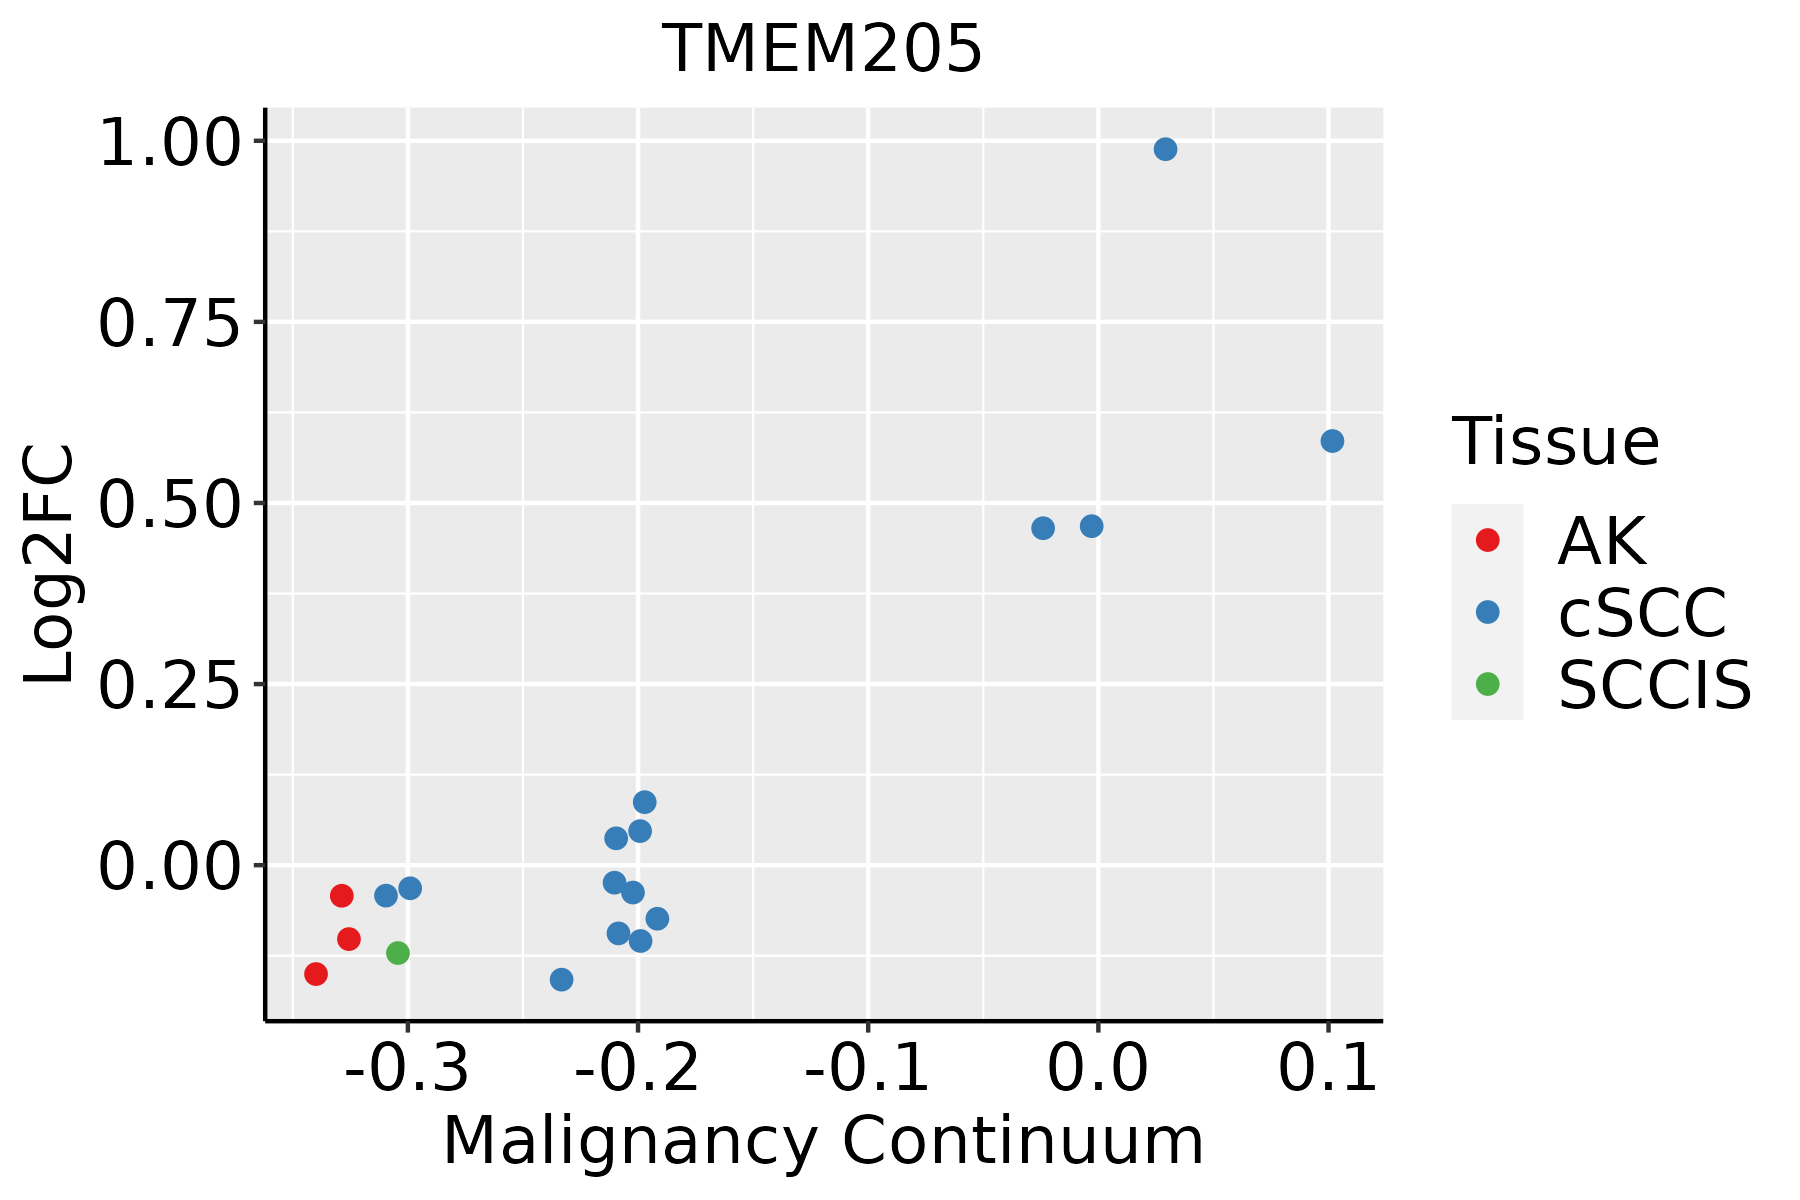 | AK: Actinic keratosis |
| cSCC: Cutaneous squamous cell carcinoma | ||
| SCCIS:squamous cell carcinoma in situ | ||
| Thyroid | 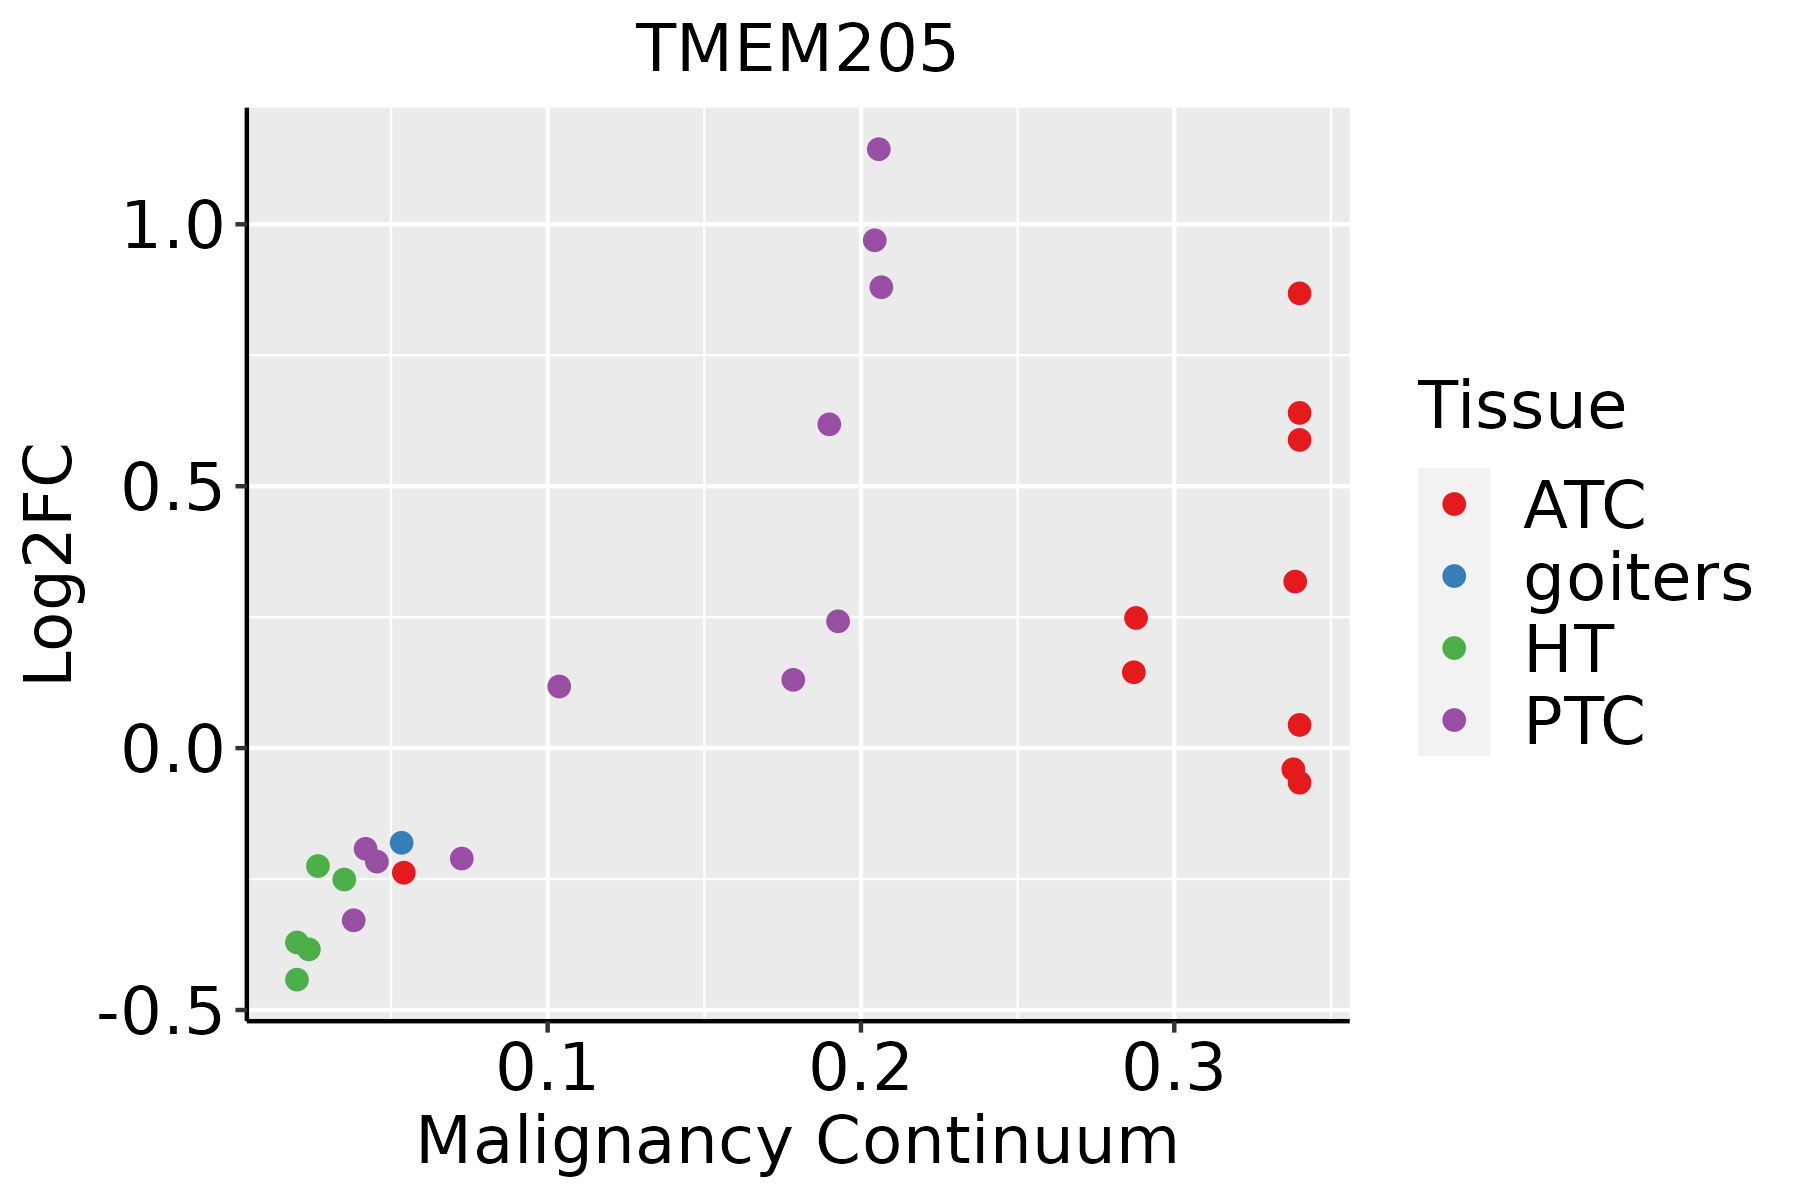 | ATC: Anaplastic thyroid cancer |
| HT: Hashimoto's thyroiditis | ||
| PTC: Papillary thyroid cancer |
| ∗log2FC in expression of this searched gene in stem-like cells from each diseased tissue sample relative to stem-like cells in normal samples in each tissue plotted against the malignancy continuum. Samples are colored based on if they are from different disease stage. |
Top |
Malignant transformation related pathway analysis |
| Find out the enriched GO biological processes and KEGG pathways involved in transition from healthy to precancer to cancer |
| Tissue | Disease Stage | Enriched GO biological Processes |
| Colorectum | AD |  |
| Colorectum | SER |  |
| Colorectum | MSS |  |
| Colorectum | MSI-H |  |
| Colorectum | FAP |  |
| ∗Top 15 enriched GO BP terms are showed in the bar plot of each disease state in each tissue. Each row represents a significant GO biological process which is colored according to the -log10(p.adjust). |
| Page: 1 2 3 4 5 6 7 8 9 |
| GO ID | Tissue | Disease Stage | Description | Gene Ratio | Bg Ratio | pvalue | p.adjust | Count |
| Page: 1 |
| Pathway ID | Tissue | Disease Stage | Description | Gene Ratio | Bg Ratio | pvalue | p.adjust | qvalue | Count |
| Page: 1 |
Top |
Cell-cell communication analysis |
| Identification of potential cell-cell interactions between two cell types and their ligand-receptor pairs for different disease states |
| Ligand | Receptor | LRpair | Pathway | Tissue | Disease Stage |
| Page: 1 |
Top |
Single-cell gene regulatory network inference analysis |
| Find out the significant the regulons (TFs) and the target genes of each regulon across cell types for different disease states |
| TF | Cell Type | Tissue | Disease Stage | Target Gene | RSS | Regulon Activity |
| ∗The dot plots of a searched regulon are shown for all cell subpopulations in each disease state of each tissue based on the regulon specific score inferred using pySCENIC and by calculating the average expression. |
| Page: 1 |
Top |
Somatic mutation of malignant transformation related genes |
| Annotation of somatic variants for genes involved in malignant transformation |
| Hugo Symbol | Variant Class | Variant Classification | dbSNP RS | HGVSc | HGVSp | HGVSp Short | SWISSPROT | BIOTYPE | SIFT | PolyPhen | Tumor Sample Barcode | Tissue | Histology | Sex | Age | Stage | Therapy Types | Drugs | Outcome |
| TMEM205 | insertion | Frame_Shift_Ins | novel | c.89_90insACCTTTTCCAGGGGGGGAAAAAAAAAGGCTAGGCATGG | p.Phe31ProfsTer31 | p.F31Pfs*31 | Q6UW68 | protein_coding | TCGA-A7-A0CE-01 | Breast | breast invasive carcinoma | Female | <65 | I/II | Chemotherapy | adriamycin | SD | ||
| TMEM205 | insertion | Frame_Shift_Ins | novel | c.14_15insTACGT | p.Asn6ThrfsTer2 | p.N6Tfs*2 | Q6UW68 | protein_coding | TCGA-B6-A0IK-01 | Breast | breast invasive carcinoma | Female | <65 | III/IV | Unknown | Unknown | PD | ||
| TMEM205 | insertion | In_Frame_Ins | novel | c.12_13insCAGCCA | p.Gly4_Gly5insGlnPro | p.G4_G5insQP | Q6UW68 | protein_coding | TCGA-B6-A0IK-01 | Breast | breast invasive carcinoma | Female | <65 | III/IV | Unknown | Unknown | PD | ||
| TMEM205 | insertion | In_Frame_Ins | novel | c.394_395insACA | p.Gly132delinsAspSer | p.G132delinsDS | Q6UW68 | protein_coding | TCGA-DS-A1OB-01 | Cervix | cervical & endocervical cancer | Female | <65 | I/II | Chemotherapy | carboplatin | PD | ||
| TMEM205 | insertion | In_Frame_Ins | novel | c.394_395insACA | p.Gly132delinsAspSer | p.G132delinsDS | Q6UW68 | protein_coding | TCGA-DS-A1OC-01 | Cervix | cervical & endocervical cancer | Female | <65 | I/II | Chemotherapy | gemcitabine | SD | ||
| TMEM205 | SNV | Missense_Mutation | rs377230544 | c.358N>A | p.Val120Met | p.V120M | Q6UW68 | protein_coding | tolerated(0.11) | benign(0.02) | TCGA-AZ-6601-01 | Colorectum | colon adenocarcinoma | Male | >=65 | I/II | Unknown | Unknown | PD |
| TMEM205 | SNV | Missense_Mutation | rs745312230 | c.307N>A | p.Ala103Thr | p.A103T | Q6UW68 | protein_coding | tolerated(0.2) | possibly_damaging(0.599) | TCGA-CK-5915-01 | Colorectum | colon adenocarcinoma | Male | <65 | I/II | Unknown | Unknown | SD |
| TMEM205 | SNV | Missense_Mutation | rs746159701 | c.85N>A | p.Val29Met | p.V29M | Q6UW68 | protein_coding | tolerated(0.06) | possibly_damaging(0.754) | TCGA-A5-A2K7-01 | Endometrium | uterine corpus endometrioid carcinoma | Female | <65 | I/II | Chemotherapy | taxol | SD |
| TMEM205 | SNV | Missense_Mutation | c.116G>A | p.Arg39Gln | p.R39Q | Q6UW68 | protein_coding | tolerated(0.12) | benign(0.06) | TCGA-AX-A0J0-01 | Endometrium | uterine corpus endometrioid carcinoma | Female | <65 | I/II | Unknown | Unknown | SD | |
| TMEM205 | SNV | Missense_Mutation | c.128N>A | p.Arg43Gln | p.R43Q | Q6UW68 | protein_coding | deleterious(0.01) | probably_damaging(0.986) | TCGA-D1-A17Q-01 | Endometrium | uterine corpus endometrioid carcinoma | Female | <65 | I/II | Unknown | Unknown | SD |
| Page: 1 2 |
Top |
Related drugs of malignant transformation related genes |
| Identification of chemicals and drugs interact with genes involved in malignant transfromation |
| (DGIdb 4.0) |
| Entrez ID | Symbol | Category | Interaction Types | Drug Claim Name | Drug Name | PMIDs |
| Page: 1 |

Copyright 2023-Present -The University of Texas Health Science Center at Houston |