
|
|||||
|
 | |
| |
| |
| |
| |
| |
|
Gene: TMEM189 |
Gene summary for TMEM189 |
| Gene information | Species | Human | Gene symbol | TMEM189 | Gene ID | 387521 |
| Gene name | plasmanylethanolamine desaturase 1 | |
| Gene Alias | CarF | |
| Cytomap | 20q13.13 | |
| Gene Type | protein-coding | GO ID | GO:0006082 | UniProtAcc | A5PLL7 |
Top |
Malignant transformation analysis |
| Identification of the aberrant gene expression in precancerous and cancerous lesions by comparing the gene expression of stem-like cells in diseased tissues with normal stem cells |
| Entrez ID | Symbol | Replicates | Species | Organ | Tissue | Adj P-value | Log2FC | Malignancy |
| 387521 | TMEM189 | P19T-E | Human | Esophagus | ESCC | 1.37e-06 | 7.30e-01 | 0.1662 |
| 387521 | TMEM189 | P20T-E | Human | Esophagus | ESCC | 3.78e-52 | 1.23e+00 | 0.1124 |
| 387521 | TMEM189 | P21T-E | Human | Esophagus | ESCC | 3.38e-87 | 1.79e+00 | 0.1617 |
| 387521 | TMEM189 | P22T-E | Human | Esophagus | ESCC | 4.13e-57 | 9.49e-01 | 0.1236 |
| 387521 | TMEM189 | P23T-E | Human | Esophagus | ESCC | 4.97e-57 | 1.57e+00 | 0.108 |
| 387521 | TMEM189 | P24T-E | Human | Esophagus | ESCC | 1.11e-50 | 1.05e+00 | 0.1287 |
| 387521 | TMEM189 | P26T-E | Human | Esophagus | ESCC | 2.75e-105 | 1.84e+00 | 0.1276 |
| 387521 | TMEM189 | P27T-E | Human | Esophagus | ESCC | 1.92e-35 | 6.11e-01 | 0.1055 |
| 387521 | TMEM189 | P28T-E | Human | Esophagus | ESCC | 6.87e-51 | 1.01e+00 | 0.1149 |
| 387521 | TMEM189 | P30T-E | Human | Esophagus | ESCC | 4.22e-58 | 1.73e+00 | 0.137 |
| 387521 | TMEM189 | P31T-E | Human | Esophagus | ESCC | 1.30e-84 | 1.29e+00 | 0.1251 |
| 387521 | TMEM189 | P32T-E | Human | Esophagus | ESCC | 1.08e-87 | 1.69e+00 | 0.1666 |
| 387521 | TMEM189 | P36T-E | Human | Esophagus | ESCC | 2.21e-33 | 1.12e+00 | 0.1187 |
| 387521 | TMEM189 | P37T-E | Human | Esophagus | ESCC | 3.36e-33 | 9.97e-01 | 0.1371 |
| 387521 | TMEM189 | P38T-E | Human | Esophagus | ESCC | 3.79e-13 | 6.53e-01 | 0.127 |
| 387521 | TMEM189 | P39T-E | Human | Esophagus | ESCC | 4.22e-44 | 7.36e-01 | 0.0894 |
| 387521 | TMEM189 | P40T-E | Human | Esophagus | ESCC | 3.21e-18 | 6.10e-01 | 0.109 |
| 387521 | TMEM189 | P42T-E | Human | Esophagus | ESCC | 1.69e-38 | 1.23e+00 | 0.1175 |
| 387521 | TMEM189 | P44T-E | Human | Esophagus | ESCC | 2.34e-22 | 8.39e-01 | 0.1096 |
| 387521 | TMEM189 | P47T-E | Human | Esophagus | ESCC | 5.36e-49 | 1.12e+00 | 0.1067 |
| Page: 1 2 3 4 5 6 |
| Tissue | Expression Dynamics | Abbreviation |
| Esophagus | 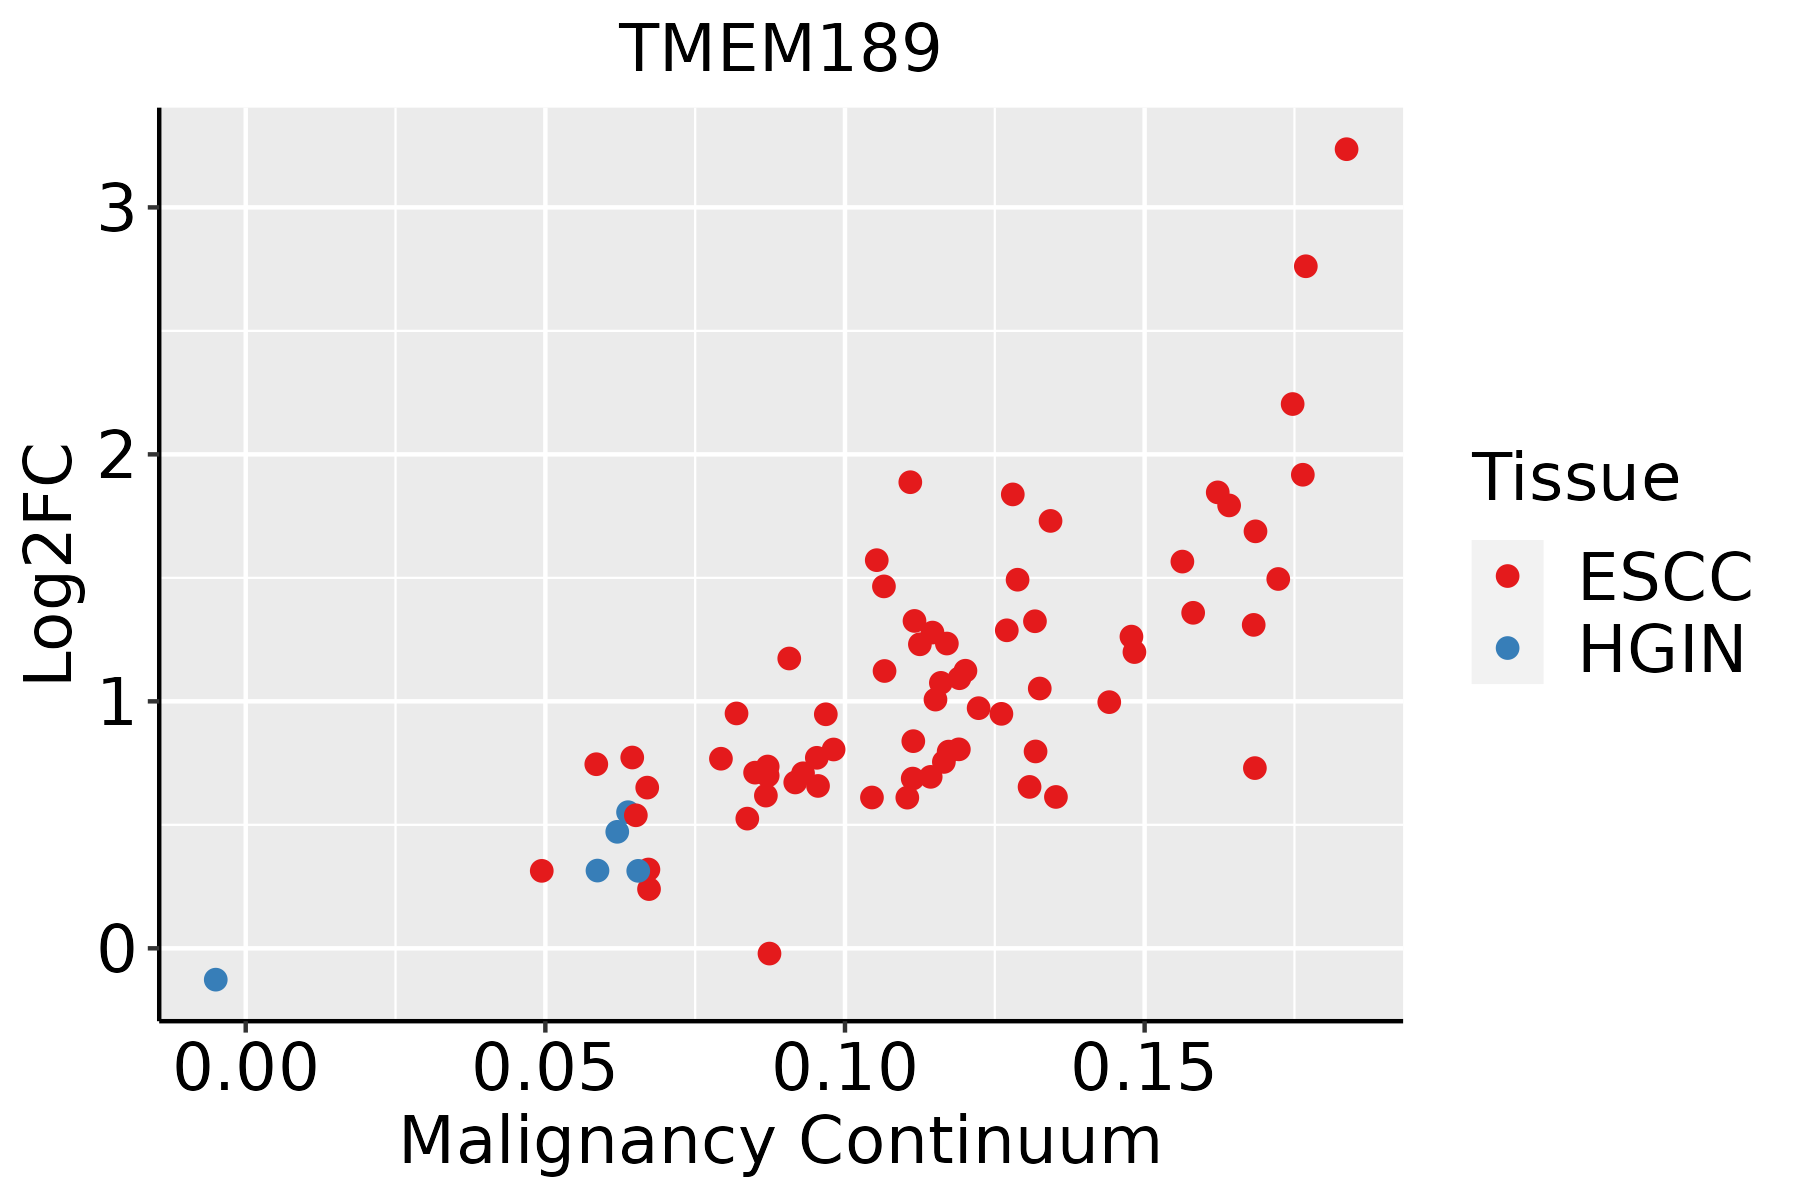 | ESCC: Esophageal squamous cell carcinoma |
| HGIN: High-grade intraepithelial neoplasias | ||
| LGIN: Low-grade intraepithelial neoplasias | ||
| Liver | 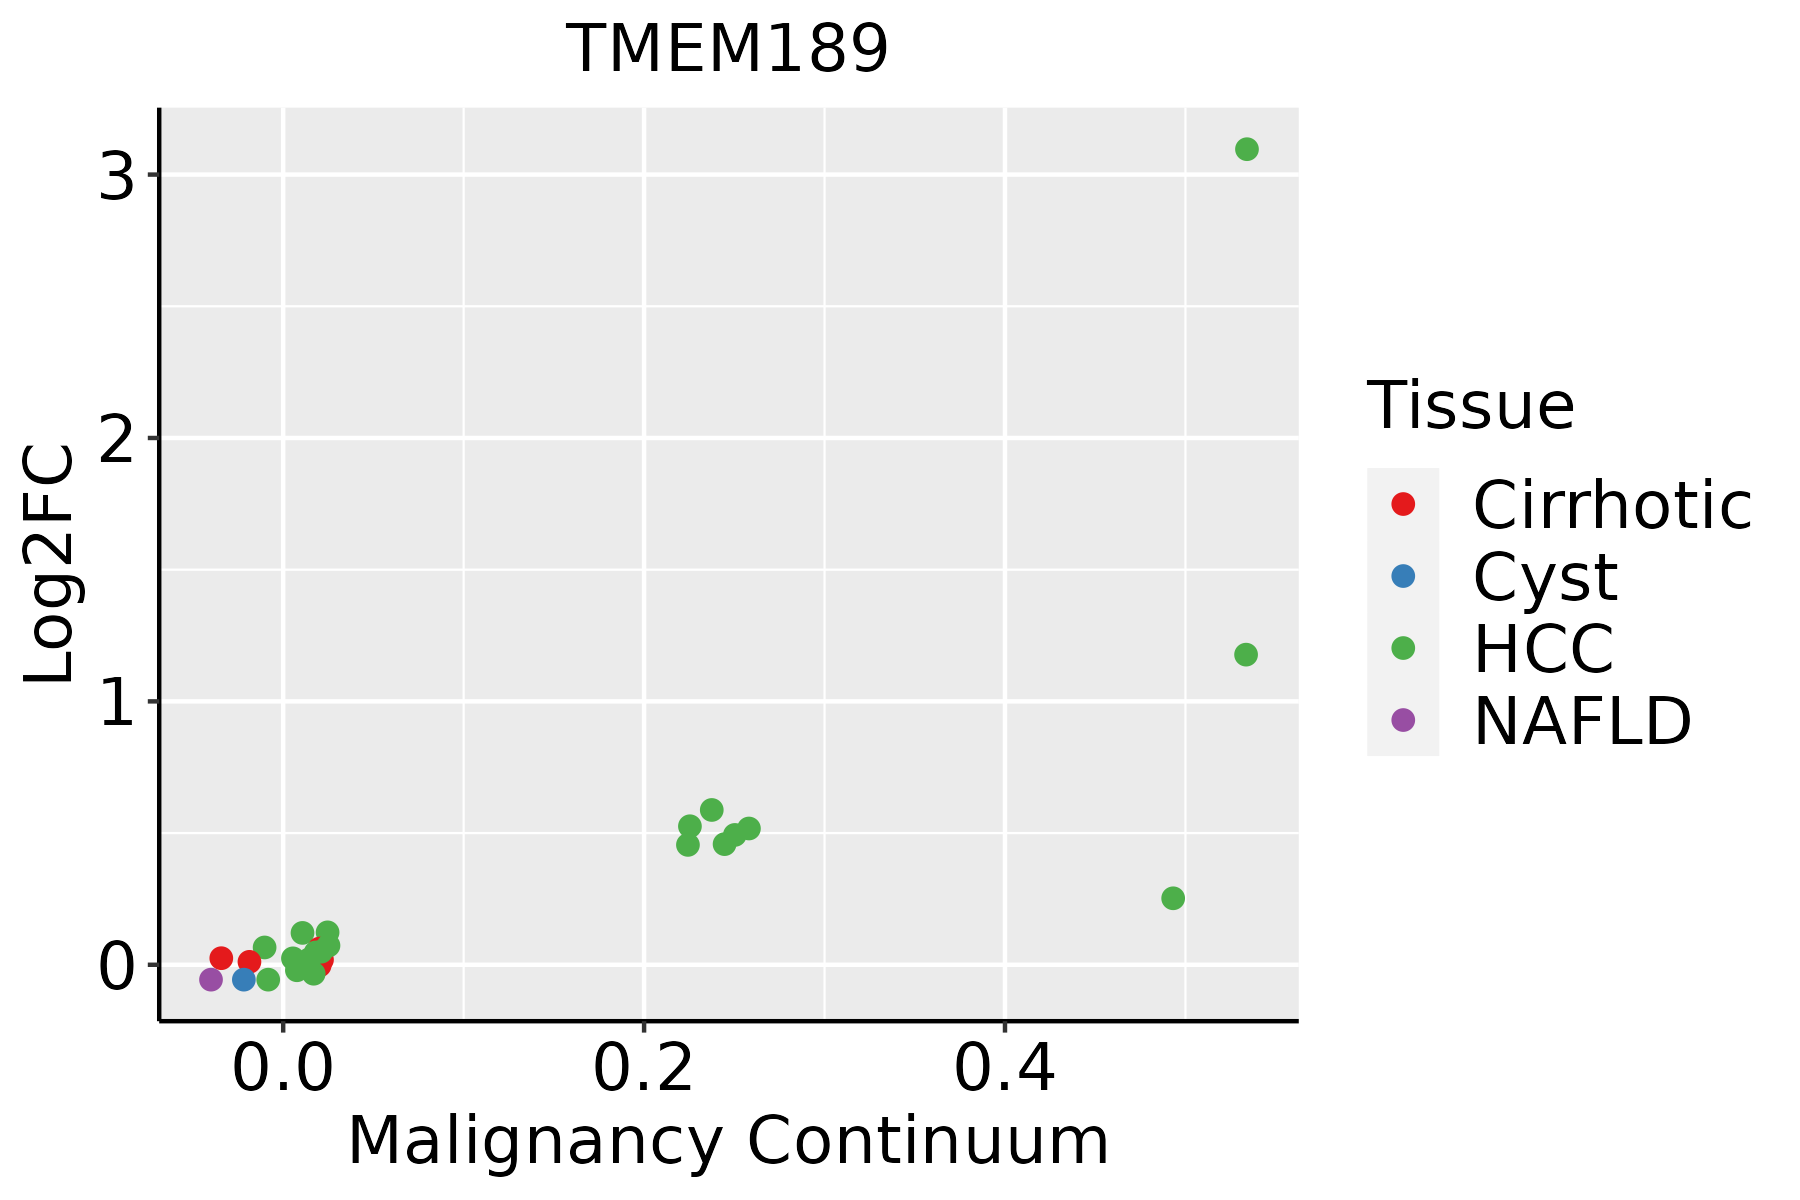 | HCC: Hepatocellular carcinoma |
| NAFLD: Non-alcoholic fatty liver disease | ||
| Oral Cavity | 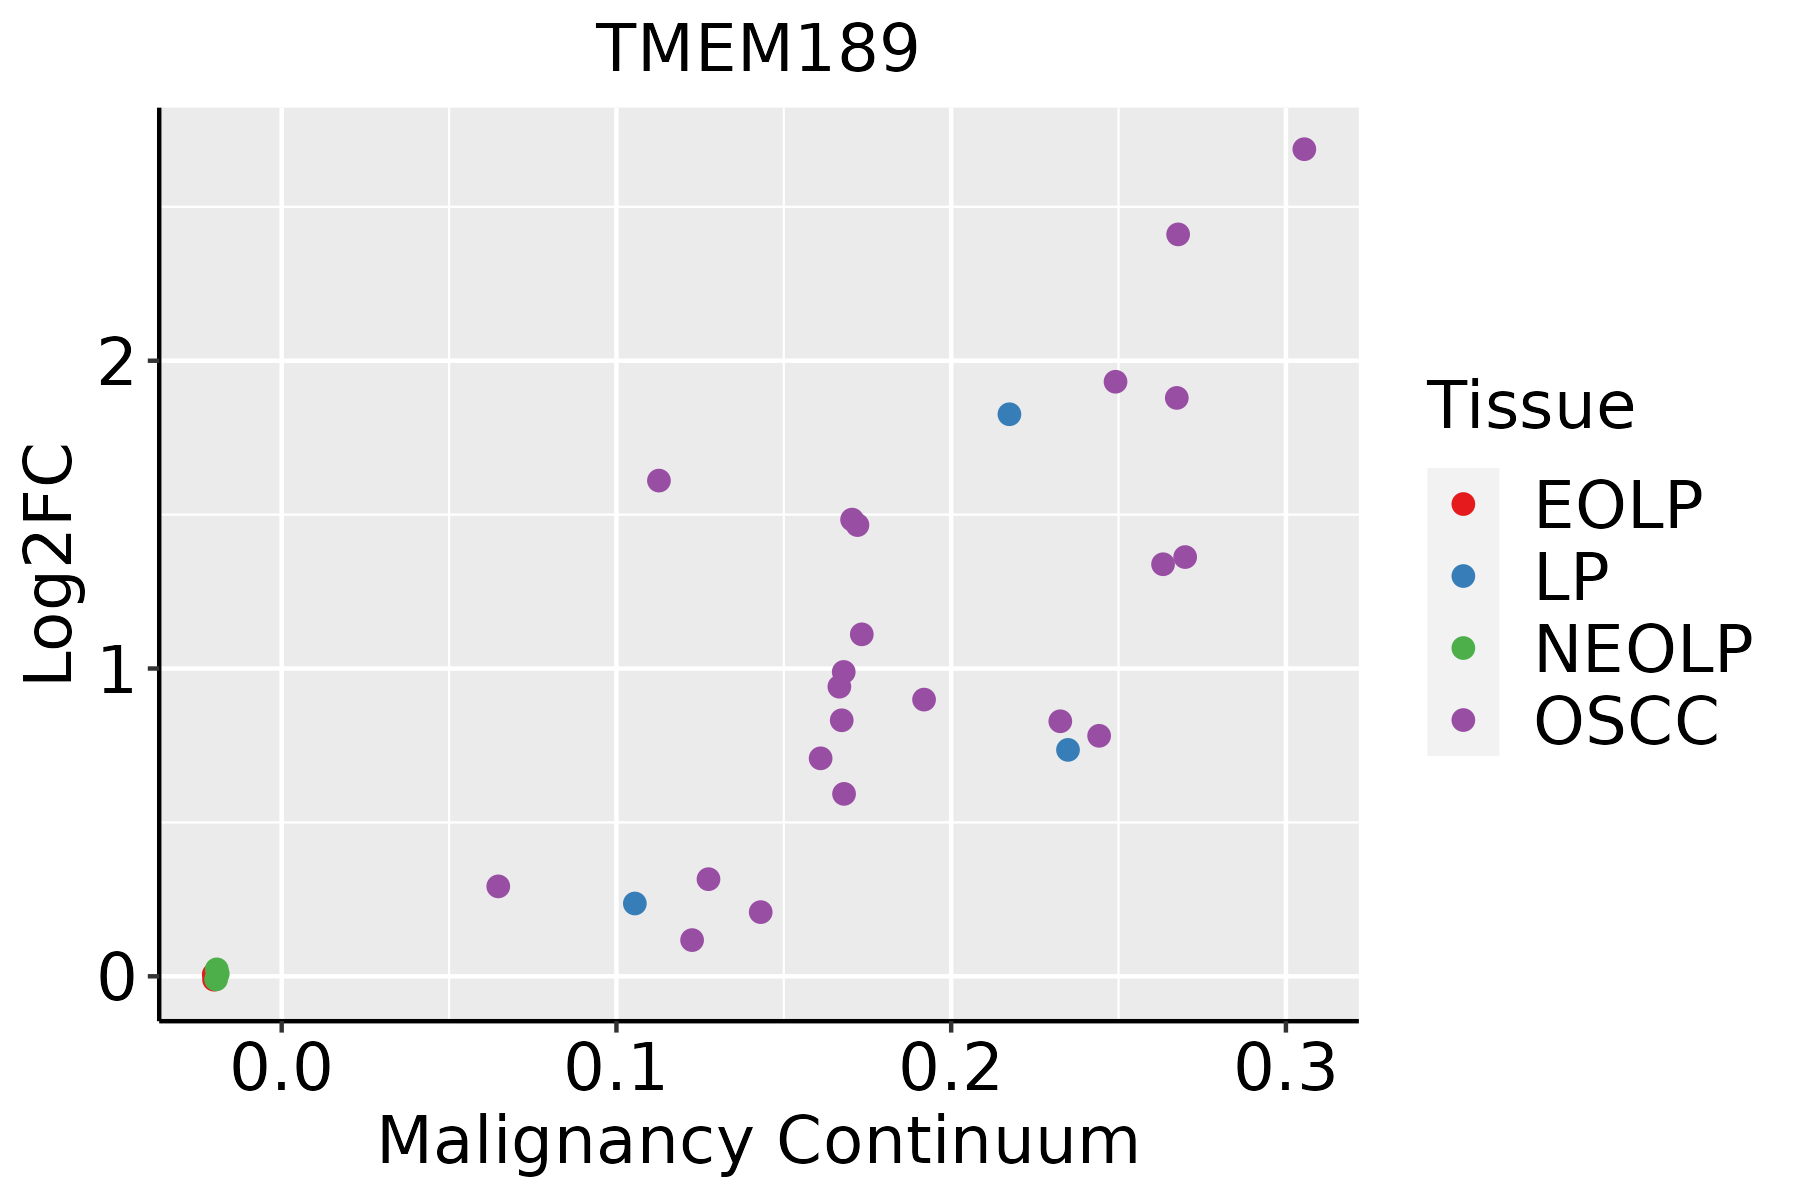 | EOLP: Erosive Oral lichen planus |
| LP: leukoplakia | ||
| NEOLP: Non-erosive oral lichen planus | ||
| OSCC: Oral squamous cell carcinoma | ||
| Skin | 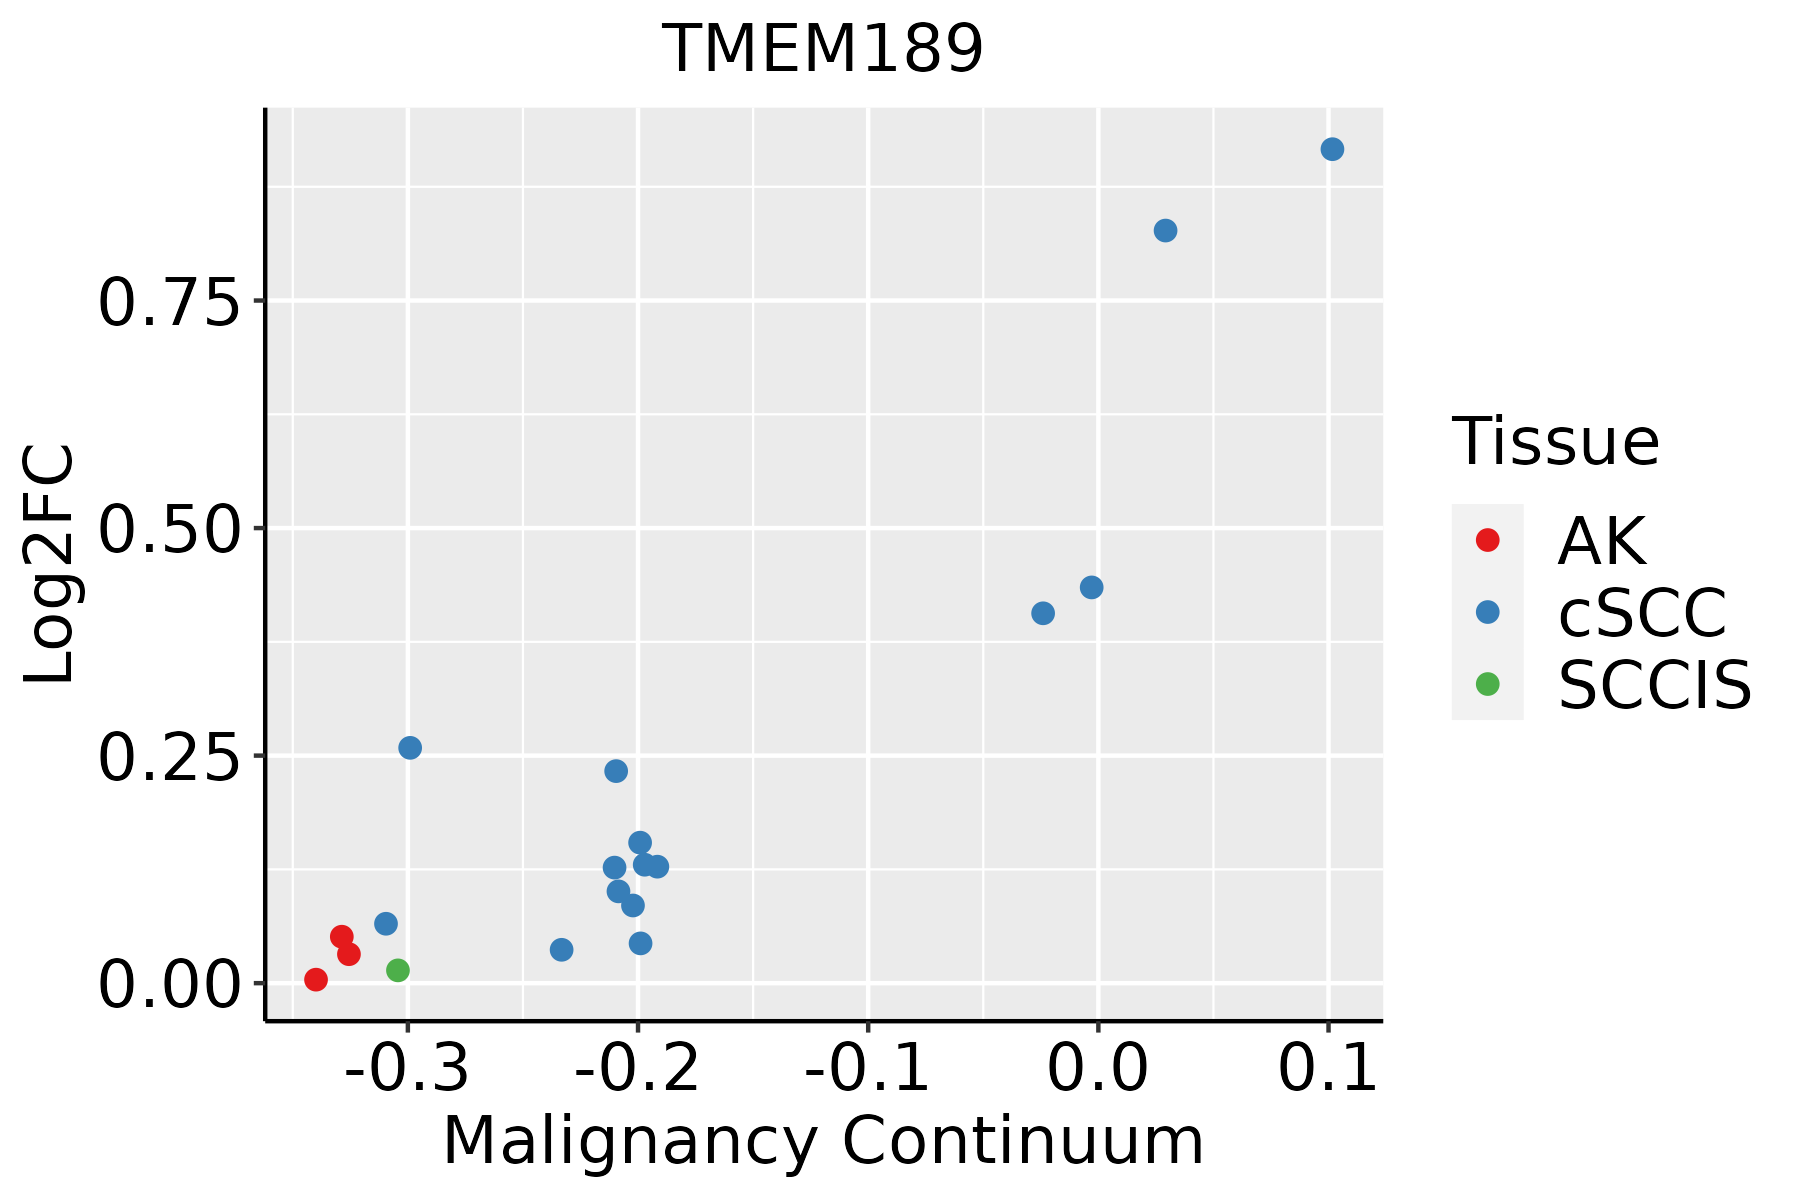 | AK: Actinic keratosis |
| cSCC: Cutaneous squamous cell carcinoma | ||
| SCCIS:squamous cell carcinoma in situ | ||
| Thyroid | 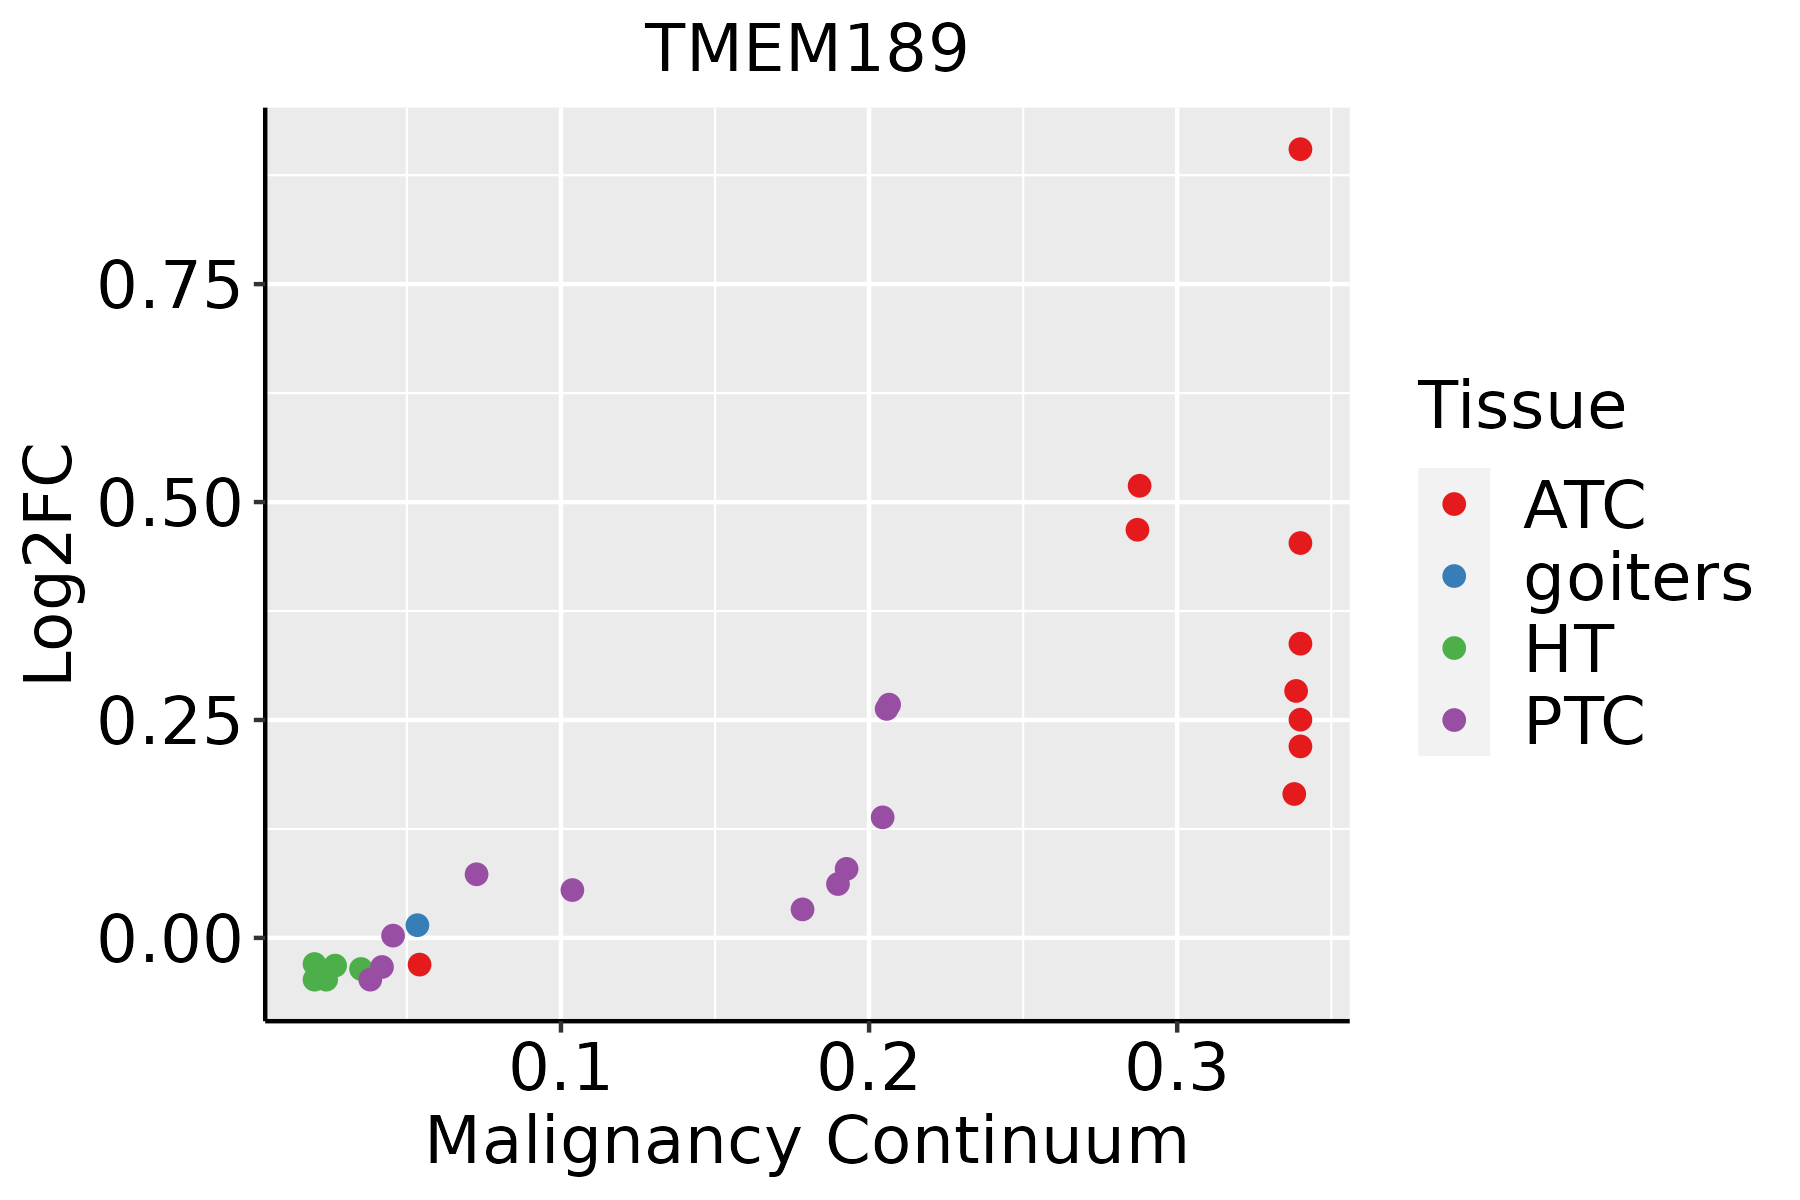 | ATC: Anaplastic thyroid cancer |
| HT: Hashimoto's thyroiditis | ||
| PTC: Papillary thyroid cancer |
| ∗log2FC in expression of this searched gene in stem-like cells from each diseased tissue sample relative to stem-like cells in normal samples in each tissue plotted against the malignancy continuum. Samples are colored based on if they are from different disease stage. |
Top |
Malignant transformation related pathway analysis |
| Find out the enriched GO biological processes and KEGG pathways involved in transition from healthy to precancer to cancer |
| Tissue | Disease Stage | Enriched GO biological Processes |
| Colorectum | AD |  |
| Colorectum | SER |  |
| Colorectum | MSS |  |
| Colorectum | MSI-H |  |
| Colorectum | FAP |  |
| ∗Top 15 enriched GO BP terms are showed in the bar plot of each disease state in each tissue. Each row represents a significant GO biological process which is colored according to the -log10(p.adjust). |
| Page: 1 2 3 4 5 6 7 8 9 |
| GO ID | Tissue | Disease Stage | Description | Gene Ratio | Bg Ratio | pvalue | p.adjust | Count |
| Page: 1 |
| Pathway ID | Tissue | Disease Stage | Description | Gene Ratio | Bg Ratio | pvalue | p.adjust | qvalue | Count |
| Page: 1 |
Top |
Cell-cell communication analysis |
| Identification of potential cell-cell interactions between two cell types and their ligand-receptor pairs for different disease states |
| Ligand | Receptor | LRpair | Pathway | Tissue | Disease Stage |
| Page: 1 |
Top |
Single-cell gene regulatory network inference analysis |
| Find out the significant the regulons (TFs) and the target genes of each regulon across cell types for different disease states |
| TF | Cell Type | Tissue | Disease Stage | Target Gene | RSS | Regulon Activity |
| ∗The dot plots of a searched regulon are shown for all cell subpopulations in each disease state of each tissue based on the regulon specific score inferred using pySCENIC and by calculating the average expression. |
| Page: 1 |
Top |
Somatic mutation of malignant transformation related genes |
| Annotation of somatic variants for genes involved in malignant transformation |
| Hugo Symbol | Variant Class | Variant Classification | dbSNP RS | HGVSc | HGVSp | HGVSp Short | SWISSPROT | BIOTYPE | SIFT | PolyPhen | Tumor Sample Barcode | Tissue | Histology | Sex | Age | Stage | Therapy Types | Drugs | Outcome |
| TMEM189 | SNV | Missense_Mutation | rs201575410 | c.761N>T | p.Thr254Met | p.T254M | A5PLL7 | protein_coding | deleterious(0) | probably_damaging(0.992) | TCGA-EA-A3HS-01 | Cervix | cervical & endocervical cancer | Female | <65 | I/II | Unknown | Unknown | SD |
| TMEM189 | SNV | Missense_Mutation | novel | c.786N>G | p.Asp262Glu | p.D262E | A5PLL7 | protein_coding | deleterious(0) | probably_damaging(1) | TCGA-AG-A01N-01 | Colorectum | rectum adenocarcinoma | Female | >=65 | III/IV | Chemotherapy | capecitabine | SD |
| TMEM189 | insertion | Frame_Shift_Ins | novel | c.776_777insAATTT | p.Ala260IlefsTer6 | p.A260Ifs*6 | A5PLL7 | protein_coding | TCGA-AM-5820-01 | Colorectum | colon adenocarcinoma | Female | <65 | I/II | Unknown | Unknown | SD |
| Page: 1 |
Top |
Related drugs of malignant transformation related genes |
| Identification of chemicals and drugs interact with genes involved in malignant transfromation |
| (DGIdb 4.0) |
| Entrez ID | Symbol | Category | Interaction Types | Drug Claim Name | Drug Name | PMIDs |
| Page: 1 |

Copyright 2023-Present -The University of Texas Health Science Center at Houston |