
|
|||||
|
 | |
| |
| |
| |
| |
| |
|
Gene: TMEM128 |
Gene summary for TMEM128 |
| Gene information | Species | Human | Gene symbol | TMEM128 | Gene ID | 85013 |
| Gene name | transmembrane protein 128 | |
| Gene Alias | TMEM128 | |
| Cytomap | 4p16.3 | |
| Gene Type | protein-coding | GO ID | GO:0008150 | UniProtAcc | B7Z3K1 |
Top |
Malignant transformation analysis |
| Identification of the aberrant gene expression in precancerous and cancerous lesions by comparing the gene expression of stem-like cells in diseased tissues with normal stem cells |
| Entrez ID | Symbol | Replicates | Species | Organ | Tissue | Adj P-value | Log2FC | Malignancy |
| 85013 | TMEM128 | P26T-E | Human | Esophagus | ESCC | 2.16e-05 | 7.70e-02 | 0.1276 |
| 85013 | TMEM128 | P27T-E | Human | Esophagus | ESCC | 5.51e-07 | 1.70e-01 | 0.1055 |
| 85013 | TMEM128 | P28T-E | Human | Esophagus | ESCC | 7.63e-14 | 1.71e-01 | 0.1149 |
| 85013 | TMEM128 | P30T-E | Human | Esophagus | ESCC | 2.78e-14 | 3.90e-01 | 0.137 |
| 85013 | TMEM128 | P31T-E | Human | Esophagus | ESCC | 6.90e-19 | 3.51e-01 | 0.1251 |
| 85013 | TMEM128 | P32T-E | Human | Esophagus | ESCC | 2.43e-22 | 4.67e-01 | 0.1666 |
| 85013 | TMEM128 | P36T-E | Human | Esophagus | ESCC | 5.76e-04 | 2.01e-01 | 0.1187 |
| 85013 | TMEM128 | P37T-E | Human | Esophagus | ESCC | 5.16e-15 | 2.21e-01 | 0.1371 |
| 85013 | TMEM128 | P39T-E | Human | Esophagus | ESCC | 1.49e-10 | 1.88e-01 | 0.0894 |
| 85013 | TMEM128 | P42T-E | Human | Esophagus | ESCC | 4.74e-05 | 1.52e-01 | 0.1175 |
| 85013 | TMEM128 | P44T-E | Human | Esophagus | ESCC | 3.30e-06 | 2.61e-01 | 0.1096 |
| 85013 | TMEM128 | P47T-E | Human | Esophagus | ESCC | 4.12e-16 | 2.91e-01 | 0.1067 |
| 85013 | TMEM128 | P48T-E | Human | Esophagus | ESCC | 7.95e-03 | 8.29e-02 | 0.0959 |
| 85013 | TMEM128 | P49T-E | Human | Esophagus | ESCC | 1.22e-05 | 2.63e-01 | 0.1768 |
| 85013 | TMEM128 | P52T-E | Human | Esophagus | ESCC | 1.16e-12 | 2.44e-01 | 0.1555 |
| 85013 | TMEM128 | P54T-E | Human | Esophagus | ESCC | 8.13e-13 | 1.48e-01 | 0.0975 |
| 85013 | TMEM128 | P56T-E | Human | Esophagus | ESCC | 6.78e-14 | 1.39e+00 | 0.1613 |
| 85013 | TMEM128 | P57T-E | Human | Esophagus | ESCC | 2.44e-14 | 2.78e-01 | 0.0926 |
| 85013 | TMEM128 | P61T-E | Human | Esophagus | ESCC | 2.83e-15 | 3.84e-01 | 0.099 |
| 85013 | TMEM128 | P62T-E | Human | Esophagus | ESCC | 1.71e-20 | 3.60e-01 | 0.1302 |
| Page: 1 2 3 4 5 |
| Tissue | Expression Dynamics | Abbreviation |
| Esophagus | 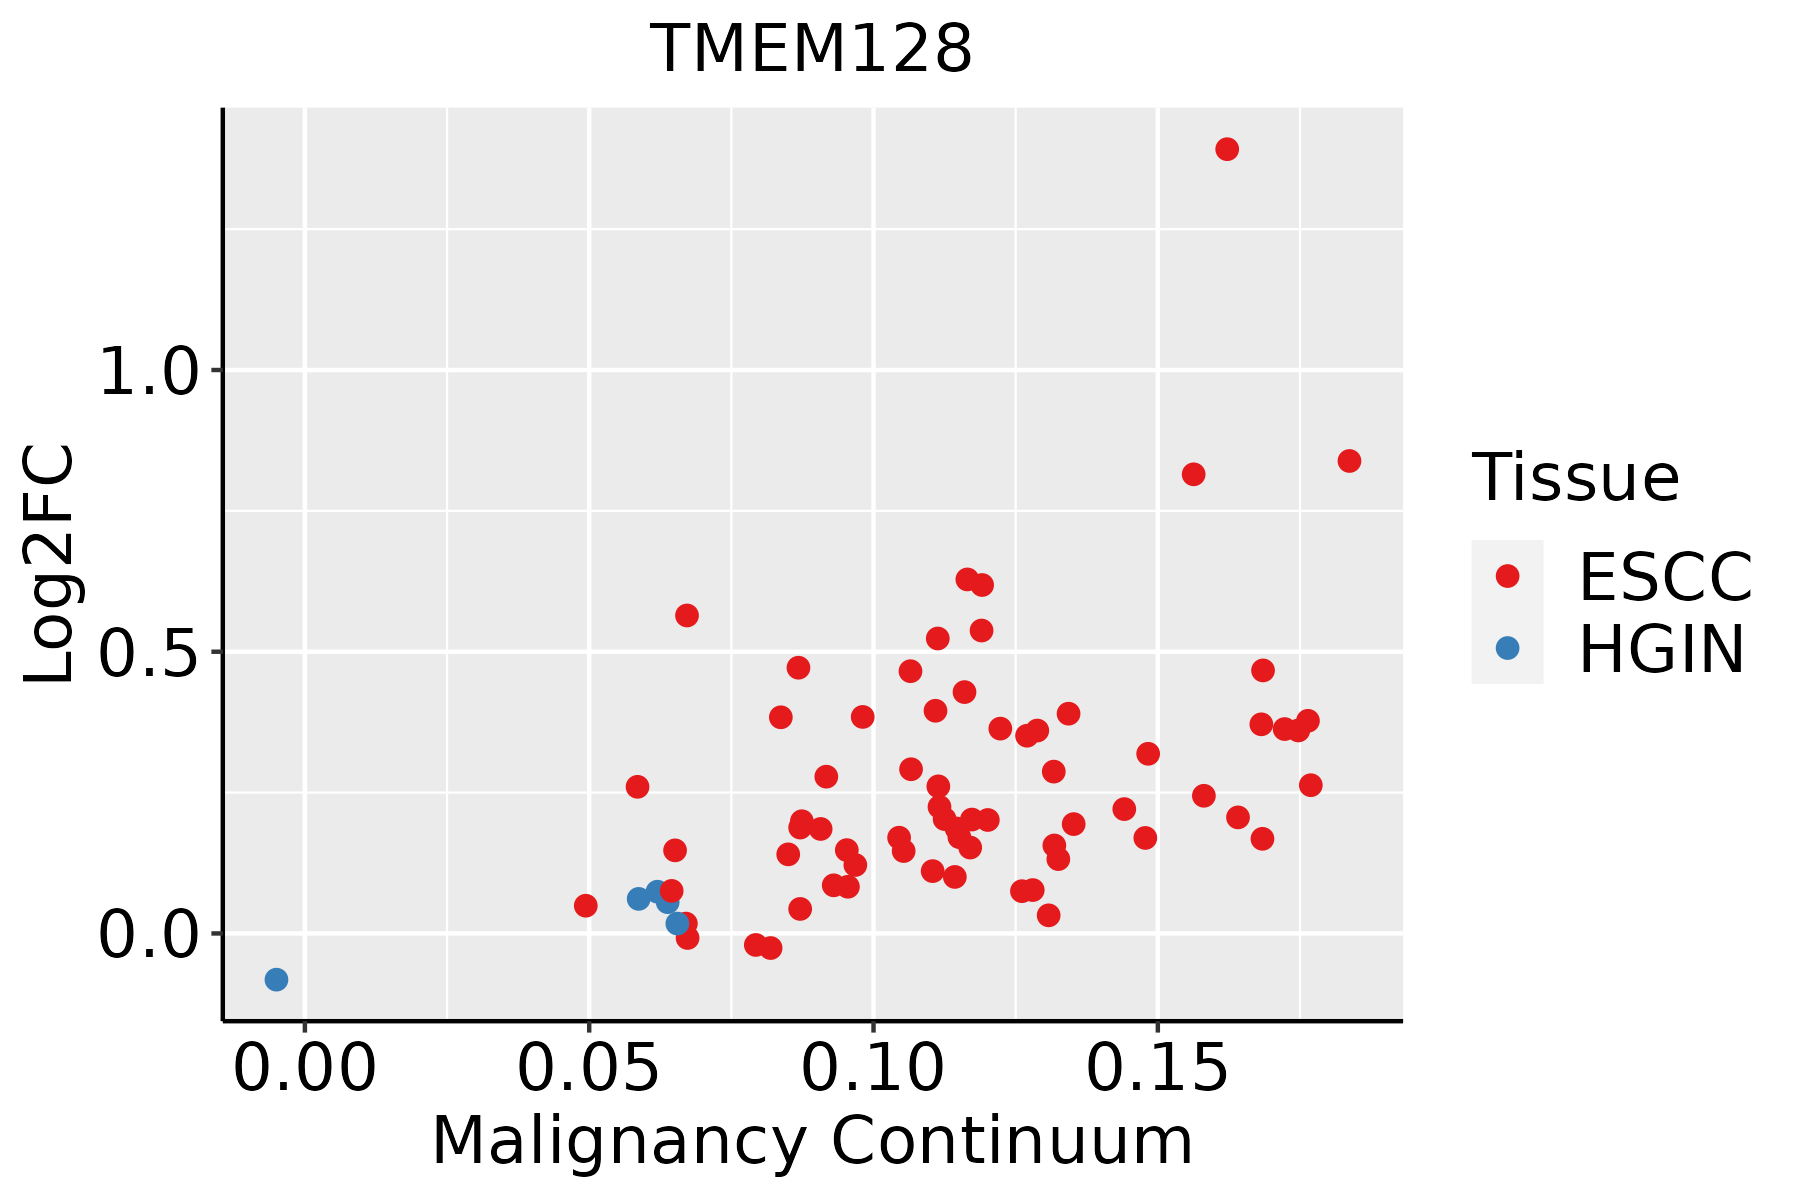 | ESCC: Esophageal squamous cell carcinoma |
| HGIN: High-grade intraepithelial neoplasias | ||
| LGIN: Low-grade intraepithelial neoplasias | ||
| Oral Cavity | 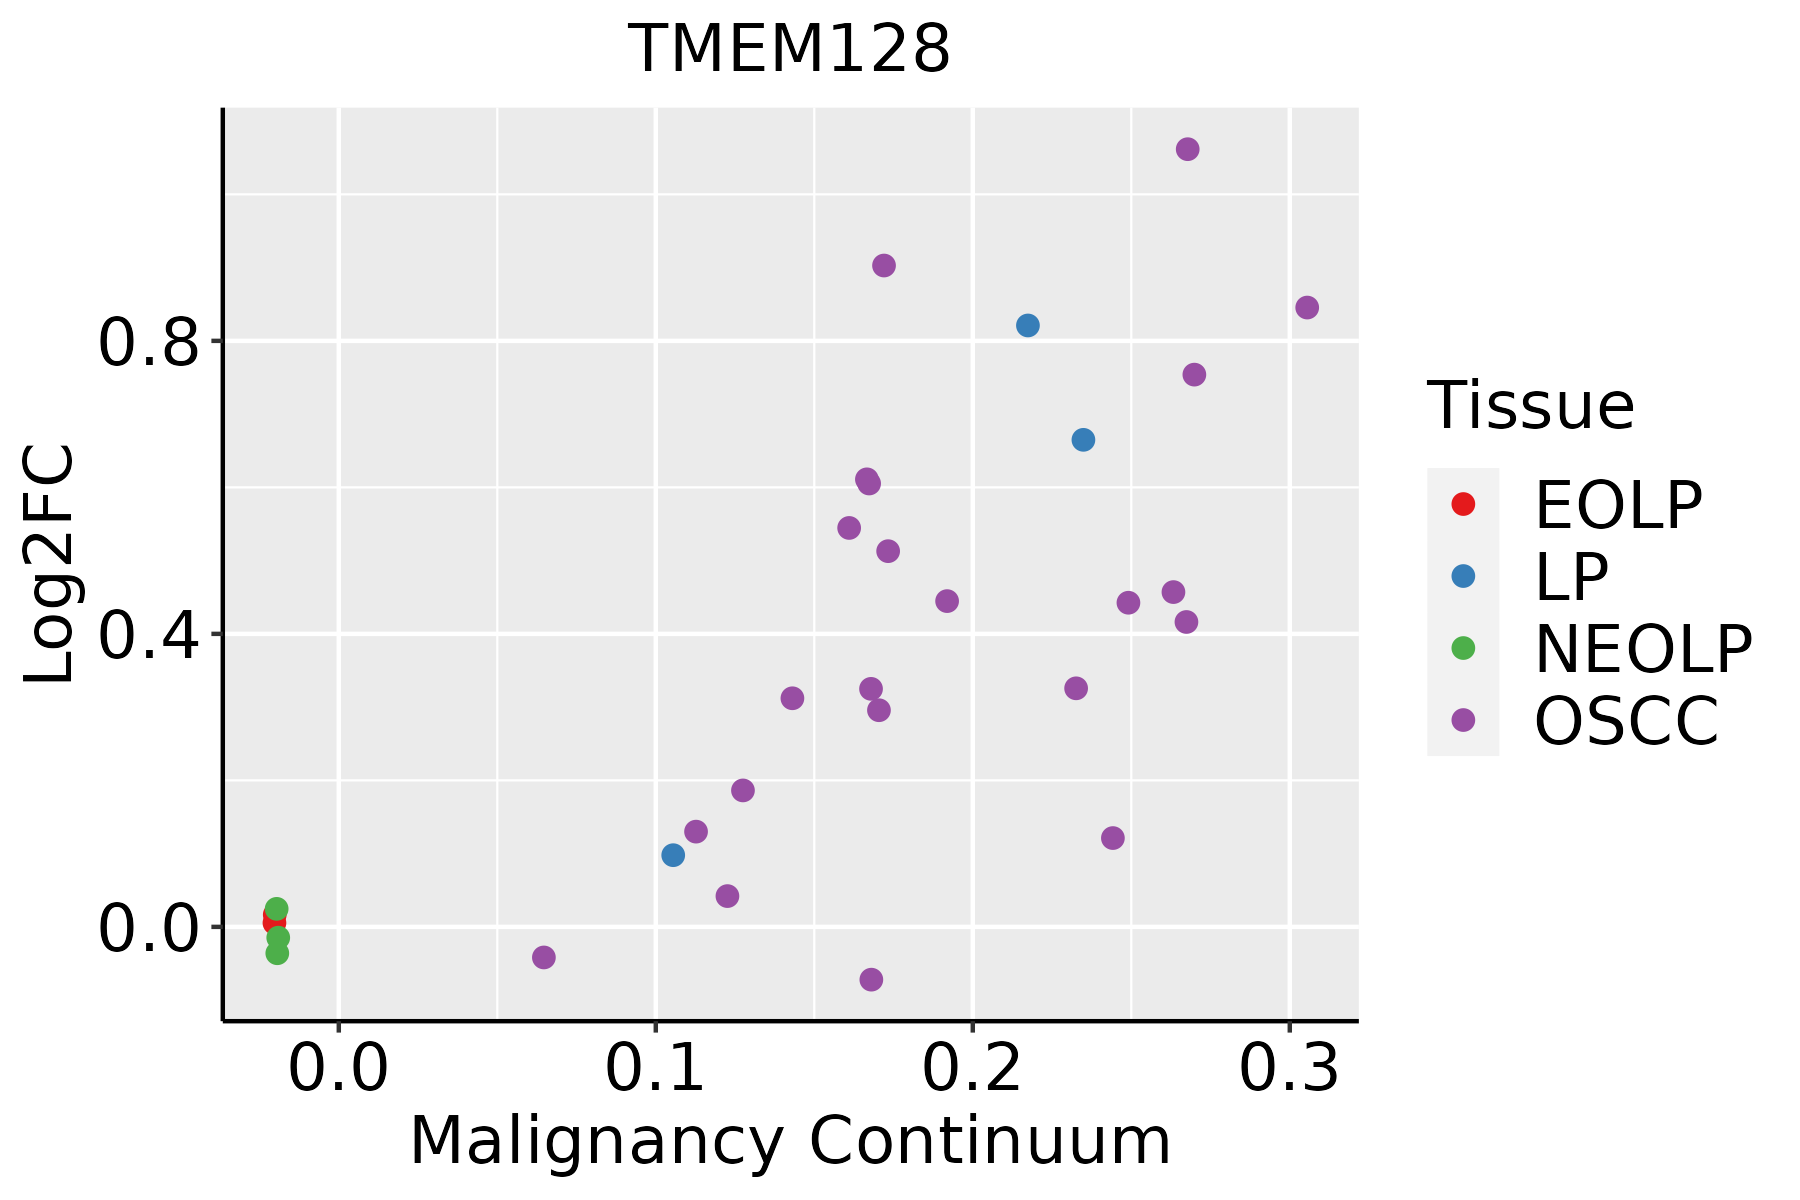 | EOLP: Erosive Oral lichen planus |
| LP: leukoplakia | ||
| NEOLP: Non-erosive oral lichen planus | ||
| OSCC: Oral squamous cell carcinoma | ||
| Thyroid | 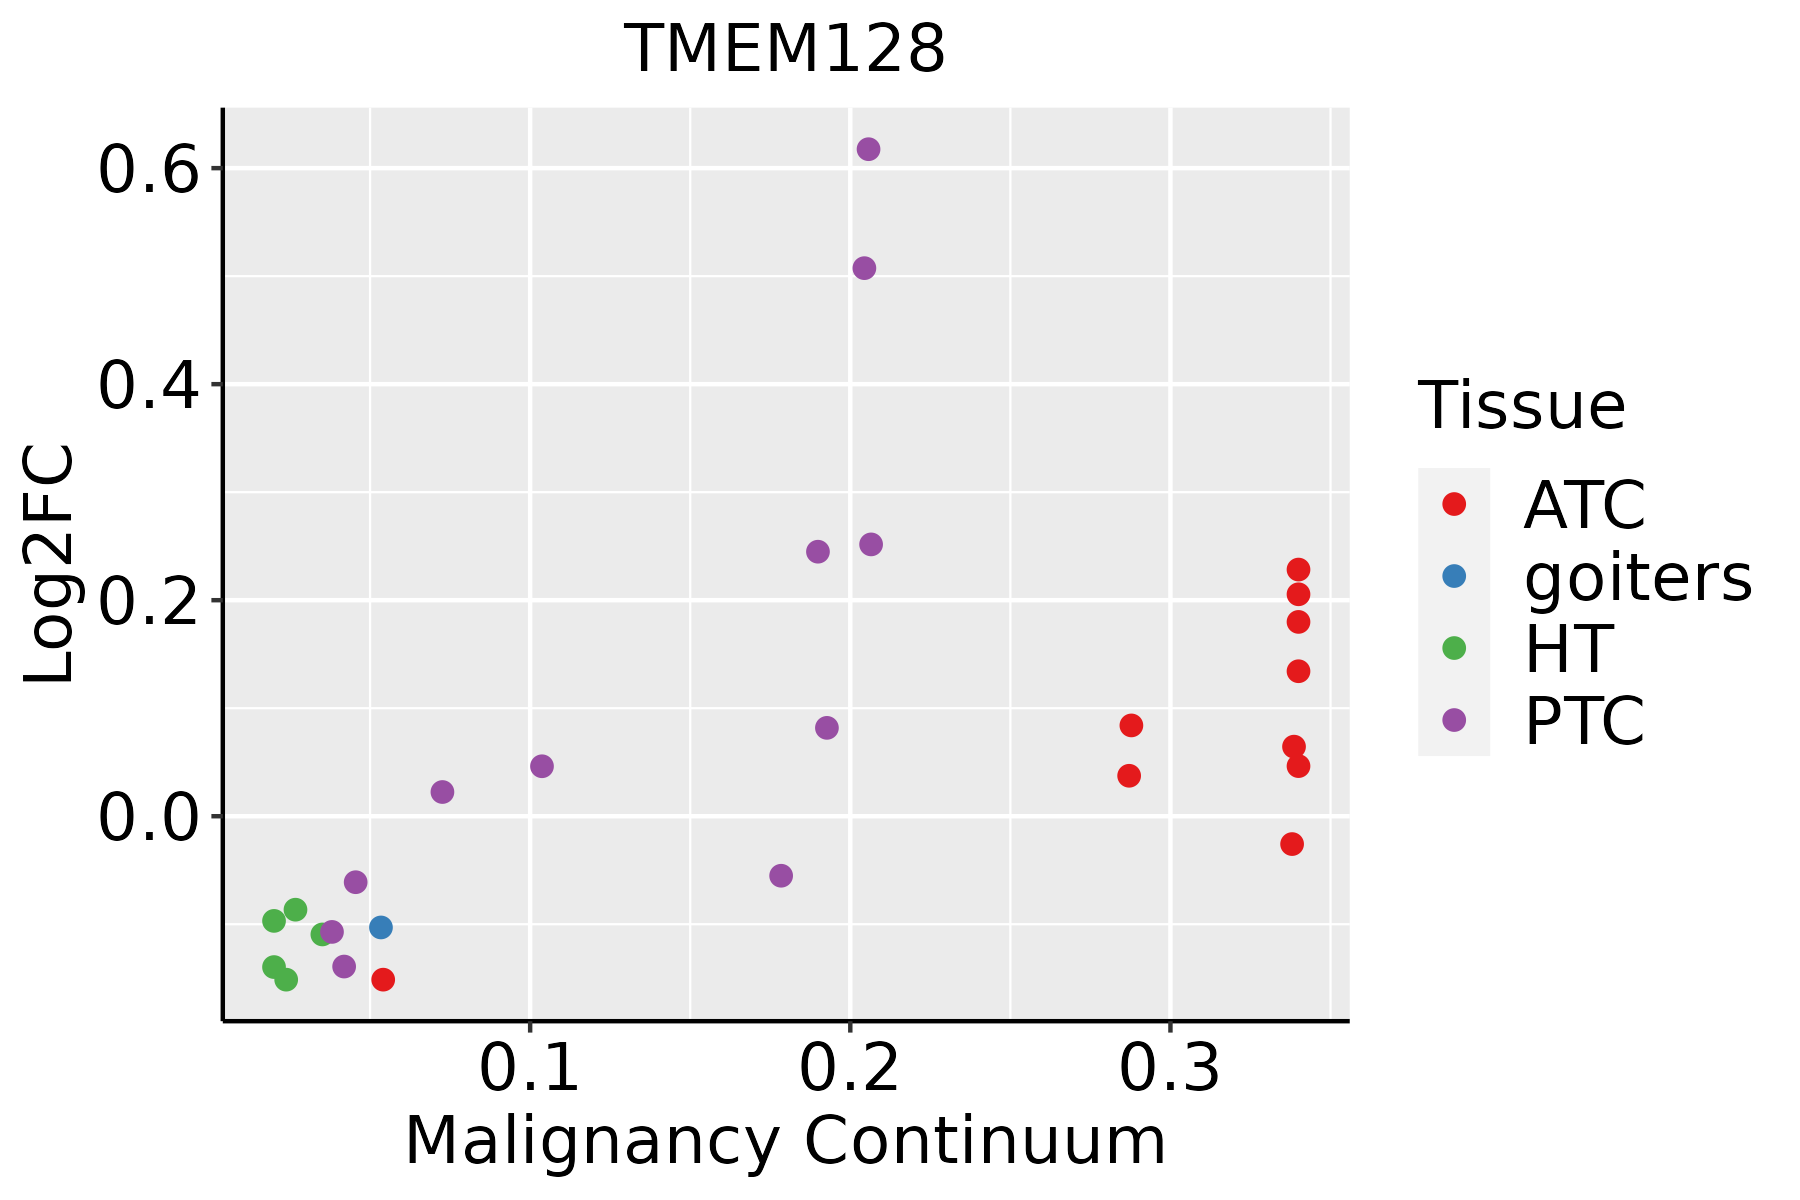 | ATC: Anaplastic thyroid cancer |
| HT: Hashimoto's thyroiditis | ||
| PTC: Papillary thyroid cancer |
| ∗log2FC in expression of this searched gene in stem-like cells from each diseased tissue sample relative to stem-like cells in normal samples in each tissue plotted against the malignancy continuum. Samples are colored based on if they are from different disease stage. |
Top |
Malignant transformation related pathway analysis |
| Find out the enriched GO biological processes and KEGG pathways involved in transition from healthy to precancer to cancer |
| Tissue | Disease Stage | Enriched GO biological Processes |
| Colorectum | AD |  |
| Colorectum | SER |  |
| Colorectum | MSS |  |
| Colorectum | MSI-H |  |
| Colorectum | FAP |  |
| ∗Top 15 enriched GO BP terms are showed in the bar plot of each disease state in each tissue. Each row represents a significant GO biological process which is colored according to the -log10(p.adjust). |
| Page: 1 2 3 4 5 6 7 8 9 |
| GO ID | Tissue | Disease Stage | Description | Gene Ratio | Bg Ratio | pvalue | p.adjust | Count |
| Page: 1 |
| Pathway ID | Tissue | Disease Stage | Description | Gene Ratio | Bg Ratio | pvalue | p.adjust | qvalue | Count |
| Page: 1 |
Top |
Cell-cell communication analysis |
| Identification of potential cell-cell interactions between two cell types and their ligand-receptor pairs for different disease states |
| Ligand | Receptor | LRpair | Pathway | Tissue | Disease Stage |
| Page: 1 |
Top |
Single-cell gene regulatory network inference analysis |
| Find out the significant the regulons (TFs) and the target genes of each regulon across cell types for different disease states |
| TF | Cell Type | Tissue | Disease Stage | Target Gene | RSS | Regulon Activity |
| ∗The dot plots of a searched regulon are shown for all cell subpopulations in each disease state of each tissue based on the regulon specific score inferred using pySCENIC and by calculating the average expression. |
| Page: 1 |
Top |
Somatic mutation of malignant transformation related genes |
| Annotation of somatic variants for genes involved in malignant transformation |
| Hugo Symbol | Variant Class | Variant Classification | dbSNP RS | HGVSc | HGVSp | HGVSp Short | SWISSPROT | BIOTYPE | SIFT | PolyPhen | Tumor Sample Barcode | Tissue | Histology | Sex | Age | Stage | Therapy Types | Drugs | Outcome |
| TMEM128 | deletion | Frame_Shift_Del | novel | c.214delN | p.Glu74LysfsTer27 | p.E74Kfs*27 | protein_coding | TCGA-D8-A27V-01 | Breast | breast invasive carcinoma | Female | <65 | I/II | Hormone Therapy | tamoxiphen | SD | |||
| TMEM128 | SNV | Missense_Mutation | novel | c.127A>G | p.Lys43Glu | p.K43E | protein_coding | tolerated(0.08) | benign(0.359) | TCGA-2W-A8YY-01 | Cervix | cervical & endocervical cancer | Female | <65 | I/II | Chemotherapy | cisplatin | CR | |
| TMEM128 | SNV | Missense_Mutation | c.269N>A | p.Leu90His | p.L90H | protein_coding | tolerated(0.55) | possibly_damaging(0.8) | TCGA-AA-A02J-01 | Colorectum | colon adenocarcinoma | Female | >=65 | III/IV | Unknown | Unknown | PD | ||
| TMEM128 | insertion | Frame_Shift_Ins | novel | c.122_123insA | p.Glu42GlyfsTer8 | p.E42Gfs*8 | protein_coding | TCGA-AA-A00N-01 | Colorectum | colon adenocarcinoma | Male | >=65 | I/II | Unknown | Unknown | PD | |||
| TMEM128 | SNV | Missense_Mutation | rs138483289 | c.404N>G | p.Asn135Ser | p.N135S | protein_coding | deleterious(0.02) | probably_damaging(0.994) | TCGA-AX-A05Z-01 | Endometrium | uterine corpus endometrioid carcinoma | Female | <65 | III/IV | Chemotherapy | adriamycin | SD | |
| TMEM128 | SNV | Missense_Mutation | novel | c.286G>A | p.Ala96Thr | p.A96T | protein_coding | deleterious(0) | possibly_damaging(0.586) | TCGA-AX-A06F-01 | Endometrium | uterine corpus endometrioid carcinoma | Female | <65 | III/IV | Chemotherapy | carboplatin | SD | |
| TMEM128 | SNV | Missense_Mutation | novel | c.466N>A | p.Gly156Arg | p.G156R | protein_coding | deleterious(0) | probably_damaging(1) | TCGA-B5-A3FA-01 | Endometrium | uterine corpus endometrioid carcinoma | Female | >=65 | I/II | Unknown | Unknown | SD | |
| TMEM128 | SNV | Missense_Mutation | c.481A>T | p.Ile161Phe | p.I161F | protein_coding | deleterious(0) | possibly_damaging(0.555) | TCGA-BS-A0UJ-01 | Endometrium | uterine corpus endometrioid carcinoma | Female | >=65 | I/II | Unknown | Unknown | SD | ||
| TMEM128 | SNV | Missense_Mutation | novel | c.172N>A | p.Ala58Thr | p.A58T | protein_coding | deleterious(0.04) | benign(0.043) | TCGA-EO-A3AZ-01 | Endometrium | uterine corpus endometrioid carcinoma | Female | >=65 | I/II | Unknown | Unknown | SD | |
| TMEM128 | SNV | Missense_Mutation | rs759483260 | c.376N>C | p.Ser126Pro | p.S126P | protein_coding | deleterious(0.01) | benign(0.014) | TCGA-FI-A2D5-01 | Endometrium | uterine corpus endometrioid carcinoma | Female | <65 | III/IV | Chemotherapy | carboplatinum | PD |
| Page: 1 2 |
Top |
Related drugs of malignant transformation related genes |
| Identification of chemicals and drugs interact with genes involved in malignant transfromation |
| (DGIdb 4.0) |
| Entrez ID | Symbol | Category | Interaction Types | Drug Claim Name | Drug Name | PMIDs |
| Page: 1 |

Copyright 2023-Present -The University of Texas Health Science Center at Houston |