
|
|||||
|
 | |
| |
| |
| |
| |
| |
|
Gene: TLE5 |
Gene summary for TLE5 |
| Gene information | Species | Human | Gene symbol | TLE5 | Gene ID | 166 |
| Gene name | TLE family member 5, transcriptional modulator | |
| Gene Alias | AES | |
| Cytomap | 19p13.3 | |
| Gene Type | protein-coding | GO ID | GO:0000122 | UniProtAcc | Q08117 |
Top |
Malignant transformation analysis |
| Identification of the aberrant gene expression in precancerous and cancerous lesions by comparing the gene expression of stem-like cells in diseased tissues with normal stem cells |
| Entrez ID | Symbol | Replicates | Species | Organ | Tissue | Adj P-value | Log2FC | Malignancy |
| 166 | TLE5 | HTA11_696_2000001011 | Human | Colorectum | AD | 8.80e-32 | 5.54e-01 | -0.1464 |
| 166 | TLE5 | HTA11_866_2000001011 | Human | Colorectum | AD | 1.15e-20 | 3.84e-01 | -0.1001 |
| 166 | TLE5 | HTA11_1391_2000001011 | Human | Colorectum | AD | 6.86e-22 | 4.78e-01 | -0.059 |
| 166 | TLE5 | HTA11_2992_2000001011 | Human | Colorectum | SER | 2.54e-11 | 4.44e-01 | -0.1706 |
| 166 | TLE5 | HTA11_5212_2000001011 | Human | Colorectum | AD | 1.67e-10 | 4.21e-01 | -0.2061 |
| 166 | TLE5 | HTA11_5216_2000001011 | Human | Colorectum | SER | 3.40e-03 | 3.08e-01 | -0.1462 |
| 166 | TLE5 | HTA11_546_2000001011 | Human | Colorectum | AD | 1.74e-13 | 4.80e-01 | -0.0842 |
| 166 | TLE5 | HTA11_9408_2000001011 | Human | Colorectum | AD | 1.03e-10 | 6.40e-01 | 0.0451 |
| 166 | TLE5 | HTA11_8622_2000001021 | Human | Colorectum | SER | 6.14e-04 | 2.47e-01 | 0.0528 |
| 166 | TLE5 | HTA11_10623_2000001011 | Human | Colorectum | AD | 6.46e-07 | 3.87e-01 | -0.0177 |
| 166 | TLE5 | HTA11_6801_2000001011 | Human | Colorectum | SER | 1.85e-04 | 3.58e-01 | 0.0171 |
| 166 | TLE5 | HTA11_10711_2000001011 | Human | Colorectum | AD | 1.67e-11 | 3.54e-01 | 0.0338 |
| 166 | TLE5 | HTA11_7696_3000711011 | Human | Colorectum | AD | 2.46e-16 | 3.02e-01 | 0.0674 |
| 166 | TLE5 | AEH-subject1 | Human | Endometrium | AEH | 1.12e-54 | 7.79e-01 | -0.3059 |
| 166 | TLE5 | AEH-subject2 | Human | Endometrium | AEH | 2.56e-47 | 8.50e-01 | -0.2525 |
| 166 | TLE5 | AEH-subject3 | Human | Endometrium | AEH | 6.74e-36 | 6.24e-01 | -0.2576 |
| 166 | TLE5 | AEH-subject4 | Human | Endometrium | AEH | 3.74e-15 | 3.74e-01 | -0.2657 |
| 166 | TLE5 | AEH-subject5 | Human | Endometrium | AEH | 6.48e-14 | 2.87e-01 | -0.2953 |
| 166 | TLE5 | EEC-subject1 | Human | Endometrium | EEC | 2.44e-20 | 4.26e-01 | -0.2682 |
| 166 | TLE5 | EEC-subject2 | Human | Endometrium | EEC | 7.83e-39 | 7.21e-01 | -0.2607 |
| Page: 1 2 3 4 5 6 7 |
| Tissue | Expression Dynamics | Abbreviation |
| Cervix | 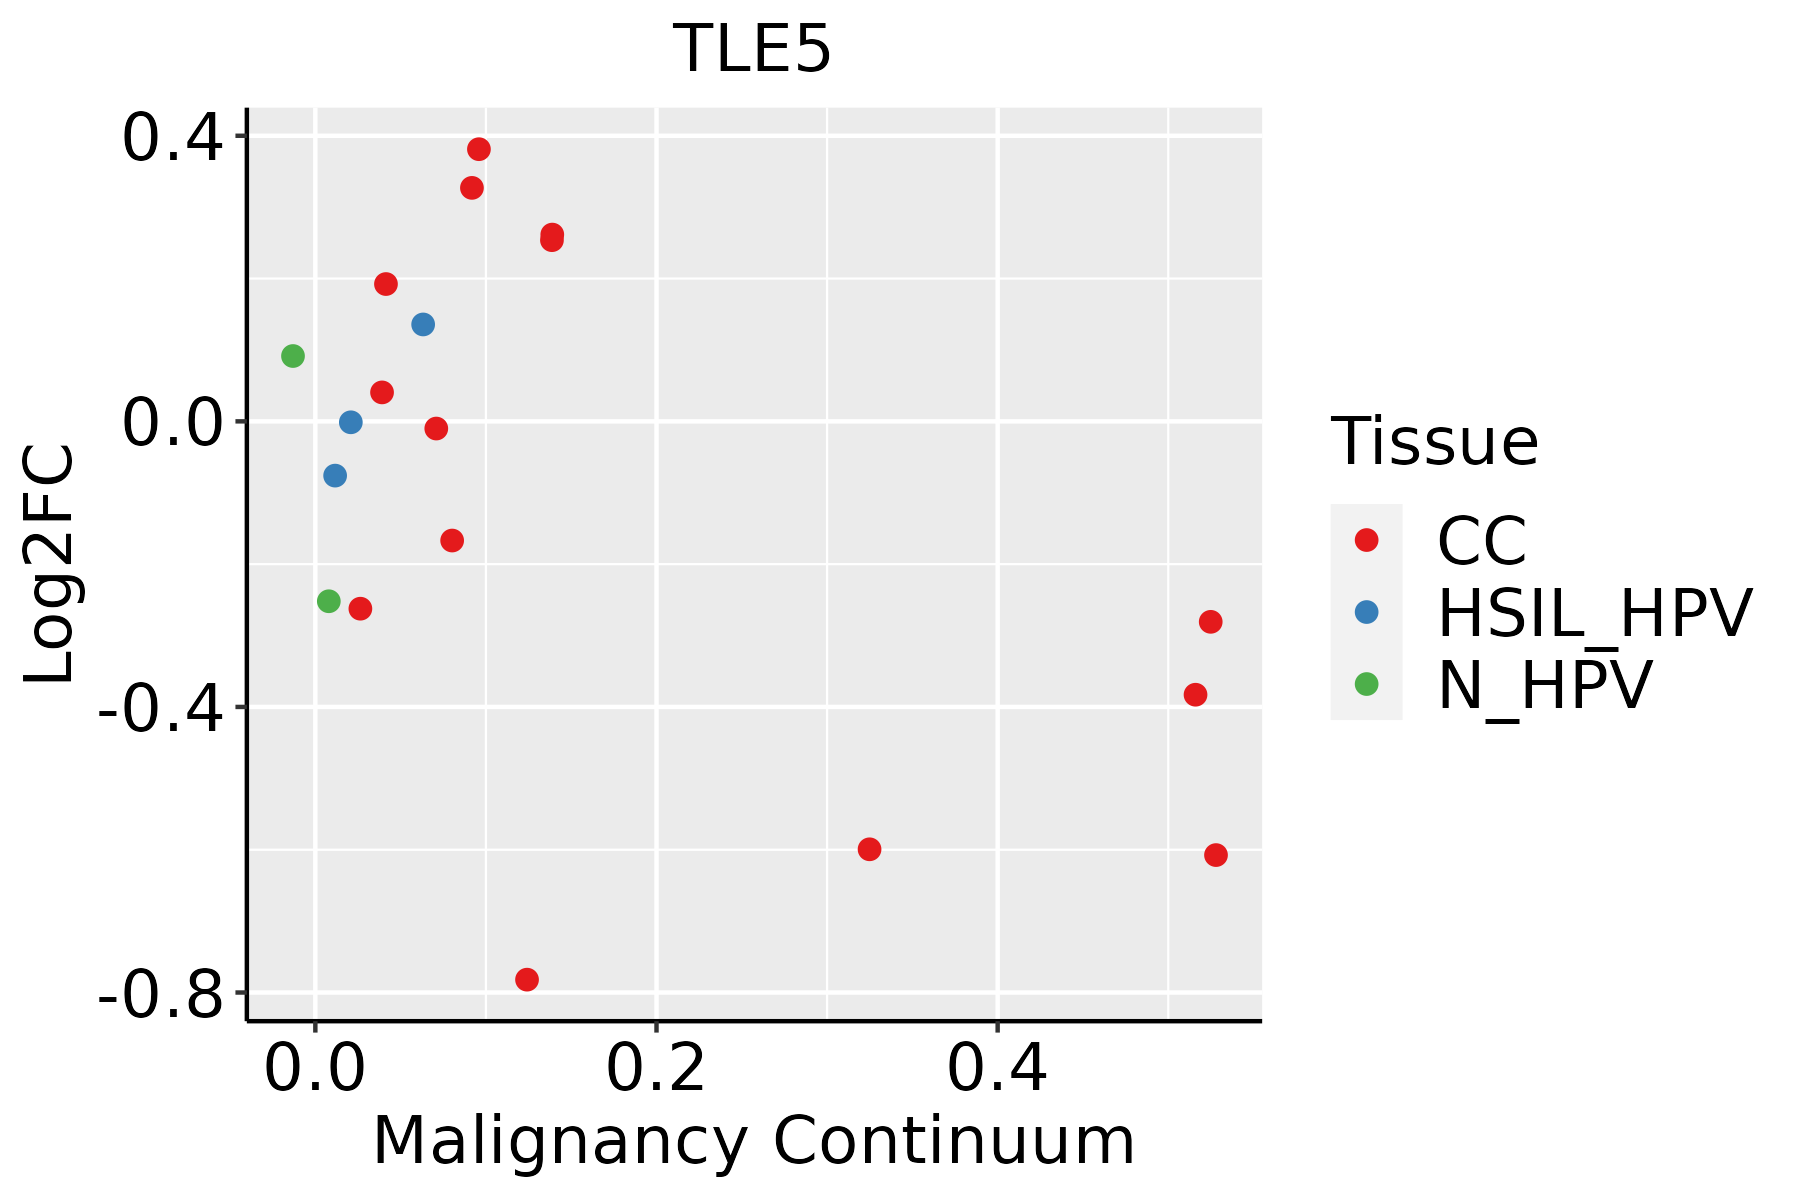 | CC: Cervix cancer |
| HSIL_HPV: HPV-infected high-grade squamous intraepithelial lesions | ||
| N_HPV: HPV-infected normal cervix | ||
| Colorectum (GSE201348) |  | FAP: Familial adenomatous polyposis |
| CRC: Colorectal cancer | ||
| Colorectum (HTA11) | 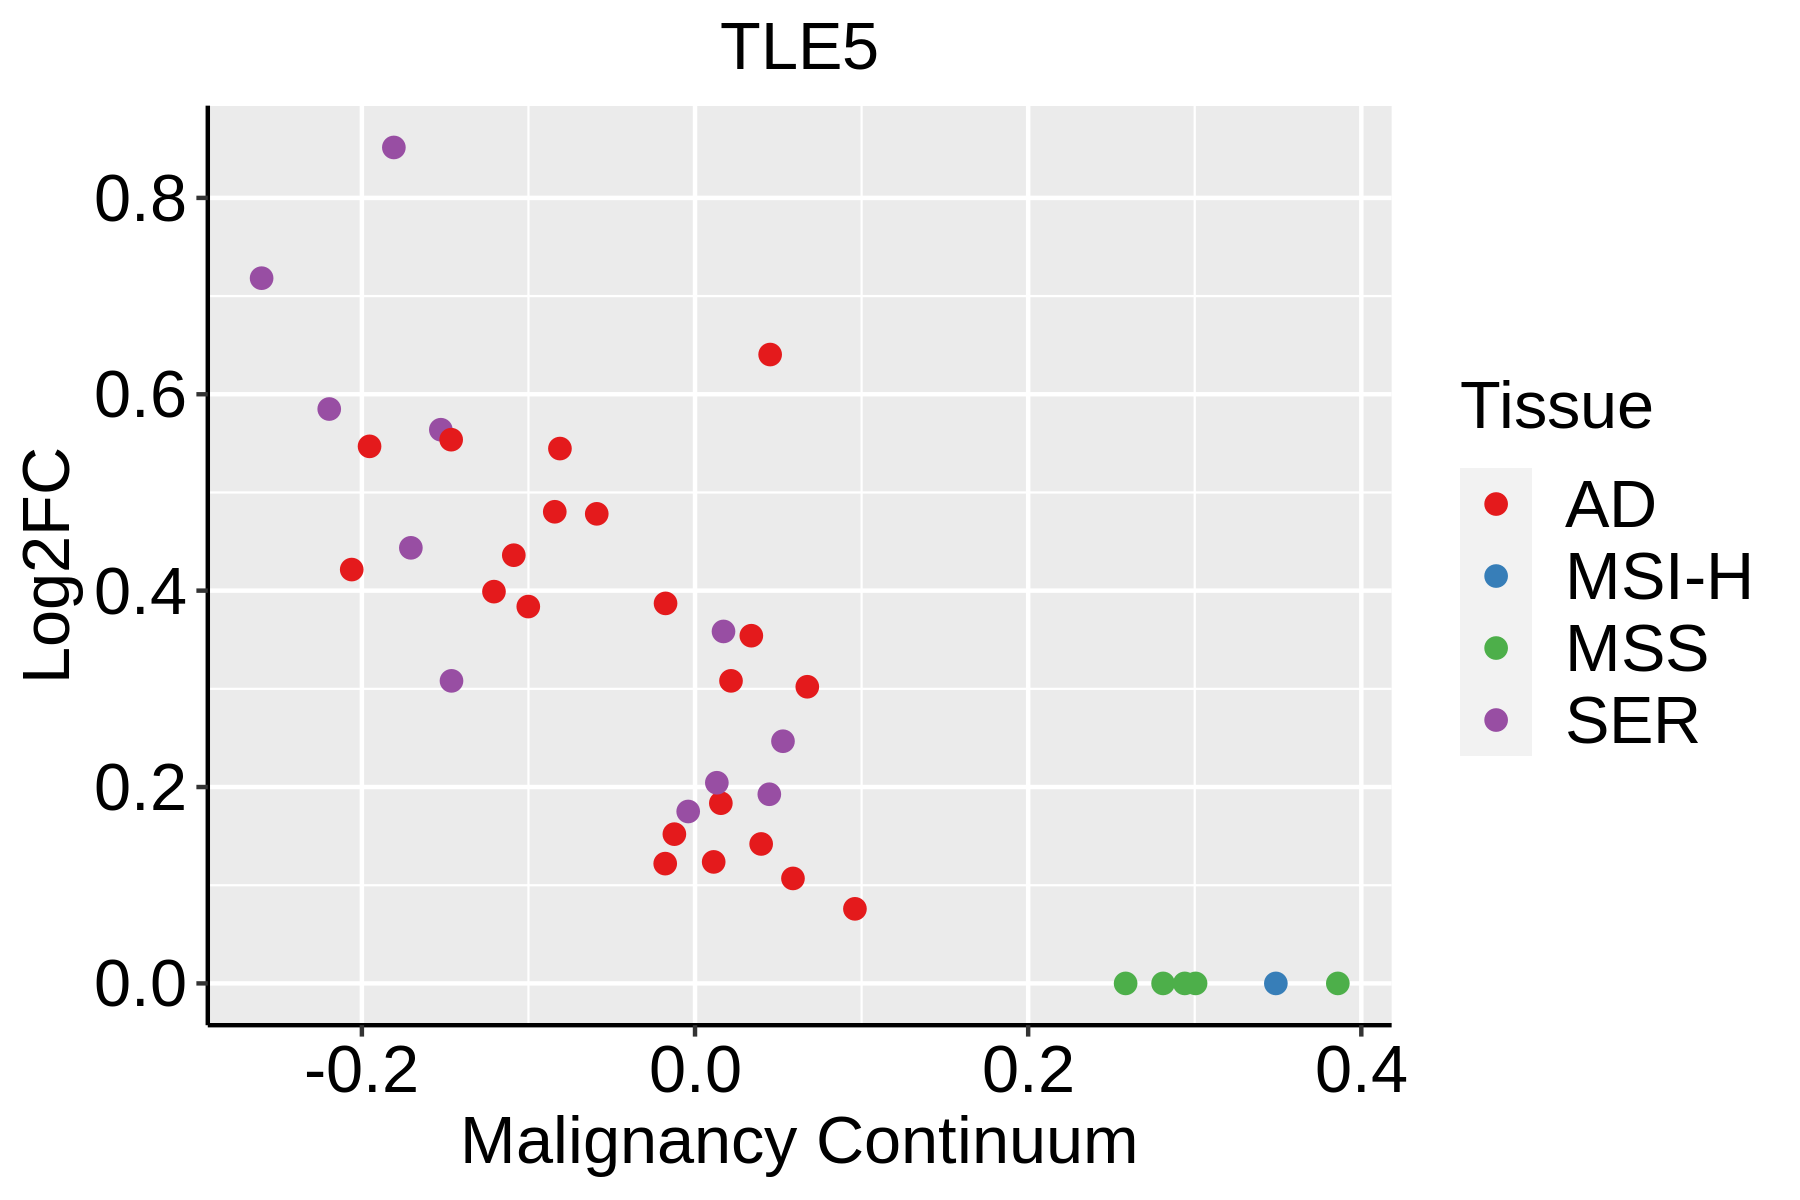 | AD: Adenomas |
| SER: Sessile serrated lesions | ||
| MSI-H: Microsatellite-high colorectal cancer | ||
| MSS: Microsatellite stable colorectal cancer | ||
| Endometrium |  | AEH: Atypical endometrial hyperplasia |
| EEC: Endometrioid Cancer | ||
| Esophagus | 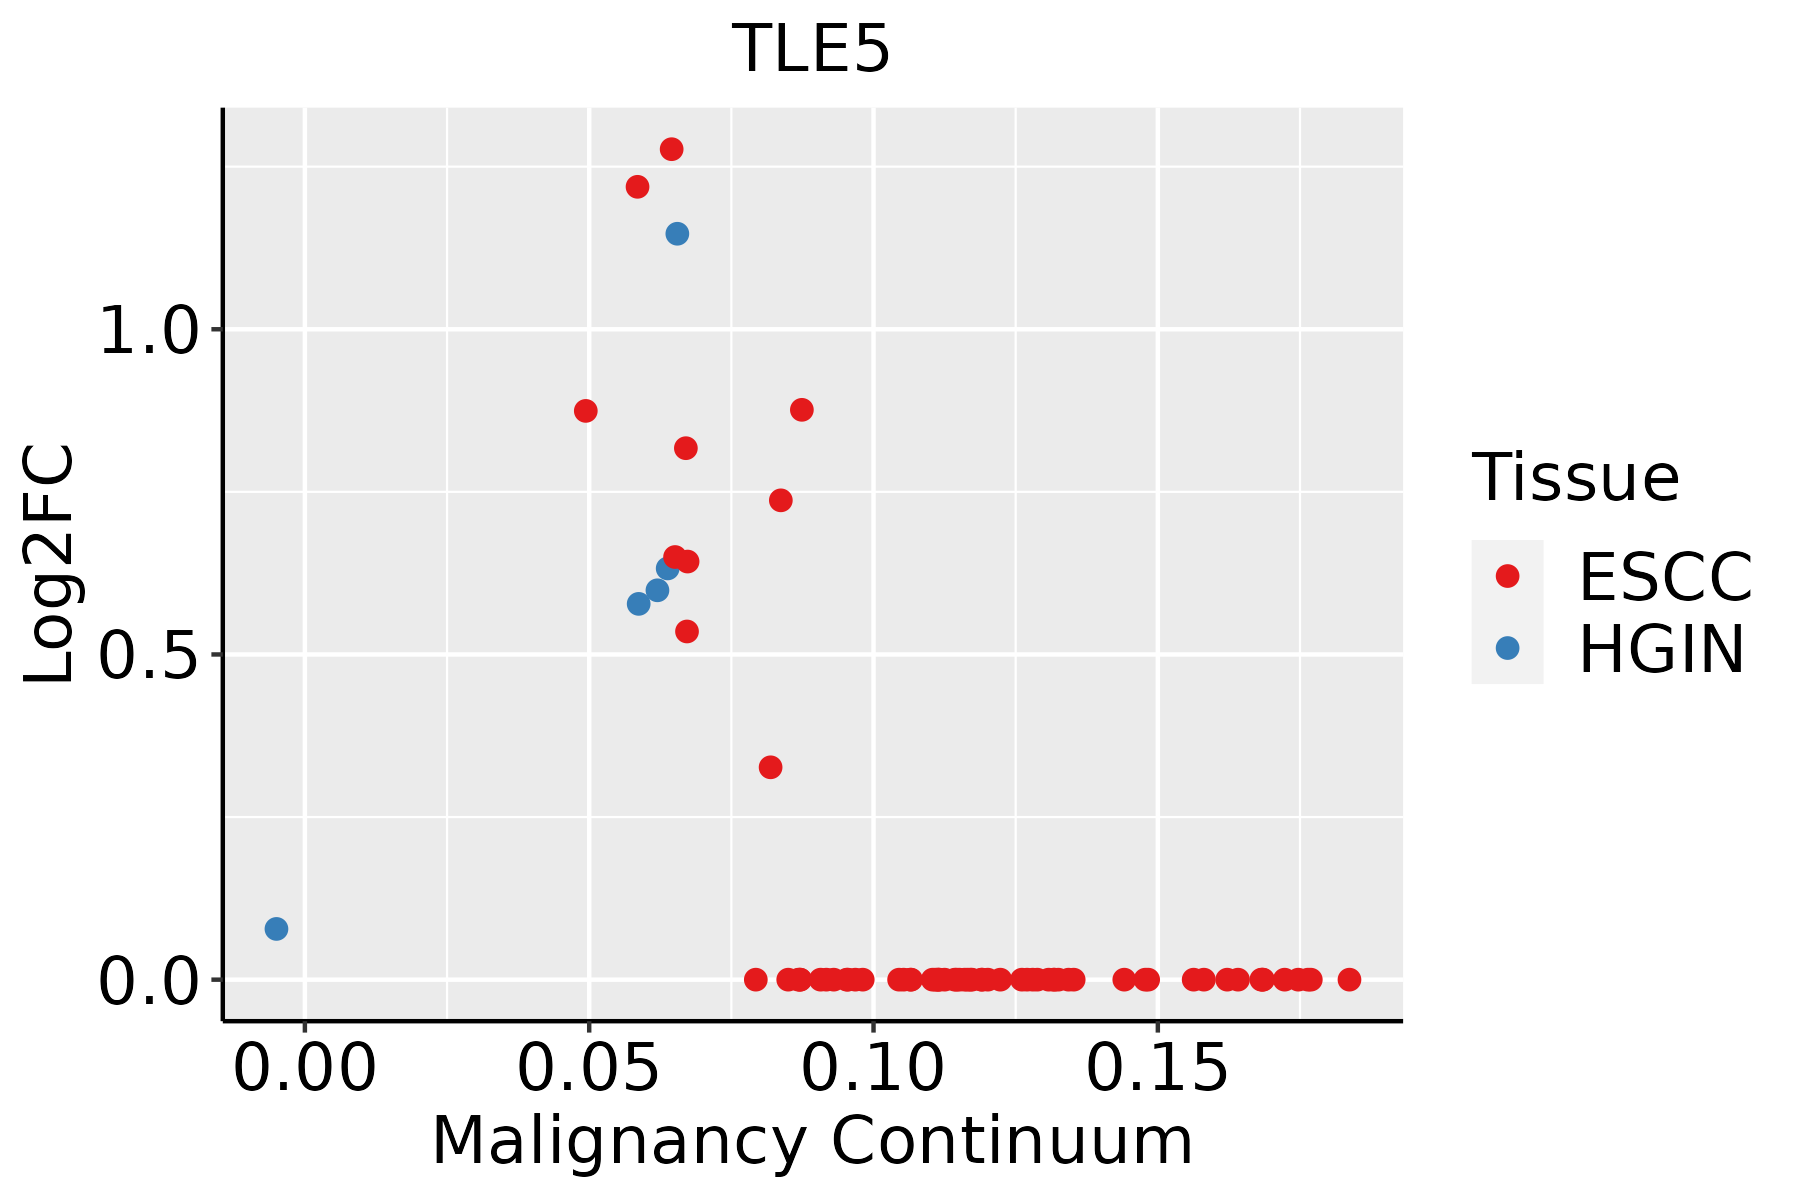 | ESCC: Esophageal squamous cell carcinoma |
| HGIN: High-grade intraepithelial neoplasias | ||
| LGIN: Low-grade intraepithelial neoplasias | ||
| GC | 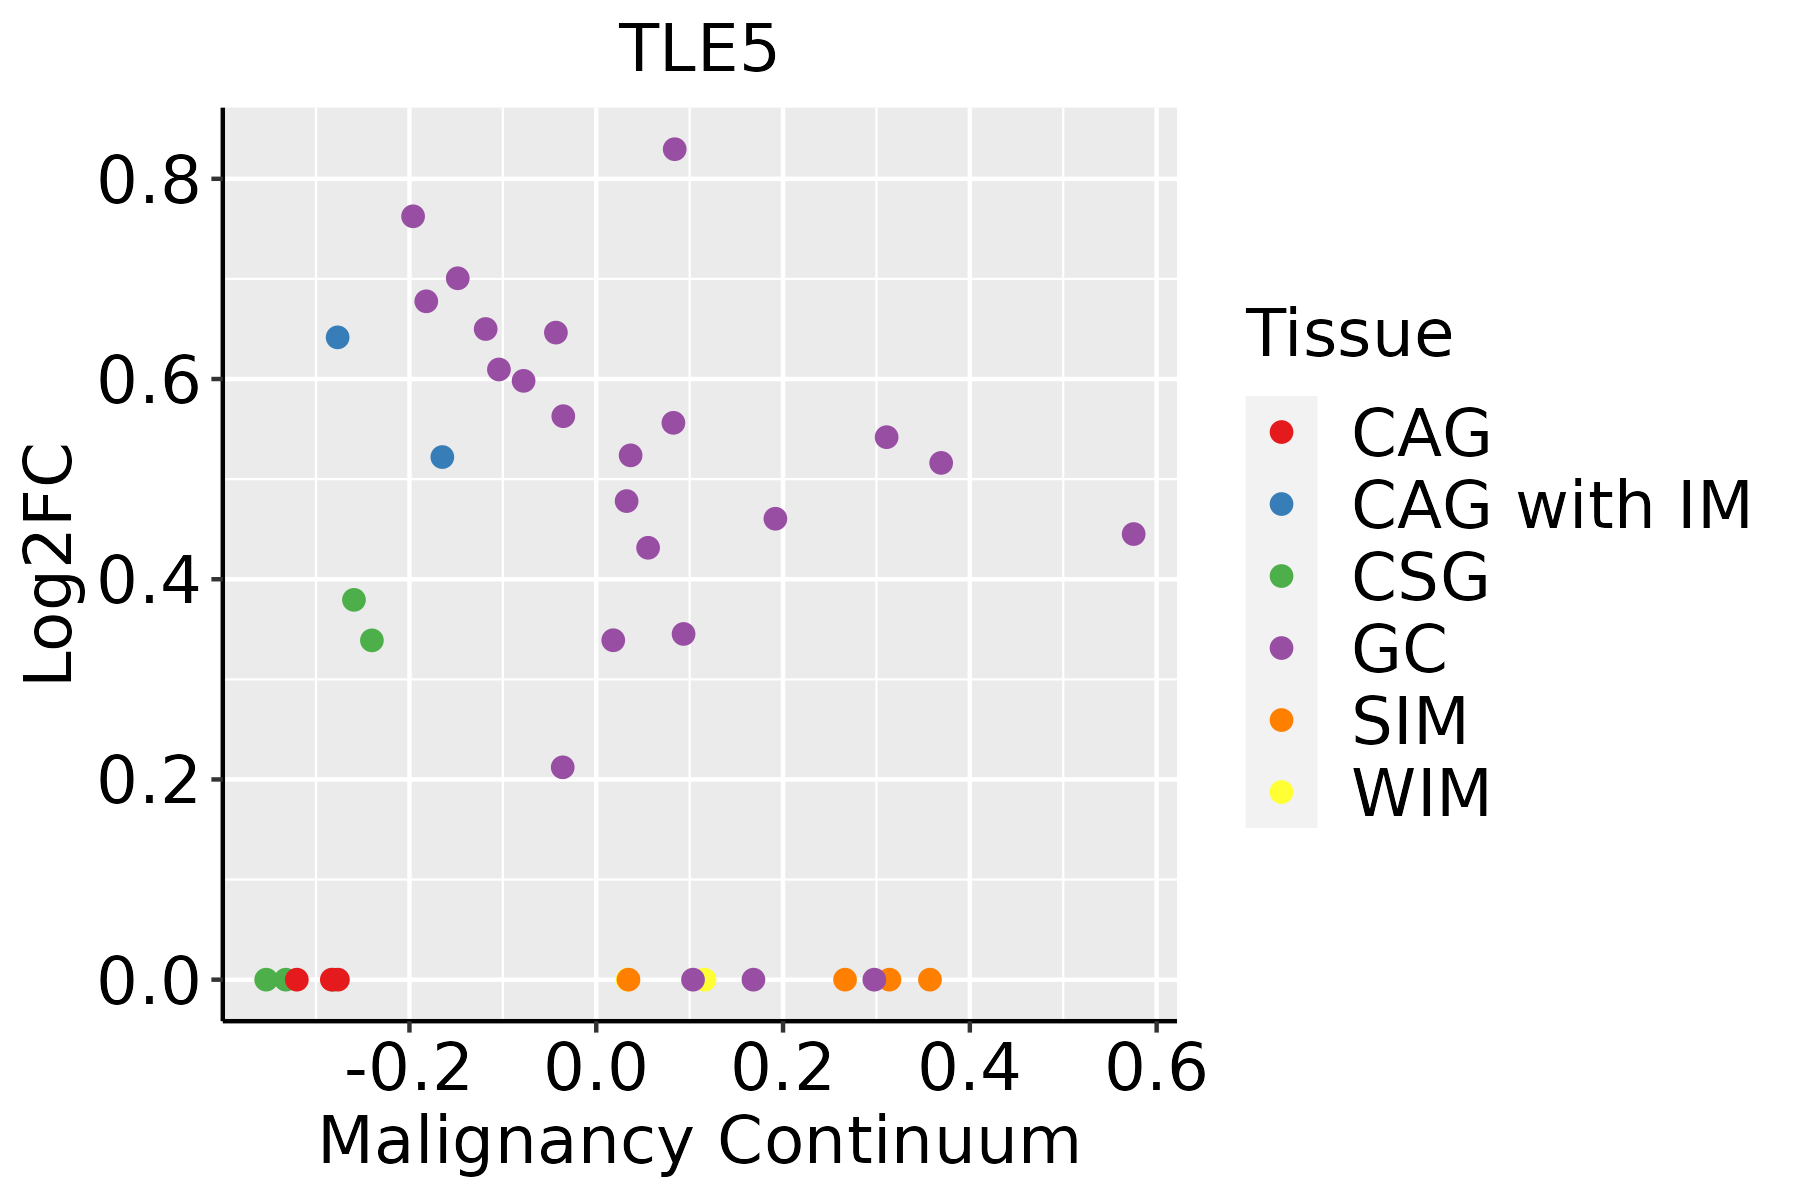 | CAG: Chronic atrophic gastritis |
| CAG with IM: Chronic atrophic gastritis with intestinal metaplasia | ||
| CSG: Chronic superficial gastritis | ||
| GC: Gastric cancer | ||
| SIM: Severe intestinal metaplasia | ||
| WIM: Wild intestinal metaplasia | ||
| Lung | 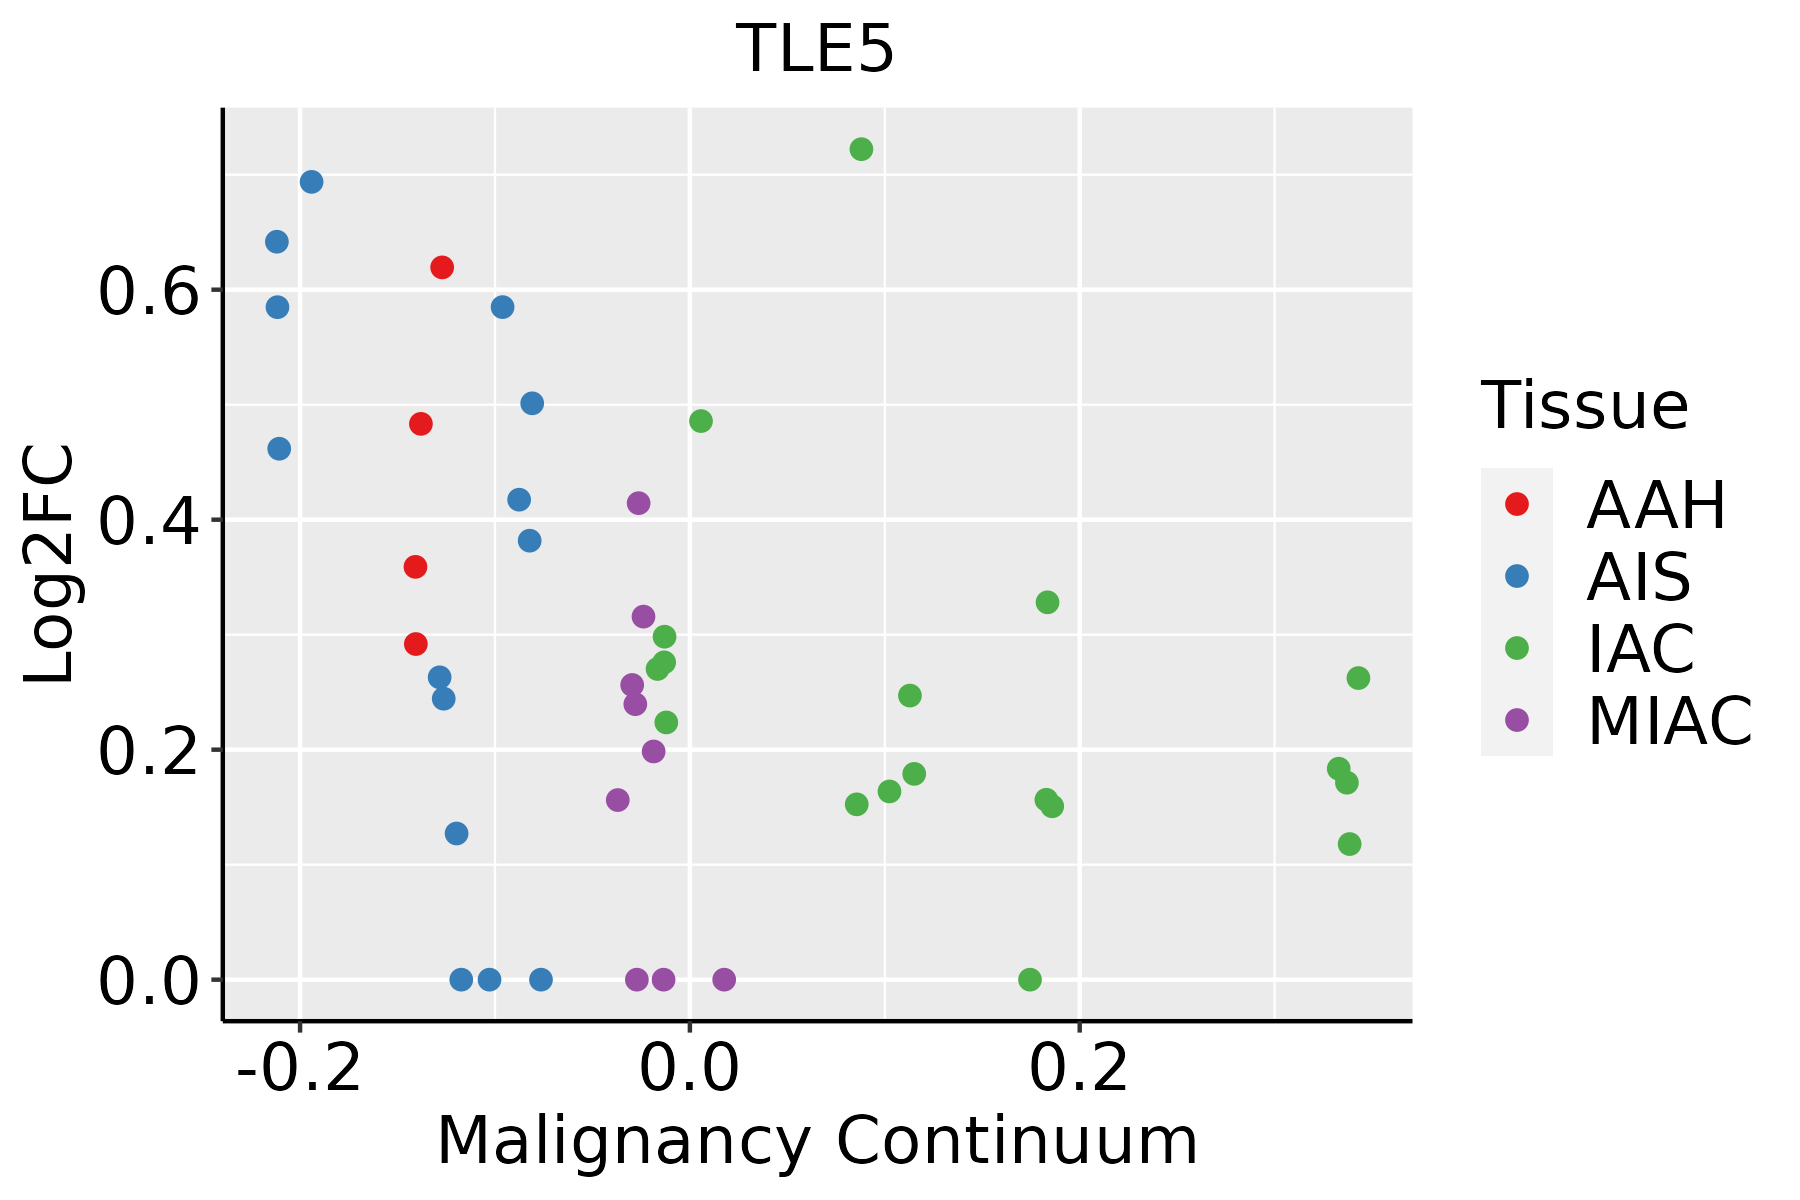 | AAH: Atypical adenomatous hyperplasia |
| AIS: Adenocarcinoma in situ | ||
| IAC: Invasive lung adenocarcinoma | ||
| MIA: Minimally invasive adenocarcinoma | ||
| Prostate |  | BPH: Benign Prostatic Hyperplasia |
| Skin | 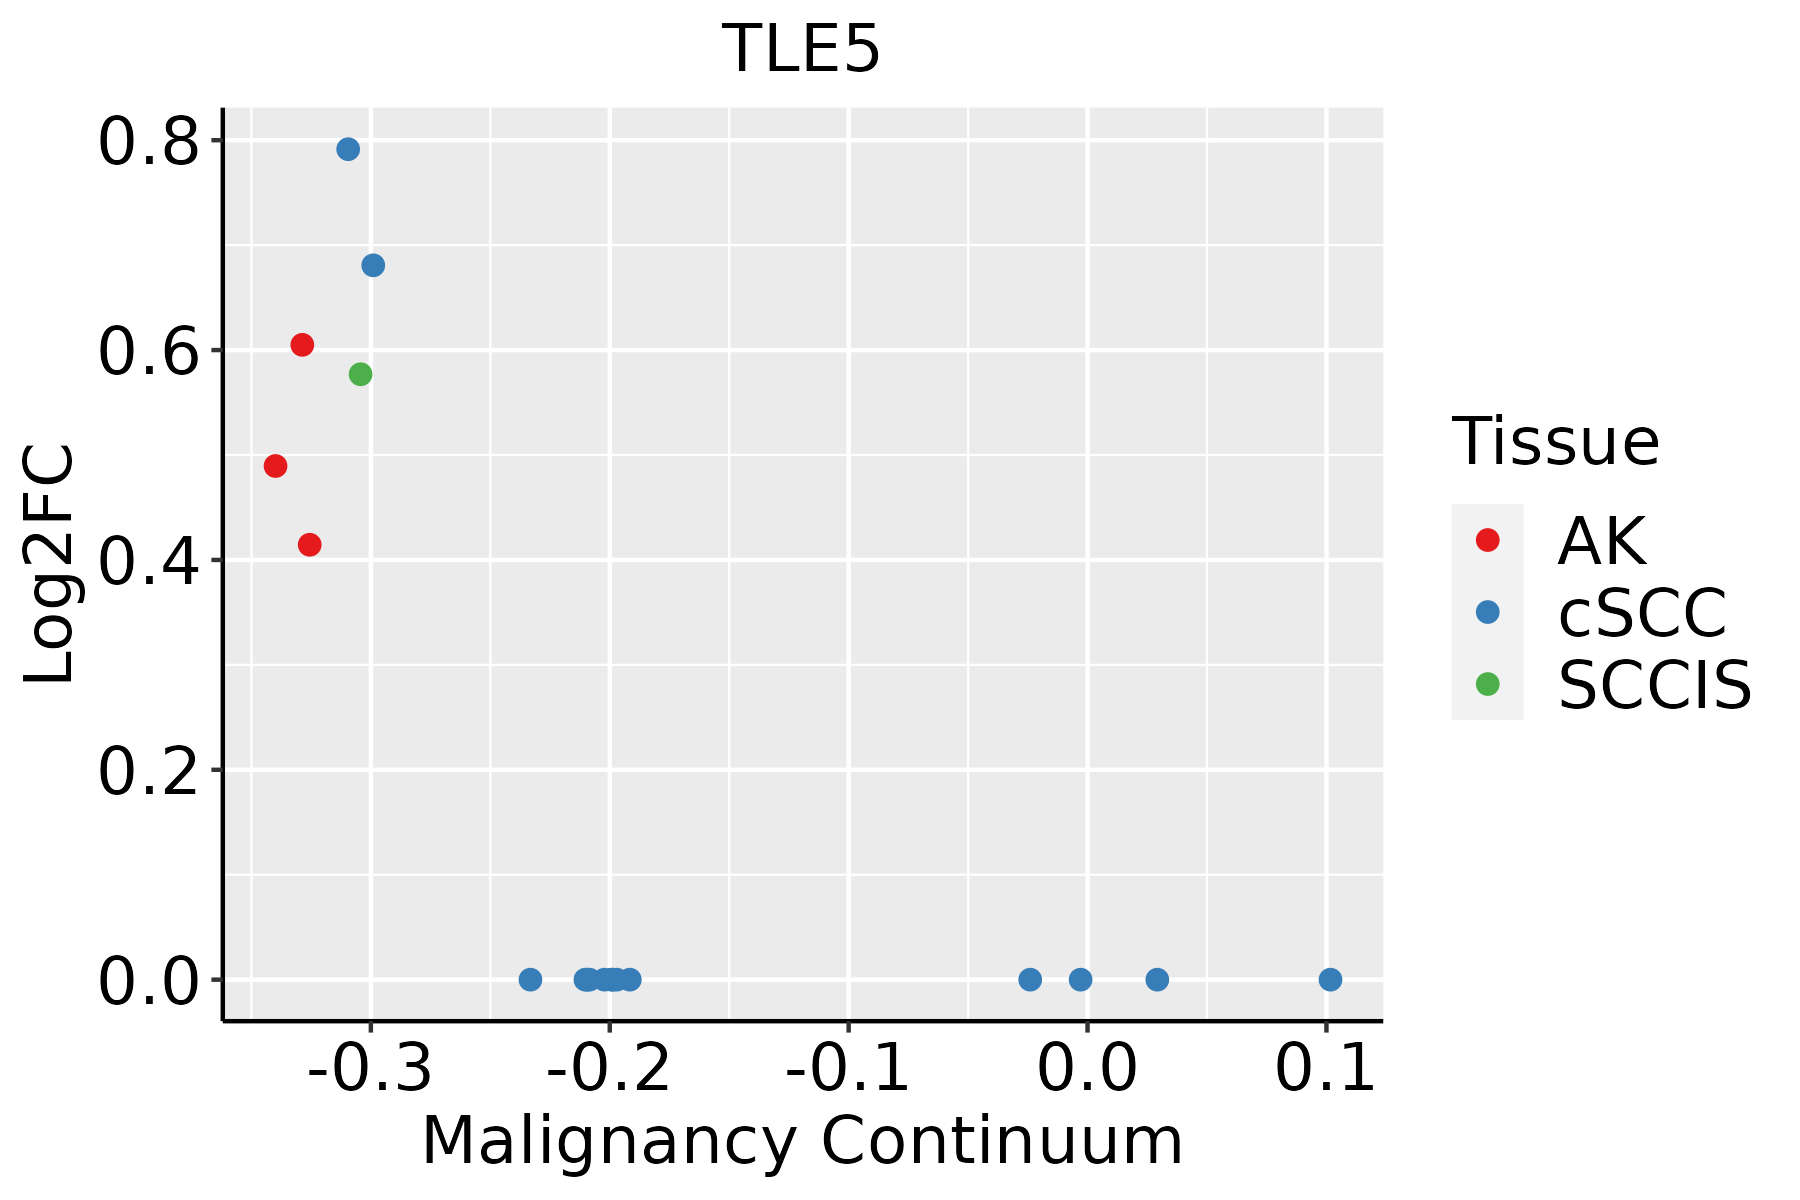 | AK: Actinic keratosis |
| cSCC: Cutaneous squamous cell carcinoma | ||
| SCCIS:squamous cell carcinoma in situ | ||
| Thyroid | 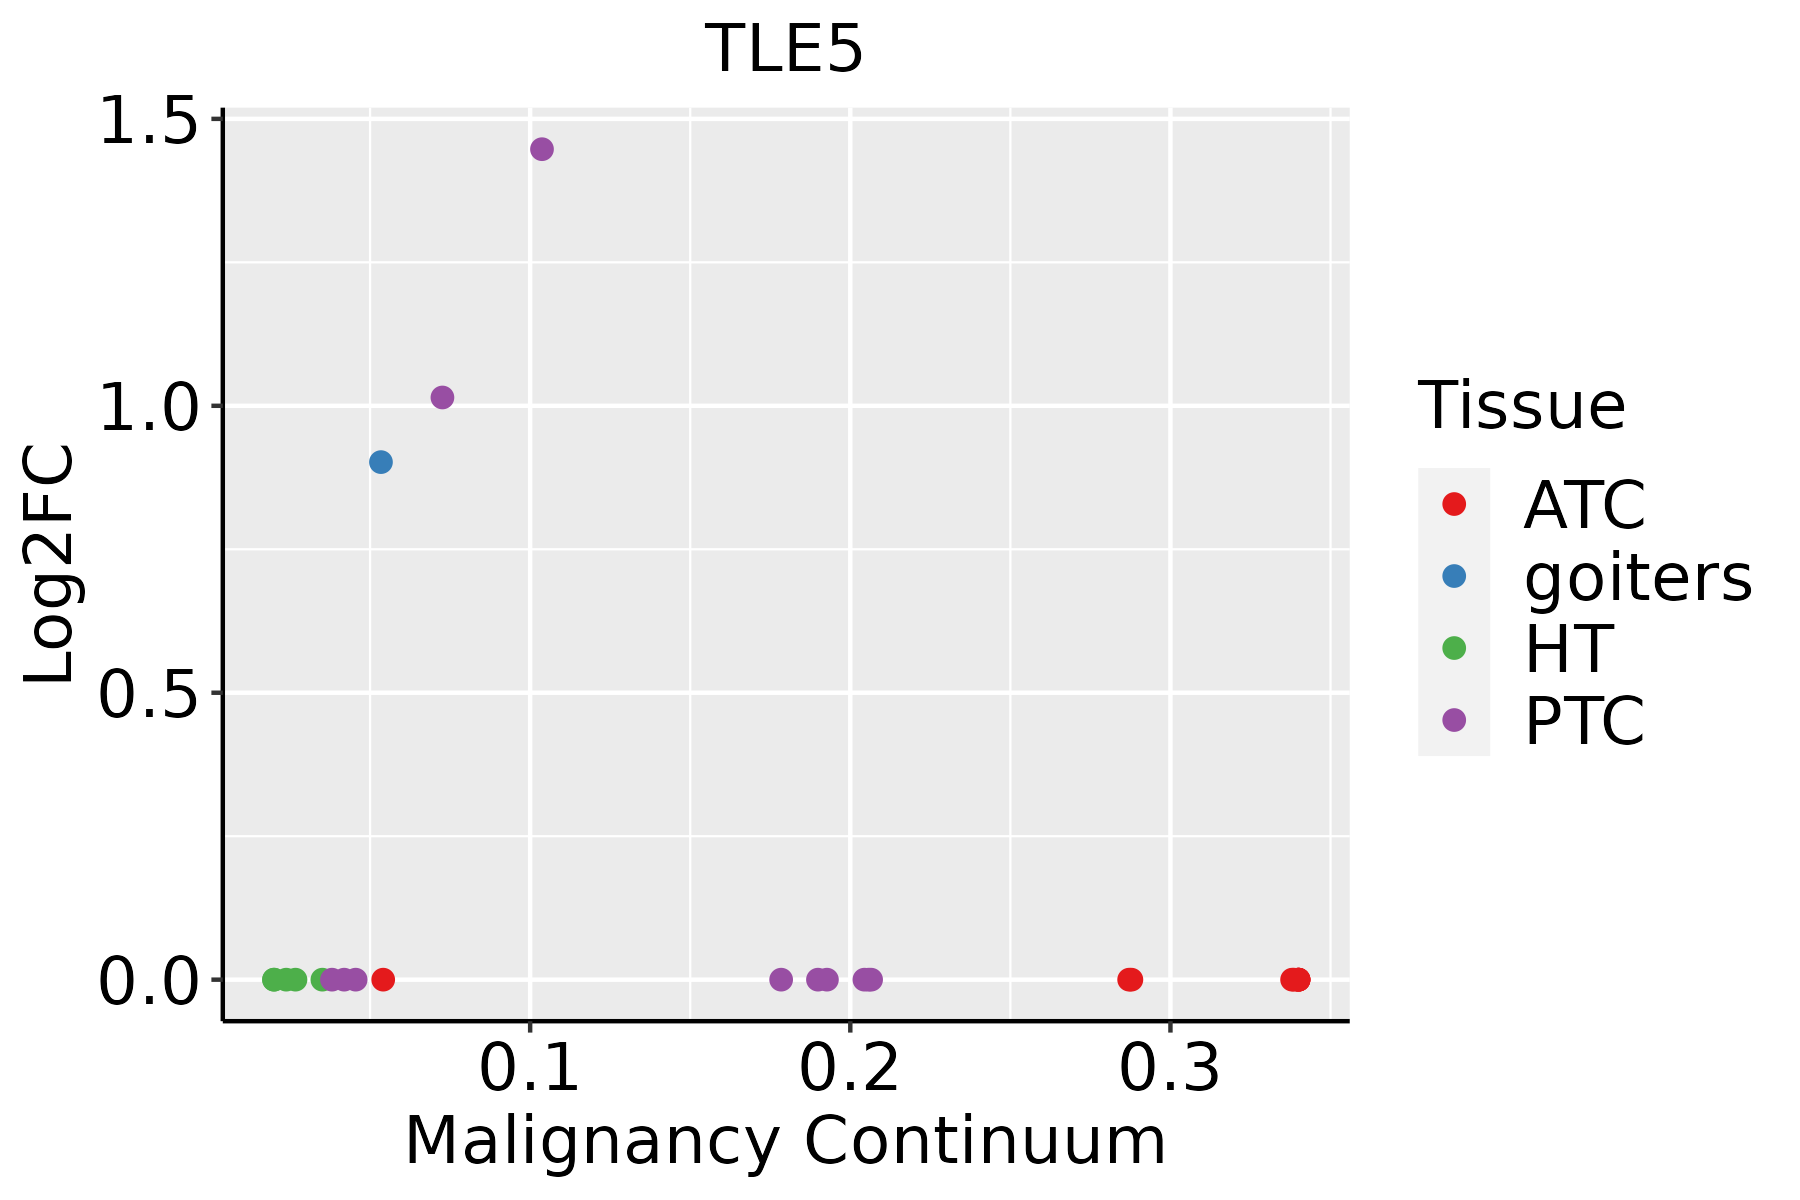 | ATC: Anaplastic thyroid cancer |
| HT: Hashimoto's thyroiditis | ||
| PTC: Papillary thyroid cancer |
| ∗log2FC in expression of this searched gene in stem-like cells from each diseased tissue sample relative to stem-like cells in normal samples in each tissue plotted against the malignancy continuum. Samples are colored based on if they are from different disease stage. |
Top |
Malignant transformation related pathway analysis |
| Find out the enriched GO biological processes and KEGG pathways involved in transition from healthy to precancer to cancer |
| Tissue | Disease Stage | Enriched GO biological Processes |
| Colorectum | AD |  |
| Colorectum | SER |  |
| Colorectum | MSS |  |
| Colorectum | MSI-H |  |
| Colorectum | FAP |  |
| ∗Top 15 enriched GO BP terms are showed in the bar plot of each disease state in each tissue. Each row represents a significant GO biological process which is colored according to the -log10(p.adjust). |
| Page: 1 2 3 4 5 6 7 8 9 |
| GO ID | Tissue | Disease Stage | Description | Gene Ratio | Bg Ratio | pvalue | p.adjust | Count |
| GO:007149610 | Cervix | CC | cellular response to external stimulus | 78/2311 | 320/18723 | 1.82e-09 | 1.98e-07 | 78 |
| GO:00160557 | Cervix | CC | Wnt signaling pathway | 98/2311 | 444/18723 | 4.82e-09 | 4.65e-07 | 98 |
| GO:01987387 | Cervix | CC | cell-cell signaling by wnt | 98/2311 | 446/18723 | 6.16e-09 | 5.58e-07 | 98 |
| GO:00301117 | Cervix | CC | regulation of Wnt signaling pathway | 76/2311 | 328/18723 | 3.05e-08 | 2.08e-06 | 76 |
| GO:005109810 | Cervix | CC | regulation of binding | 80/2311 | 363/18723 | 1.32e-07 | 6.42e-06 | 80 |
| GO:00316689 | Cervix | CC | cellular response to extracellular stimulus | 59/2311 | 246/18723 | 3.03e-07 | 1.24e-05 | 59 |
| GO:00608287 | Cervix | CC | regulation of canonical Wnt signaling pathway | 58/2311 | 253/18723 | 1.83e-06 | 5.89e-05 | 58 |
| GO:00600707 | Cervix | CC | canonical Wnt signaling pathway | 66/2311 | 303/18723 | 2.47e-06 | 7.35e-05 | 66 |
| GO:00433939 | Cervix | CC | regulation of protein binding | 42/2311 | 196/18723 | 2.27e-04 | 2.55e-03 | 42 |
| GO:00511009 | Cervix | CC | negative regulation of binding | 34/2311 | 162/18723 | 1.25e-03 | 1.00e-02 | 34 |
| GO:00301784 | Cervix | CC | negative regulation of Wnt signaling pathway | 35/2311 | 170/18723 | 1.52e-03 | 1.17e-02 | 35 |
| GO:00900901 | Cervix | CC | negative regulation of canonical Wnt signaling pathway | 29/2311 | 137/18723 | 2.40e-03 | 1.70e-02 | 29 |
| GO:00320916 | Cervix | CC | negative regulation of protein binding | 20/2311 | 94/18723 | 9.92e-03 | 4.86e-02 | 20 |
| GO:0051098 | Colorectum | AD | regulation of binding | 126/3918 | 363/18723 | 6.01e-10 | 4.88e-08 | 126 |
| GO:0043393 | Colorectum | AD | regulation of protein binding | 68/3918 | 196/18723 | 5.17e-06 | 1.34e-04 | 68 |
| GO:0030111 | Colorectum | AD | regulation of Wnt signaling pathway | 102/3918 | 328/18723 | 8.51e-06 | 2.03e-04 | 102 |
| GO:0016055 | Colorectum | AD | Wnt signaling pathway | 130/3918 | 444/18723 | 1.60e-05 | 3.37e-04 | 130 |
| GO:0198738 | Colorectum | AD | cell-cell signaling by wnt | 130/3918 | 446/18723 | 2.02e-05 | 4.10e-04 | 130 |
| GO:0060070 | Colorectum | AD | canonical Wnt signaling pathway | 90/3918 | 303/18723 | 1.76e-04 | 2.38e-03 | 90 |
| GO:0071496 | Colorectum | AD | cellular response to external stimulus | 94/3918 | 320/18723 | 1.98e-04 | 2.64e-03 | 94 |
| Page: 1 2 3 4 5 6 7 8 9 10 11 |
| Pathway ID | Tissue | Disease Stage | Description | Gene Ratio | Bg Ratio | pvalue | p.adjust | qvalue | Count |
| Page: 1 |
Top |
Cell-cell communication analysis |
| Identification of potential cell-cell interactions between two cell types and their ligand-receptor pairs for different disease states |
| Ligand | Receptor | LRpair | Pathway | Tissue | Disease Stage |
| Page: 1 |
Top |
Single-cell gene regulatory network inference analysis |
| Find out the significant the regulons (TFs) and the target genes of each regulon across cell types for different disease states |
| TF | Cell Type | Tissue | Disease Stage | Target Gene | RSS | Regulon Activity |
| ∗The dot plots of a searched regulon are shown for all cell subpopulations in each disease state of each tissue based on the regulon specific score inferred using pySCENIC and by calculating the average expression. |
| Page: 1 |
Top |
Somatic mutation of malignant transformation related genes |
| Annotation of somatic variants for genes involved in malignant transformation |
| Hugo Symbol | Variant Class | Variant Classification | dbSNP RS | HGVSc | HGVSp | HGVSp Short | SWISSPROT | BIOTYPE | SIFT | PolyPhen | Tumor Sample Barcode | Tissue | Histology | Sex | Age | Stage | Therapy Types | Drugs | Outcome |
| Page: 1 |
Top |
Related drugs of malignant transformation related genes |
| Identification of chemicals and drugs interact with genes involved in malignant transfromation |
| (DGIdb 4.0) |
| Entrez ID | Symbol | Category | Interaction Types | Drug Claim Name | Drug Name | PMIDs |
| Page: 1 |

Copyright 2023-Present -The University of Texas Health Science Center at Houston |