
|
|||||
|
 | |
| |
| |
| |
| |
| |
|
Gene: THOP1 |
Gene summary for THOP1 |
| Gene information | Species | Human | Gene symbol | THOP1 | Gene ID | 7064 |
| Gene name | thimet oligopeptidase 1 | |
| Gene Alias | EP24.15 | |
| Cytomap | 19p13.3 | |
| Gene Type | protein-coding | GO ID | GO:0000209 | UniProtAcc | P52888 |
Top |
Malignant transformation analysis |
| Identification of the aberrant gene expression in precancerous and cancerous lesions by comparing the gene expression of stem-like cells in diseased tissues with normal stem cells |
| Entrez ID | Symbol | Replicates | Species | Organ | Tissue | Adj P-value | Log2FC | Malignancy |
| 7064 | THOP1 | P24T-E | Human | Esophagus | ESCC | 9.67e-18 | 3.47e-01 | 0.1287 |
| 7064 | THOP1 | P26T-E | Human | Esophagus | ESCC | 8.90e-18 | 4.07e-01 | 0.1276 |
| 7064 | THOP1 | P27T-E | Human | Esophagus | ESCC | 8.08e-19 | 3.14e-01 | 0.1055 |
| 7064 | THOP1 | P28T-E | Human | Esophagus | ESCC | 1.05e-38 | 5.68e-01 | 0.1149 |
| 7064 | THOP1 | P30T-E | Human | Esophagus | ESCC | 7.86e-25 | 8.70e-01 | 0.137 |
| 7064 | THOP1 | P31T-E | Human | Esophagus | ESCC | 1.37e-13 | 3.30e-01 | 0.1251 |
| 7064 | THOP1 | P32T-E | Human | Esophagus | ESCC | 1.43e-42 | 7.58e-01 | 0.1666 |
| 7064 | THOP1 | P36T-E | Human | Esophagus | ESCC | 3.05e-05 | 2.67e-01 | 0.1187 |
| 7064 | THOP1 | P37T-E | Human | Esophagus | ESCC | 4.58e-14 | 3.18e-01 | 0.1371 |
| 7064 | THOP1 | P38T-E | Human | Esophagus | ESCC | 2.94e-05 | 2.52e-01 | 0.127 |
| 7064 | THOP1 | P39T-E | Human | Esophagus | ESCC | 2.20e-17 | 3.14e-01 | 0.0894 |
| 7064 | THOP1 | P40T-E | Human | Esophagus | ESCC | 4.24e-07 | 2.92e-01 | 0.109 |
| 7064 | THOP1 | P42T-E | Human | Esophagus | ESCC | 6.15e-14 | 3.61e-01 | 0.1175 |
| 7064 | THOP1 | P44T-E | Human | Esophagus | ESCC | 2.41e-03 | 1.56e-01 | 0.1096 |
| 7064 | THOP1 | P47T-E | Human | Esophagus | ESCC | 8.40e-04 | 1.11e-01 | 0.1067 |
| 7064 | THOP1 | P48T-E | Human | Esophagus | ESCC | 9.67e-18 | 2.92e-01 | 0.0959 |
| 7064 | THOP1 | P49T-E | Human | Esophagus | ESCC | 2.34e-06 | 6.72e-01 | 0.1768 |
| 7064 | THOP1 | P52T-E | Human | Esophagus | ESCC | 6.76e-78 | 1.46e+00 | 0.1555 |
| 7064 | THOP1 | P54T-E | Human | Esophagus | ESCC | 2.28e-11 | 3.34e-01 | 0.0975 |
| 7064 | THOP1 | P56T-E | Human | Esophagus | ESCC | 1.41e-04 | 5.77e-01 | 0.1613 |
| Page: 1 2 3 4 5 |
| Tissue | Expression Dynamics | Abbreviation |
| Esophagus | 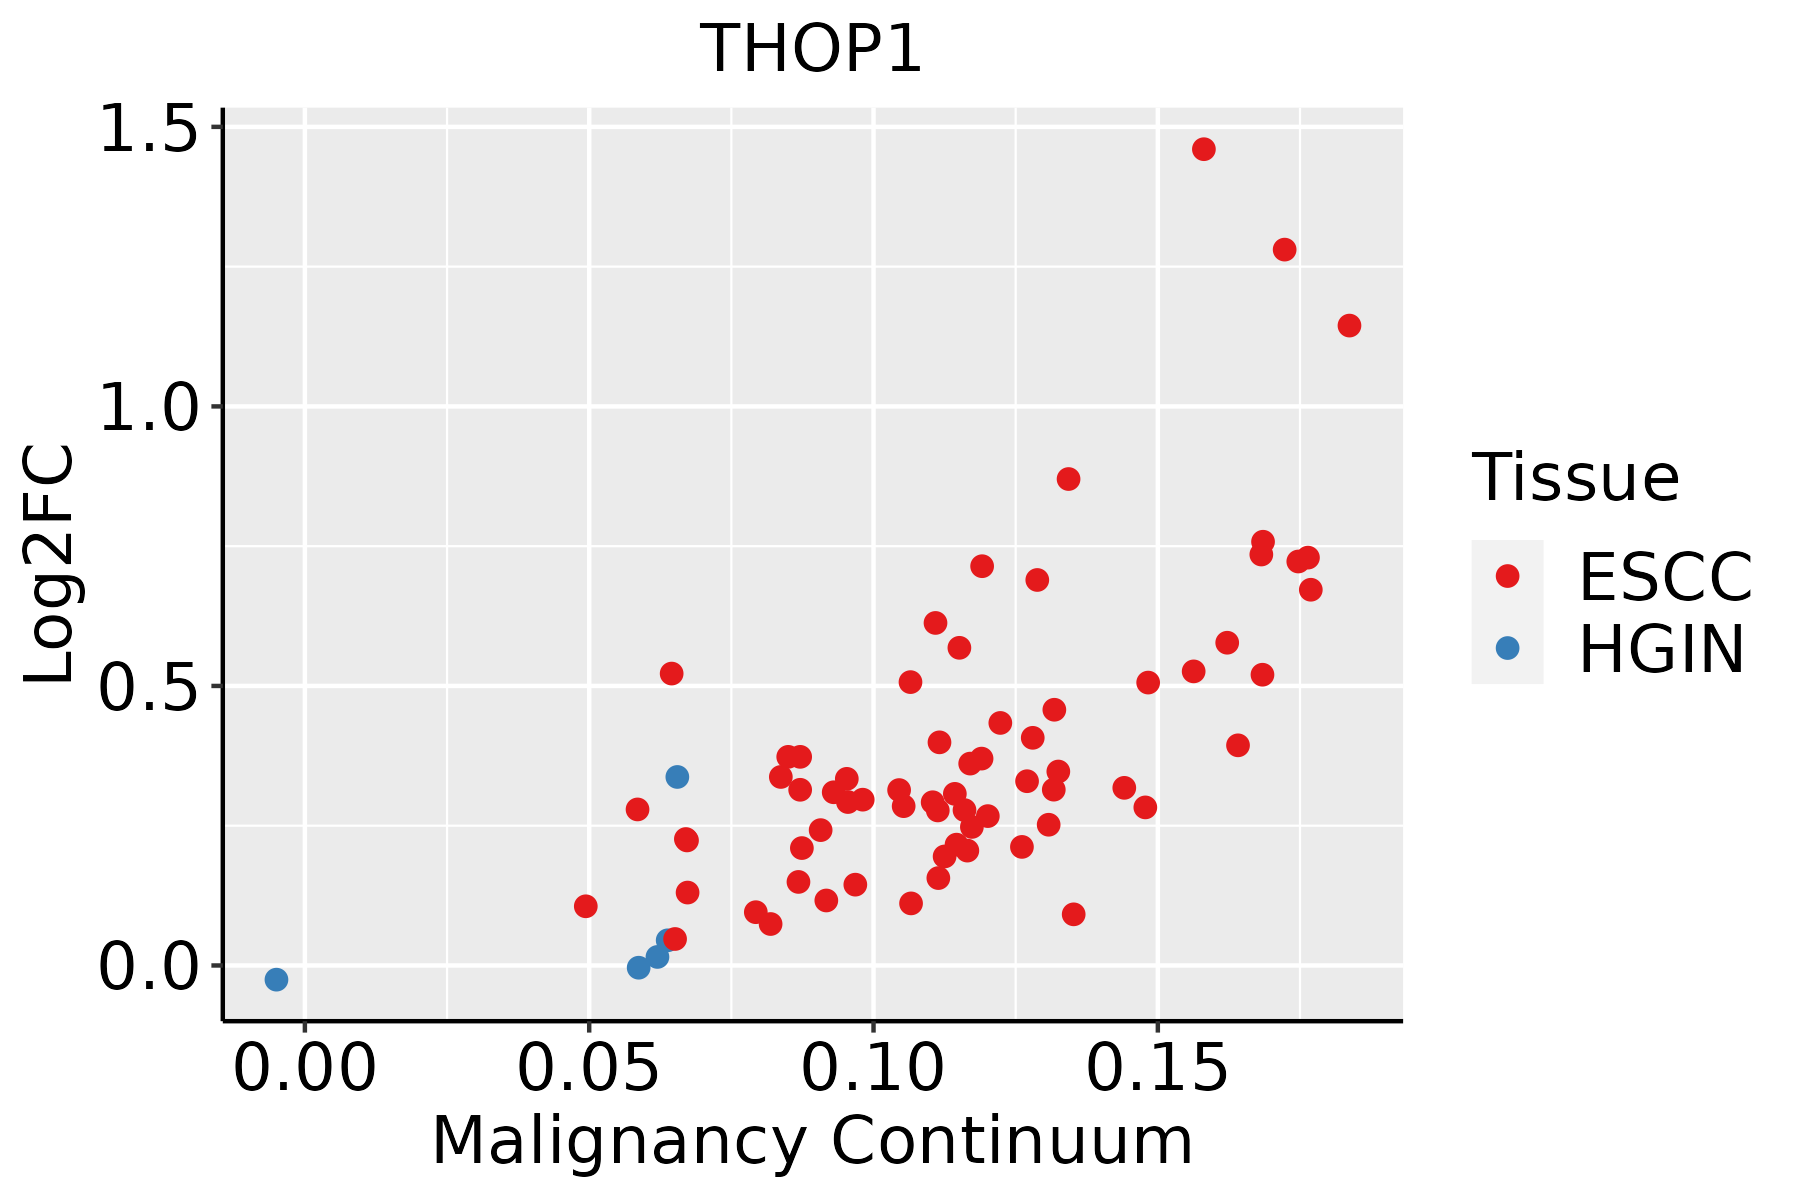 | ESCC: Esophageal squamous cell carcinoma |
| HGIN: High-grade intraepithelial neoplasias | ||
| LGIN: Low-grade intraepithelial neoplasias | ||
| Liver |  | HCC: Hepatocellular carcinoma |
| NAFLD: Non-alcoholic fatty liver disease | ||
| Oral Cavity | 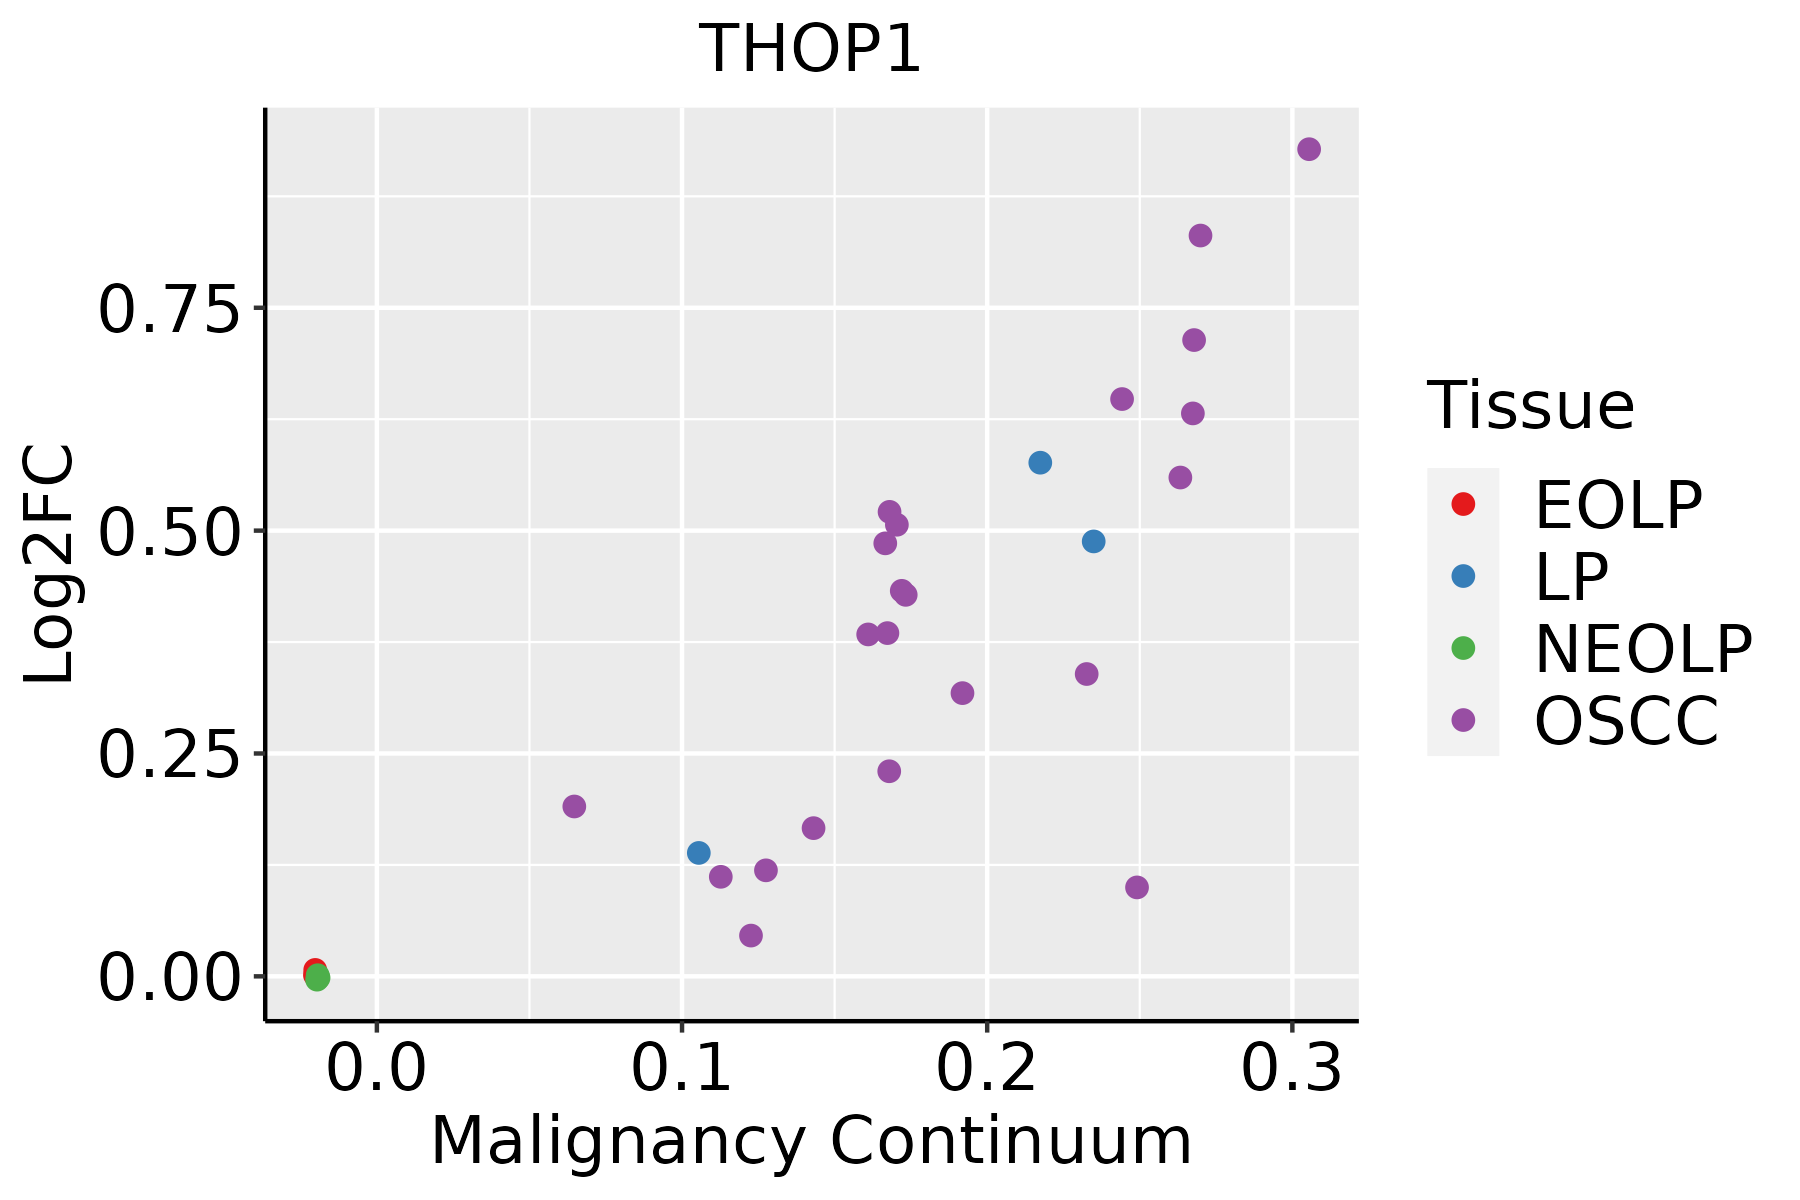 | EOLP: Erosive Oral lichen planus |
| LP: leukoplakia | ||
| NEOLP: Non-erosive oral lichen planus | ||
| OSCC: Oral squamous cell carcinoma | ||
| Skin | 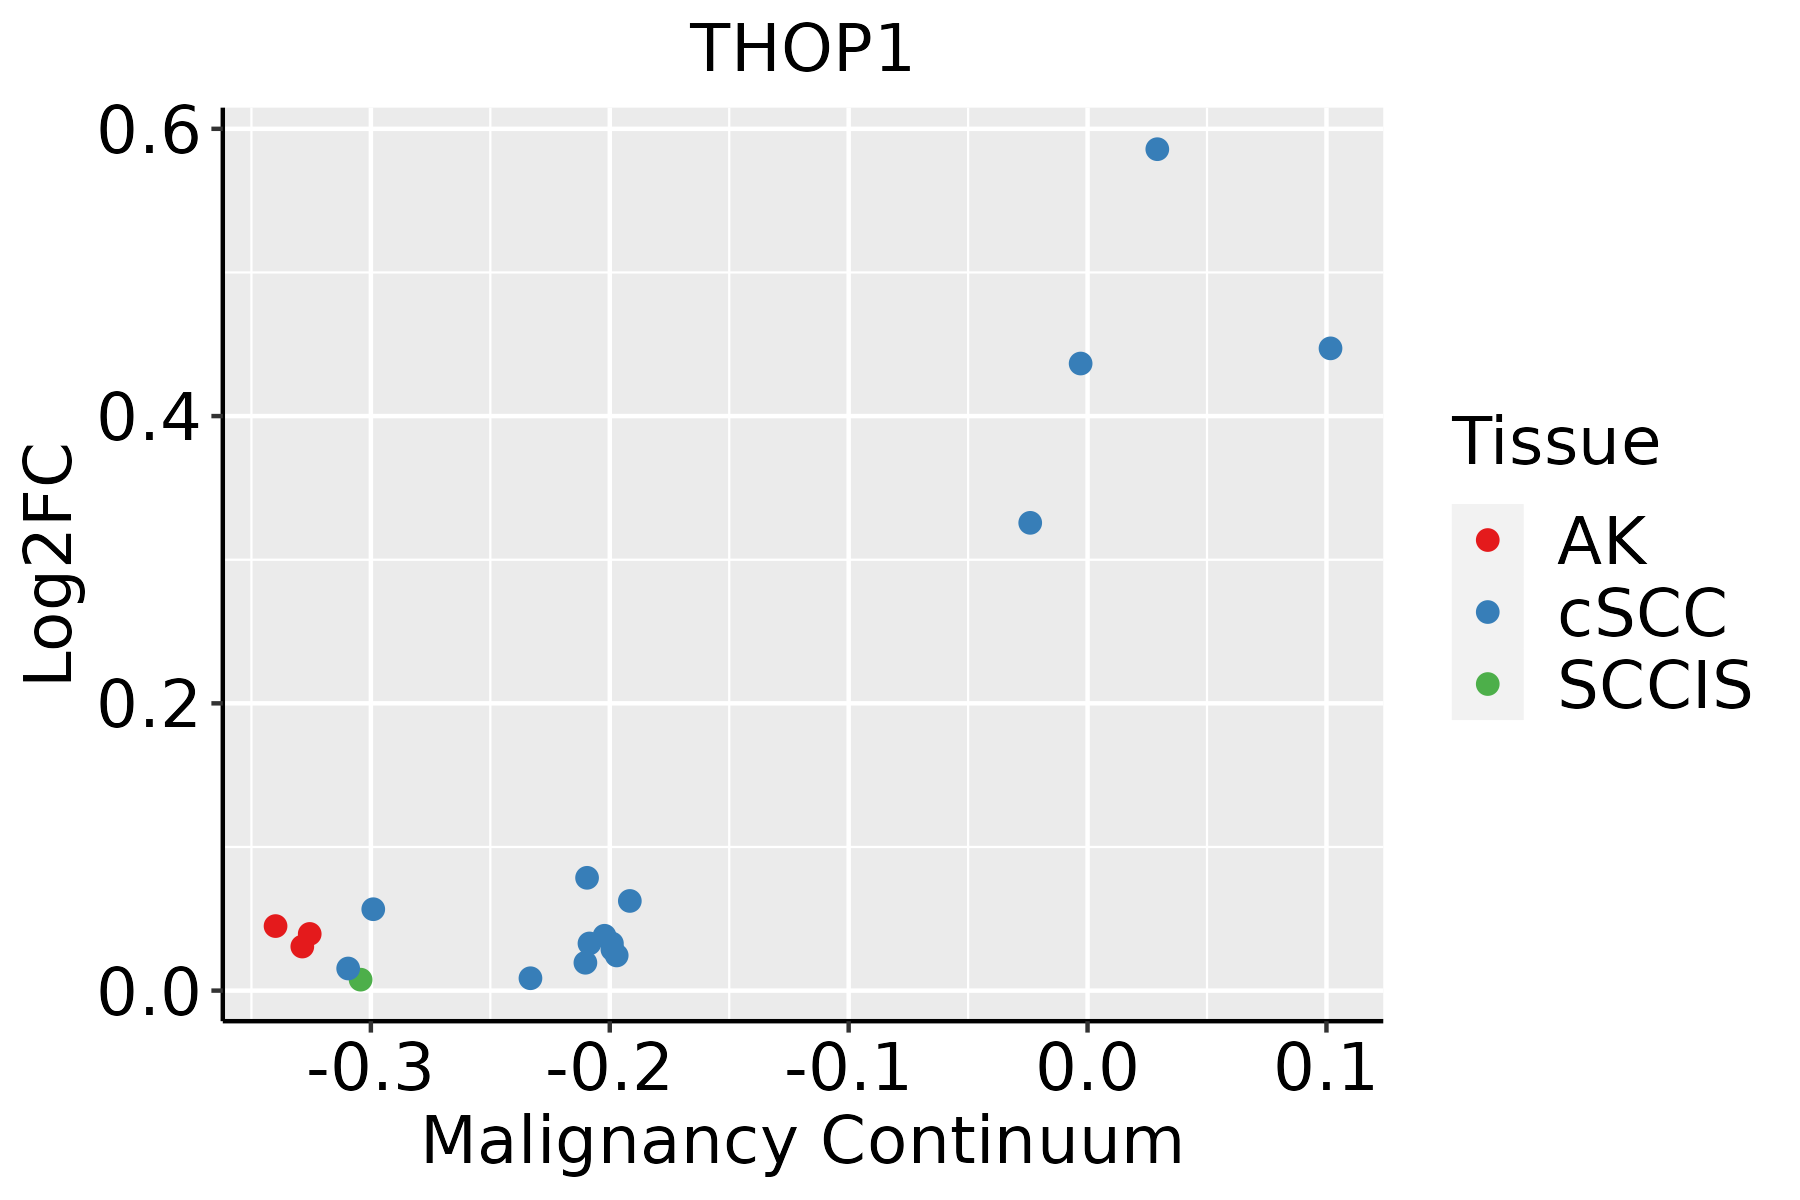 | AK: Actinic keratosis |
| cSCC: Cutaneous squamous cell carcinoma | ||
| SCCIS:squamous cell carcinoma in situ |
| ∗log2FC in expression of this searched gene in stem-like cells from each diseased tissue sample relative to stem-like cells in normal samples in each tissue plotted against the malignancy continuum. Samples are colored based on if they are from different disease stage. |
Top |
Malignant transformation related pathway analysis |
| Find out the enriched GO biological processes and KEGG pathways involved in transition from healthy to precancer to cancer |
| Tissue | Disease Stage | Enriched GO biological Processes |
| Colorectum | AD |  |
| Colorectum | SER |  |
| Colorectum | MSS |  |
| Colorectum | MSI-H |  |
| Colorectum | FAP |  |
| ∗Top 15 enriched GO BP terms are showed in the bar plot of each disease state in each tissue. Each row represents a significant GO biological process which is colored according to the -log10(p.adjust). |
| Page: 1 2 3 4 5 6 7 8 9 |
| GO ID | Tissue | Disease Stage | Description | Gene Ratio | Bg Ratio | pvalue | p.adjust | Count |
| GO:000020917 | Esophagus | ESCC | protein polyubiquitination | 170/8552 | 236/18723 | 1.40e-16 | 1.09e-14 | 170 |
| GO:000020921 | Liver | HCC | protein polyubiquitination | 151/7958 | 236/18723 | 1.90e-11 | 7.59e-10 | 151 |
| GO:000020910 | Oral cavity | OSCC | protein polyubiquitination | 150/7305 | 236/18723 | 1.59e-14 | 9.27e-13 | 150 |
| GO:000020915 | Oral cavity | LP | protein polyubiquitination | 82/4623 | 236/18723 | 3.23e-04 | 3.26e-03 | 82 |
| GO:000020924 | Skin | cSCC | protein polyubiquitination | 103/4864 | 236/18723 | 2.57e-09 | 9.09e-08 | 103 |
| Page: 1 |
| Pathway ID | Tissue | Disease Stage | Description | Gene Ratio | Bg Ratio | pvalue | p.adjust | qvalue | Count |
| Page: 1 |
Top |
Cell-cell communication analysis |
| Identification of potential cell-cell interactions between two cell types and their ligand-receptor pairs for different disease states |
| Ligand | Receptor | LRpair | Pathway | Tissue | Disease Stage |
| Page: 1 |
Top |
Single-cell gene regulatory network inference analysis |
| Find out the significant the regulons (TFs) and the target genes of each regulon across cell types for different disease states |
| TF | Cell Type | Tissue | Disease Stage | Target Gene | RSS | Regulon Activity |
| ∗The dot plots of a searched regulon are shown for all cell subpopulations in each disease state of each tissue based on the regulon specific score inferred using pySCENIC and by calculating the average expression. |
| Page: 1 |
Top |
Somatic mutation of malignant transformation related genes |
| Annotation of somatic variants for genes involved in malignant transformation |
| Hugo Symbol | Variant Class | Variant Classification | dbSNP RS | HGVSc | HGVSp | HGVSp Short | SWISSPROT | BIOTYPE | SIFT | PolyPhen | Tumor Sample Barcode | Tissue | Histology | Sex | Age | Stage | Therapy Types | Drugs | Outcome |
| THOP1 | SNV | Missense_Mutation | c.507N>C | p.Lys169Asn | p.K169N | P52888 | protein_coding | tolerated(0.08) | benign(0.125) | TCGA-AC-A23H-01 | Breast | breast invasive carcinoma | Female | >=65 | I/II | Unknown | Unknown | PD | |
| THOP1 | SNV | Missense_Mutation | rs527473166 | c.1102N>A | p.Gly368Arg | p.G368R | P52888 | protein_coding | deleterious(0) | probably_damaging(0.997) | TCGA-BH-A0E9-01 | Breast | breast invasive carcinoma | Female | <65 | I/II | Chemotherapy | taxotere | CR |
| THOP1 | SNV | Missense_Mutation | c.1784C>T | p.Pro595Leu | p.P595L | P52888 | protein_coding | tolerated(0.09) | benign(0.403) | TCGA-BH-A1EW-01 | Breast | breast invasive carcinoma | Female | <65 | I/II | Unknown | Unknown | PD | |
| THOP1 | insertion | In_Frame_Ins | novel | c.355_356insTGGGGTTTC | p.Tyr119delinsLeuGlyPheHis | p.Y119delinsLGFH | P52888 | protein_coding | TCGA-BH-A0E2-01 | Breast | breast invasive carcinoma | Female | <65 | III/IV | Chemotherapy | doxorubicin | SD | ||
| THOP1 | insertion | In_Frame_Ins | novel | c.356_357insCCTTGTTGG | p.Tyr119_Gln120insLeuValGly | p.Y119_Q120insLVG | P52888 | protein_coding | TCGA-BH-A0E2-01 | Breast | breast invasive carcinoma | Female | <65 | III/IV | Chemotherapy | doxorubicin | SD | ||
| THOP1 | SNV | Missense_Mutation | rs374219260 | c.200N>T | p.Ala67Val | p.A67V | P52888 | protein_coding | tolerated(0.24) | benign(0.019) | TCGA-2W-A8YY-01 | Cervix | cervical & endocervical cancer | Female | <65 | I/II | Chemotherapy | cisplatin | CR |
| THOP1 | SNV | Missense_Mutation | c.234N>C | p.Gln78His | p.Q78H | P52888 | protein_coding | deleterious(0.04) | benign(0.372) | TCGA-DG-A2KK-01 | Cervix | cervical & endocervical cancer | Female | <65 | III/IV | Chemotherapy | cisplatin | SD | |
| THOP1 | SNV | Missense_Mutation | novel | c.1405N>A | p.Glu469Lys | p.E469K | P52888 | protein_coding | tolerated(0.19) | benign(0.206) | TCGA-IR-A3LF-01 | Cervix | cervical & endocervical cancer | Female | <65 | I/II | Unknown | Unknown | SD |
| THOP1 | SNV | Missense_Mutation | novel | c.1504N>A | p.Glu502Lys | p.E502K | P52888 | protein_coding | deleterious(0) | possibly_damaging(0.614) | TCGA-VS-A959-01 | Cervix | cervical & endocervical cancer | Female | >=65 | I/II | Unknown | Unknown | SD |
| THOP1 | SNV | Missense_Mutation | rs199648840 | c.740N>A | p.Arg247Gln | p.R247Q | P52888 | protein_coding | deleterious(0.03) | probably_damaging(1) | TCGA-A6-6653-01 | Colorectum | colon adenocarcinoma | Male | >=65 | I/II | Unknown | Unknown | SD |
| Page: 1 2 3 4 5 6 7 8 |
Top |
Related drugs of malignant transformation related genes |
| Identification of chemicals and drugs interact with genes involved in malignant transfromation |
| (DGIdb 4.0) |
| Entrez ID | Symbol | Category | Interaction Types | Drug Claim Name | Drug Name | PMIDs |
| 7064 | THOP1 | DRUGGABLE GENOME, PROTEASE | Karenitecin | KARENITECIN | ||
| 7064 | THOP1 | DRUGGABLE GENOME, PROTEASE | Icofungipen | ICOFUNGIPEN | ||
| 7064 | THOP1 | DRUGGABLE GENOME, PROTEASE | Nemonoxacin | NEMONOXACIN |
| Page: 1 |

Copyright 2023-Present -The University of Texas Health Science Center at Houston |