
|
|||||
|
 | |
| |
| |
| |
| |
| |
|
Gene: TCTA |
Gene summary for TCTA |
| Gene information | Species | Human | Gene symbol | TCTA | Gene ID | 6988 |
| Gene name | T cell leukemia translocation altered | |
| Gene Alias | TCTA | |
| Cytomap | 3p21.31 | |
| Gene Type | protein-coding | GO ID | GO:0000768 | UniProtAcc | P57738 |
Top |
Malignant transformation analysis |
| Identification of the aberrant gene expression in precancerous and cancerous lesions by comparing the gene expression of stem-like cells in diseased tissues with normal stem cells |
| Entrez ID | Symbol | Replicates | Species | Organ | Tissue | Adj P-value | Log2FC | Malignancy |
| 6988 | TCTA | P20T-E | Human | Esophagus | ESCC | 5.38e-10 | 2.59e-01 | 0.1124 |
| 6988 | TCTA | P21T-E | Human | Esophagus | ESCC | 5.25e-33 | 6.51e-01 | 0.1617 |
| 6988 | TCTA | P22T-E | Human | Esophagus | ESCC | 1.66e-21 | 4.11e-01 | 0.1236 |
| 6988 | TCTA | P23T-E | Human | Esophagus | ESCC | 1.47e-18 | 4.36e-01 | 0.108 |
| 6988 | TCTA | P24T-E | Human | Esophagus | ESCC | 4.19e-17 | 2.08e-01 | 0.1287 |
| 6988 | TCTA | P26T-E | Human | Esophagus | ESCC | 2.51e-13 | 2.68e-01 | 0.1276 |
| 6988 | TCTA | P27T-E | Human | Esophagus | ESCC | 5.45e-15 | 3.33e-01 | 0.1055 |
| 6988 | TCTA | P28T-E | Human | Esophagus | ESCC | 1.71e-10 | 9.08e-02 | 0.1149 |
| 6988 | TCTA | P30T-E | Human | Esophagus | ESCC | 5.05e-19 | 6.23e-01 | 0.137 |
| 6988 | TCTA | P31T-E | Human | Esophagus | ESCC | 2.17e-10 | 1.95e-01 | 0.1251 |
| 6988 | TCTA | P32T-E | Human | Esophagus | ESCC | 5.64e-20 | 3.28e-01 | 0.1666 |
| 6988 | TCTA | P36T-E | Human | Esophagus | ESCC | 6.90e-07 | 1.99e-01 | 0.1187 |
| 6988 | TCTA | P37T-E | Human | Esophagus | ESCC | 2.85e-12 | 1.62e-01 | 0.1371 |
| 6988 | TCTA | P39T-E | Human | Esophagus | ESCC | 4.80e-05 | 1.31e-01 | 0.0894 |
| 6988 | TCTA | P40T-E | Human | Esophagus | ESCC | 1.71e-06 | 1.65e-01 | 0.109 |
| 6988 | TCTA | P42T-E | Human | Esophagus | ESCC | 5.32e-14 | 3.13e-01 | 0.1175 |
| 6988 | TCTA | P44T-E | Human | Esophagus | ESCC | 4.90e-09 | 1.95e-01 | 0.1096 |
| 6988 | TCTA | P47T-E | Human | Esophagus | ESCC | 6.30e-15 | 2.48e-01 | 0.1067 |
| 6988 | TCTA | P48T-E | Human | Esophagus | ESCC | 6.20e-08 | 3.37e-01 | 0.0959 |
| 6988 | TCTA | P49T-E | Human | Esophagus | ESCC | 5.58e-10 | 7.07e-01 | 0.1768 |
| Page: 1 2 3 4 5 |
| Tissue | Expression Dynamics | Abbreviation |
| Esophagus | 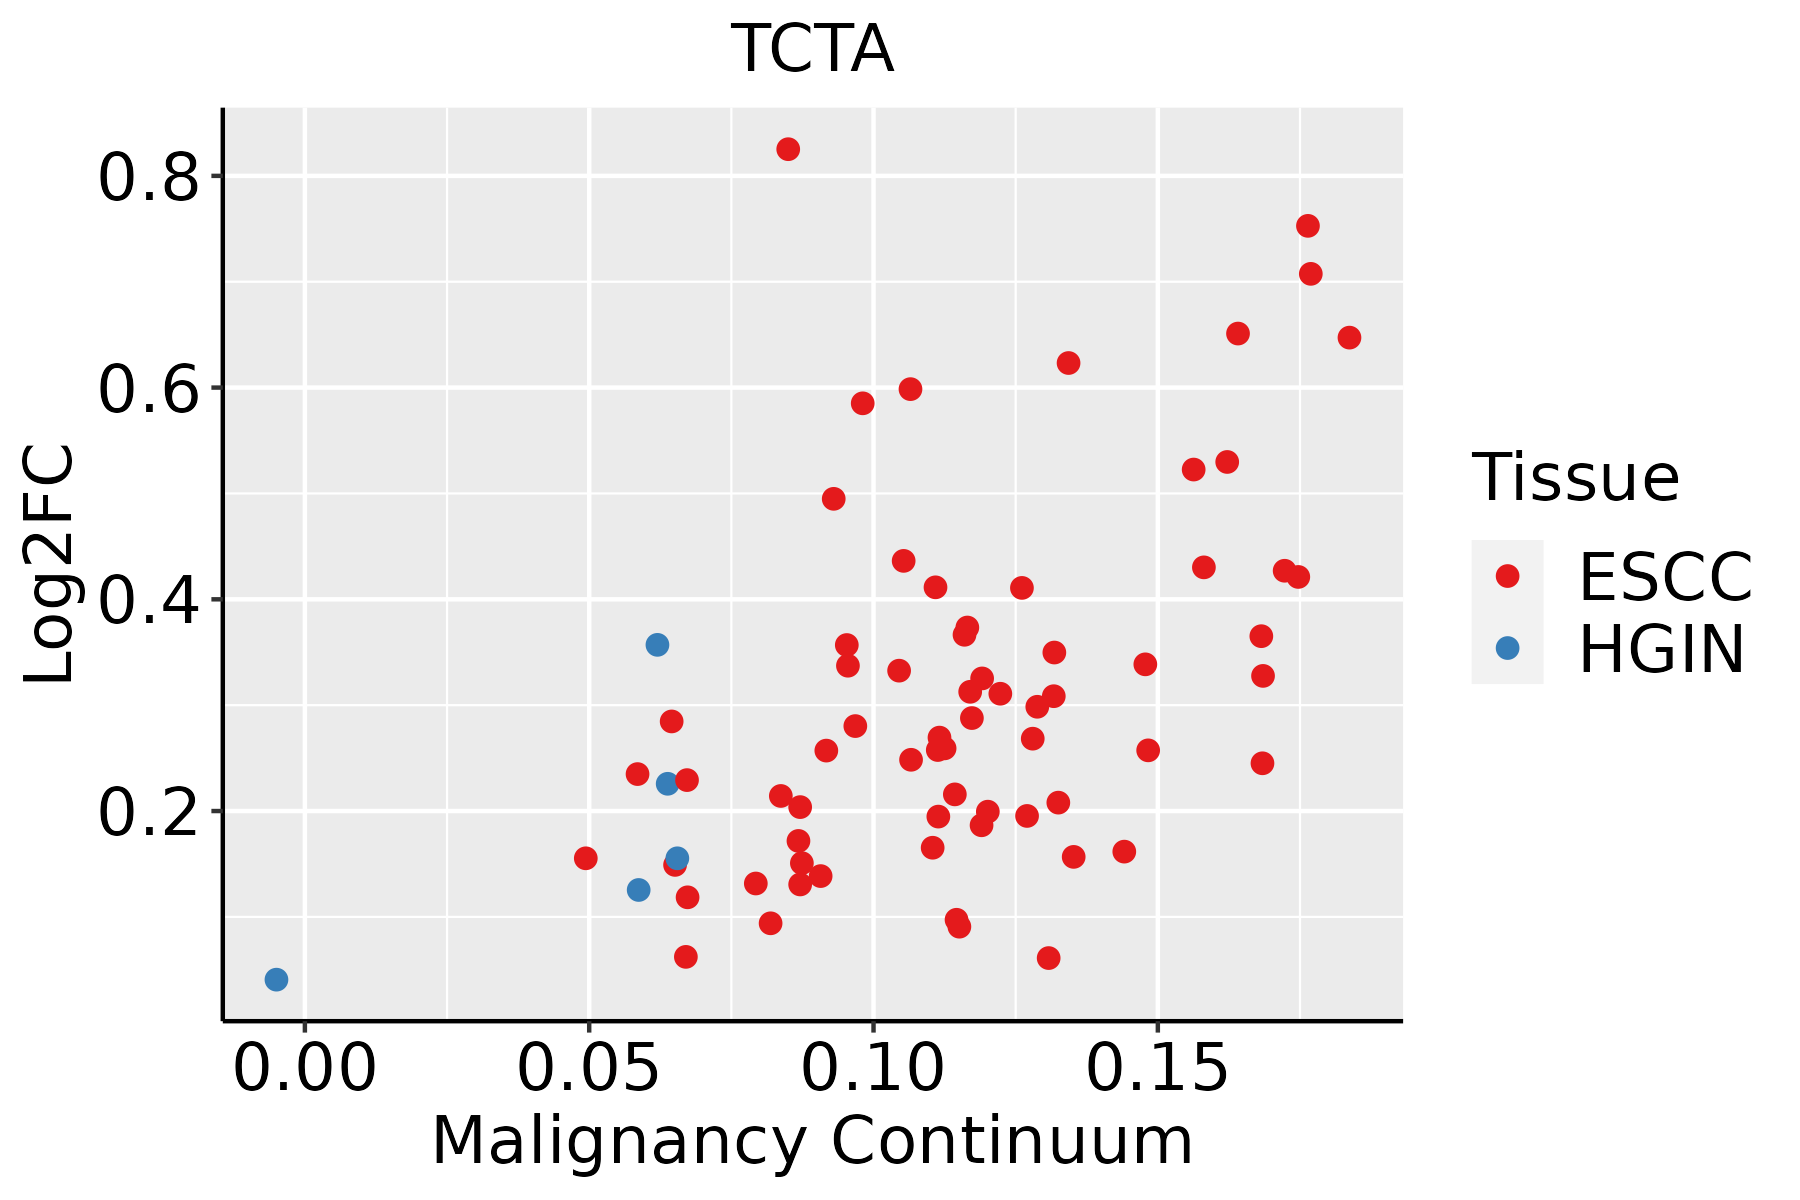 | ESCC: Esophageal squamous cell carcinoma |
| HGIN: High-grade intraepithelial neoplasias | ||
| LGIN: Low-grade intraepithelial neoplasias | ||
| Liver |  | HCC: Hepatocellular carcinoma |
| NAFLD: Non-alcoholic fatty liver disease | ||
| Oral Cavity |  | EOLP: Erosive Oral lichen planus |
| LP: leukoplakia | ||
| NEOLP: Non-erosive oral lichen planus | ||
| OSCC: Oral squamous cell carcinoma |
| ∗log2FC in expression of this searched gene in stem-like cells from each diseased tissue sample relative to stem-like cells in normal samples in each tissue plotted against the malignancy continuum. Samples are colored based on if they are from different disease stage. |
Top |
Malignant transformation related pathway analysis |
| Find out the enriched GO biological processes and KEGG pathways involved in transition from healthy to precancer to cancer |
| Tissue | Disease Stage | Enriched GO biological Processes |
| Colorectum | AD |  |
| Colorectum | SER |  |
| Colorectum | MSS |  |
| Colorectum | MSI-H |  |
| Colorectum | FAP |  |
| ∗Top 15 enriched GO BP terms are showed in the bar plot of each disease state in each tissue. Each row represents a significant GO biological process which is colored according to the -log10(p.adjust). |
| Page: 1 2 3 4 5 6 7 8 9 |
| GO ID | Tissue | Disease Stage | Description | Gene Ratio | Bg Ratio | pvalue | p.adjust | Count |
| GO:003009927 | Esophagus | HGIN | myeloid cell differentiation | 83/2587 | 381/18723 | 1.26e-05 | 3.52e-04 | 83 |
| GO:004563725 | Esophagus | HGIN | regulation of myeloid cell differentiation | 49/2587 | 210/18723 | 1.28e-04 | 2.61e-03 | 49 |
| GO:00027617 | Esophagus | HGIN | regulation of myeloid leukocyte differentiation | 31/2587 | 120/18723 | 3.35e-04 | 5.50e-03 | 31 |
| GO:000257316 | Esophagus | HGIN | myeloid leukocyte differentiation | 45/2587 | 208/18723 | 1.31e-03 | 1.56e-02 | 45 |
| GO:190370620 | Esophagus | HGIN | regulation of hemopoiesis | 69/2587 | 367/18723 | 4.39e-03 | 3.86e-02 | 69 |
| GO:0030099111 | Esophagus | ESCC | myeloid cell differentiation | 232/8552 | 381/18723 | 1.22e-09 | 2.90e-08 | 232 |
| GO:000257317 | Esophagus | ESCC | myeloid leukocyte differentiation | 128/8552 | 208/18723 | 2.75e-06 | 3.15e-05 | 128 |
| GO:1903706110 | Esophagus | ESCC | regulation of hemopoiesis | 201/8552 | 367/18723 | 2.60e-04 | 1.58e-03 | 201 |
| GO:000268316 | Esophagus | ESCC | negative regulation of immune system process | 231/8552 | 434/18723 | 8.48e-04 | 4.36e-03 | 231 |
| GO:0045637111 | Esophagus | ESCC | regulation of myeloid cell differentiation | 118/8552 | 210/18723 | 1.35e-03 | 6.43e-03 | 118 |
| GO:190210510 | Esophagus | ESCC | regulation of leukocyte differentiation | 152/8552 | 279/18723 | 1.82e-03 | 8.35e-03 | 152 |
| GO:000276115 | Esophagus | ESCC | regulation of myeloid leukocyte differentiation | 69/8552 | 120/18723 | 6.00e-03 | 2.21e-02 | 69 |
| GO:00303165 | Esophagus | ESCC | osteoclast differentiation | 54/8552 | 94/18723 | 1.43e-02 | 4.65e-02 | 54 |
| GO:003009912 | Liver | Cirrhotic | myeloid cell differentiation | 135/4634 | 381/18723 | 1.69e-06 | 3.22e-05 | 135 |
| GO:00025735 | Liver | Cirrhotic | myeloid leukocyte differentiation | 70/4634 | 208/18723 | 2.34e-03 | 1.42e-02 | 70 |
| GO:00456377 | Liver | Cirrhotic | regulation of myeloid cell differentiation | 68/4634 | 210/18723 | 7.40e-03 | 3.53e-02 | 68 |
| GO:003009922 | Liver | HCC | myeloid cell differentiation | 200/7958 | 381/18723 | 4.64e-05 | 4.49e-04 | 200 |
| GO:003009920 | Oral cavity | OSCC | myeloid cell differentiation | 213/7305 | 381/18723 | 1.24e-11 | 4.42e-10 | 213 |
| GO:000257310 | Oral cavity | OSCC | myeloid leukocyte differentiation | 119/7305 | 208/18723 | 7.29e-08 | 1.29e-06 | 119 |
| GO:190370618 | Oral cavity | OSCC | regulation of hemopoiesis | 180/7305 | 367/18723 | 5.16e-05 | 4.30e-04 | 180 |
| Page: 1 2 |
| Pathway ID | Tissue | Disease Stage | Description | Gene Ratio | Bg Ratio | pvalue | p.adjust | qvalue | Count |
| Page: 1 |
Top |
Cell-cell communication analysis |
| Identification of potential cell-cell interactions between two cell types and their ligand-receptor pairs for different disease states |
| Ligand | Receptor | LRpair | Pathway | Tissue | Disease Stage |
| Page: 1 |
Top |
Single-cell gene regulatory network inference analysis |
| Find out the significant the regulons (TFs) and the target genes of each regulon across cell types for different disease states |
| TF | Cell Type | Tissue | Disease Stage | Target Gene | RSS | Regulon Activity |
| ∗The dot plots of a searched regulon are shown for all cell subpopulations in each disease state of each tissue based on the regulon specific score inferred using pySCENIC and by calculating the average expression. |
| Page: 1 |
Top |
Somatic mutation of malignant transformation related genes |
| Annotation of somatic variants for genes involved in malignant transformation |
| Hugo Symbol | Variant Class | Variant Classification | dbSNP RS | HGVSc | HGVSp | HGVSp Short | SWISSPROT | BIOTYPE | SIFT | PolyPhen | Tumor Sample Barcode | Tissue | Histology | Sex | Age | Stage | Therapy Types | Drugs | Outcome |
| TCTA | SNV | Missense_Mutation | c.155N>A | p.Gly52Asp | p.G52D | P57738 | protein_coding | deleterious(0.01) | benign(0.166) | TCGA-AA-3710-01 | Colorectum | colon adenocarcinoma | Female | >=65 | I/II | Unknown | Unknown | SD | |
| TCTA | SNV | Missense_Mutation | c.281N>T | p.Ala94Val | p.A94V | P57738 | protein_coding | deleterious(0.02) | benign(0.037) | TCGA-AA-A01R-01 | Colorectum | colon adenocarcinoma | Male | <65 | III/IV | Chemotherapy | 5-fluorouracil | PD | |
| TCTA | SNV | Missense_Mutation | rs142840341 | c.286N>A | p.Glu96Lys | p.E96K | P57738 | protein_coding | deleterious(0.02) | probably_damaging(0.956) | TCGA-AG-A002-01 | Colorectum | rectum adenocarcinoma | Male | <65 | I/II | Unknown | Unknown | SD |
| TCTA | SNV | Missense_Mutation | rs764544359 | c.130N>A | p.Leu44Met | p.L44M | P57738 | protein_coding | tolerated(0.1) | probably_damaging(0.996) | TCGA-AP-A051-01 | Endometrium | uterine corpus endometrioid carcinoma | Female | >=65 | I/II | Unknown | Unknown | SD |
| TCTA | SNV | Missense_Mutation | c.203A>G | p.Tyr68Cys | p.Y68C | P57738 | protein_coding | tolerated(0.18) | probably_damaging(0.996) | TCGA-AP-A054-01 | Endometrium | uterine corpus endometrioid carcinoma | Female | <65 | III/IV | Chemotherapy | carboplatin | PD | |
| TCTA | SNV | Missense_Mutation | c.266N>T | p.Ser89Leu | p.S89L | P57738 | protein_coding | tolerated(0.28) | benign(0.015) | TCGA-AP-A0LM-01 | Endometrium | uterine corpus endometrioid carcinoma | Female | <65 | III/IV | Chemotherapy | cisplatin | SD | |
| TCTA | SNV | Missense_Mutation | novel | c.164N>G | p.Leu55Arg | p.L55R | P57738 | protein_coding | deleterious(0) | probably_damaging(0.996) | TCGA-EC-A1QX-01 | Endometrium | uterine corpus endometrioid carcinoma | Female | >=65 | I/II | Chemotherapy | cyclophosphamide | PD |
| TCTA | SNV | Missense_Mutation | c.30N>T | p.Leu10Phe | p.L10F | P57738 | protein_coding | tolerated(0.08) | benign(0.119) | TCGA-MI-A75G-01 | Liver | liver hepatocellular carcinoma | Male | <65 | I/II | Unknown | Unknown | SD | |
| TCTA | SNV | Missense_Mutation | novel | c.181G>T | p.Gly61Trp | p.G61W | P57738 | protein_coding | deleterious(0) | benign(0.052) | TCGA-05-4396-01 | Lung | lung adenocarcinoma | Male | >=65 | III/IV | Unknown | Unknown | SD |
| TCTA | SNV | Missense_Mutation | c.244N>T | p.Asp82Tyr | p.D82Y | P57738 | protein_coding | deleterious(0.01) | probably_damaging(0.997) | TCGA-NJ-A4YP-01 | Lung | lung adenocarcinoma | Male | <65 | I/II | Unknown | Unknown | SD |
| Page: 1 2 |
Top |
Related drugs of malignant transformation related genes |
| Identification of chemicals and drugs interact with genes involved in malignant transfromation |
| (DGIdb 4.0) |
| Entrez ID | Symbol | Category | Interaction Types | Drug Claim Name | Drug Name | PMIDs |
| Page: 1 |

Copyright 2023-Present -The University of Texas Health Science Center at Houston |