
|
|||||
|
 | |
| |
| |
| |
| |
| |
|
Gene: TCEA3 |
Gene summary for TCEA3 |
| Gene information | Species | Human | Gene symbol | TCEA3 | Gene ID | 6920 |
| Gene name | transcription elongation factor A3 | |
| Gene Alias | TFIIS | |
| Cytomap | 1p36.12 | |
| Gene Type | protein-coding | GO ID | GO:0006139 | UniProtAcc | B4DUM4 |
Top |
Malignant transformation analysis |
| Identification of the aberrant gene expression in precancerous and cancerous lesions by comparing the gene expression of stem-like cells in diseased tissues with normal stem cells |
| Entrez ID | Symbol | Replicates | Species | Organ | Tissue | Adj P-value | Log2FC | Malignancy |
| 6920 | TCEA3 | HTA11_78_2000001011 | Human | Colorectum | AD | 2.94e-14 | 7.74e-01 | -0.1088 |
| 6920 | TCEA3 | HTA11_347_2000001011 | Human | Colorectum | AD | 1.15e-38 | 1.10e+00 | -0.1954 |
| 6920 | TCEA3 | HTA11_2112_2000001011 | Human | Colorectum | SER | 9.86e-05 | 7.84e-01 | -0.2196 |
| 6920 | TCEA3 | HTA11_3361_2000001011 | Human | Colorectum | AD | 5.63e-04 | 4.89e-01 | -0.1207 |
| 6920 | TCEA3 | HTA11_83_2000001011 | Human | Colorectum | SER | 1.11e-08 | 6.54e-01 | -0.1526 |
| 6920 | TCEA3 | HTA11_696_2000001011 | Human | Colorectum | AD | 1.76e-14 | 7.81e-01 | -0.1464 |
| 6920 | TCEA3 | HTA11_866_2000001011 | Human | Colorectum | AD | 2.01e-09 | 6.17e-01 | -0.1001 |
| 6920 | TCEA3 | HTA11_1391_2000001011 | Human | Colorectum | AD | 1.89e-04 | 4.68e-01 | -0.059 |
| 6920 | TCEA3 | HTA11_5216_2000001011 | Human | Colorectum | SER | 3.24e-06 | 7.34e-01 | -0.1462 |
| 6920 | TCEA3 | HTA11_546_2000001011 | Human | Colorectum | AD | 1.22e-06 | 6.50e-01 | -0.0842 |
| 6920 | TCEA3 | HTA11_10623_2000001011 | Human | Colorectum | AD | 1.42e-03 | 5.57e-01 | -0.0177 |
| 6920 | TCEA3 | HTA11_7469_2000001011 | Human | Colorectum | AD | 3.52e-02 | 6.43e-01 | -0.0124 |
| 6920 | TCEA3 | HTA11_99999970781_79442 | Human | Colorectum | MSS | 4.16e-02 | -3.01e-01 | 0.294 |
| 6920 | TCEA3 | HTA11_99999973899_84307 | Human | Colorectum | MSS | 4.39e-02 | -4.98e-01 | 0.2585 |
| 6920 | TCEA3 | HTA11_99999974143_84620 | Human | Colorectum | MSS | 9.25e-24 | -6.15e-01 | 0.3005 |
| 6920 | TCEA3 | F007 | Human | Colorectum | FAP | 3.92e-07 | -4.91e-01 | 0.1176 |
| 6920 | TCEA3 | A002-C-010 | Human | Colorectum | FAP | 4.00e-08 | -3.63e-01 | 0.242 |
| 6920 | TCEA3 | A015-C-203 | Human | Colorectum | FAP | 1.42e-24 | -3.00e-01 | -0.1294 |
| 6920 | TCEA3 | A015-C-204 | Human | Colorectum | FAP | 7.66e-04 | -1.98e-01 | -0.0228 |
| 6920 | TCEA3 | A014-C-040 | Human | Colorectum | FAP | 1.24e-02 | -1.42e-01 | -0.1184 |
| Page: 1 2 3 4 5 6 7 8 9 |
| Tissue | Expression Dynamics | Abbreviation |
| Breast |  | IDC: Invasive ductal carcinoma |
| DCIS: Ductal carcinoma in situ | ||
| Precancer(BRCA1-mut): Precancerous lesion from BRCA1 mutation carriers | ||
| Colorectum (GSE201348) |  | FAP: Familial adenomatous polyposis |
| CRC: Colorectal cancer | ||
| Colorectum (HTA11) |  | AD: Adenomas |
| SER: Sessile serrated lesions | ||
| MSI-H: Microsatellite-high colorectal cancer | ||
| MSS: Microsatellite stable colorectal cancer | ||
| Esophagus | 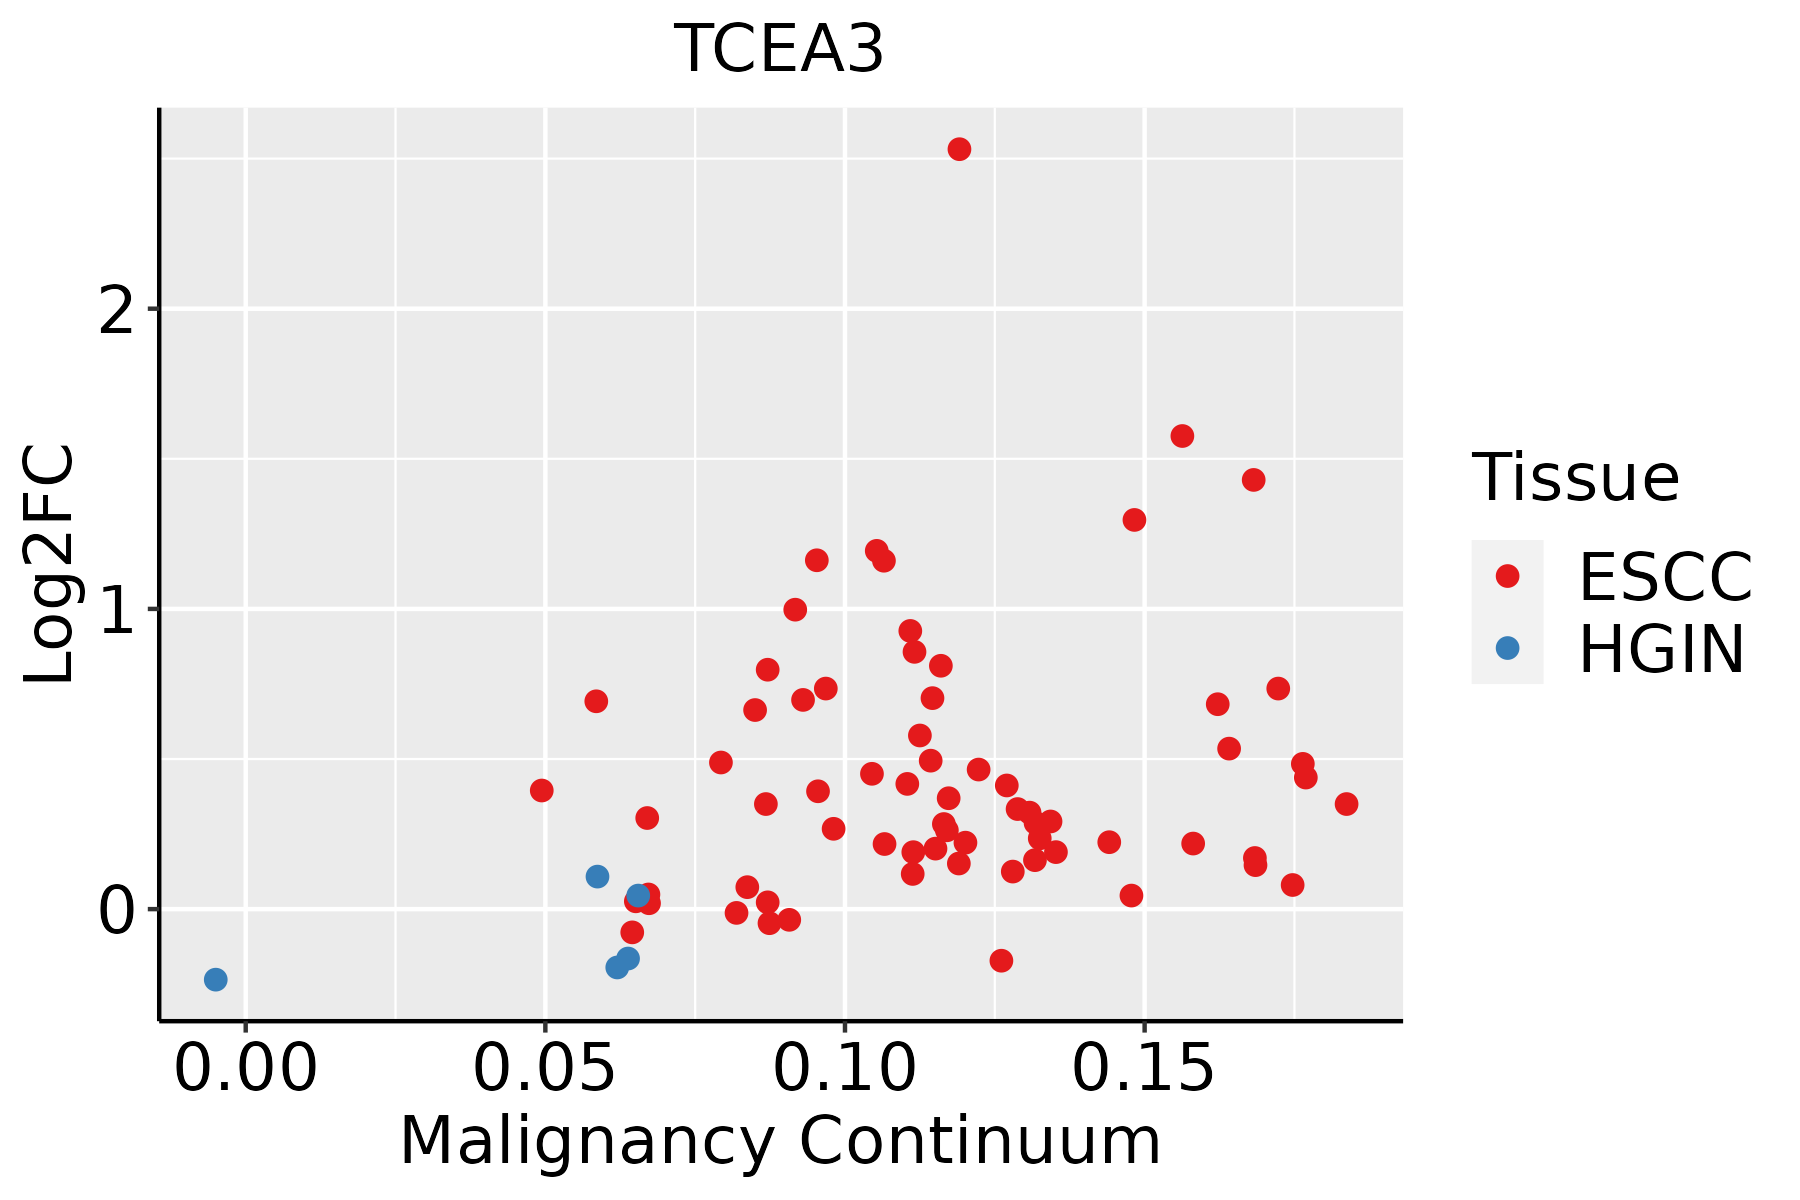 | ESCC: Esophageal squamous cell carcinoma |
| HGIN: High-grade intraepithelial neoplasias | ||
| LGIN: Low-grade intraepithelial neoplasias | ||
| Liver | 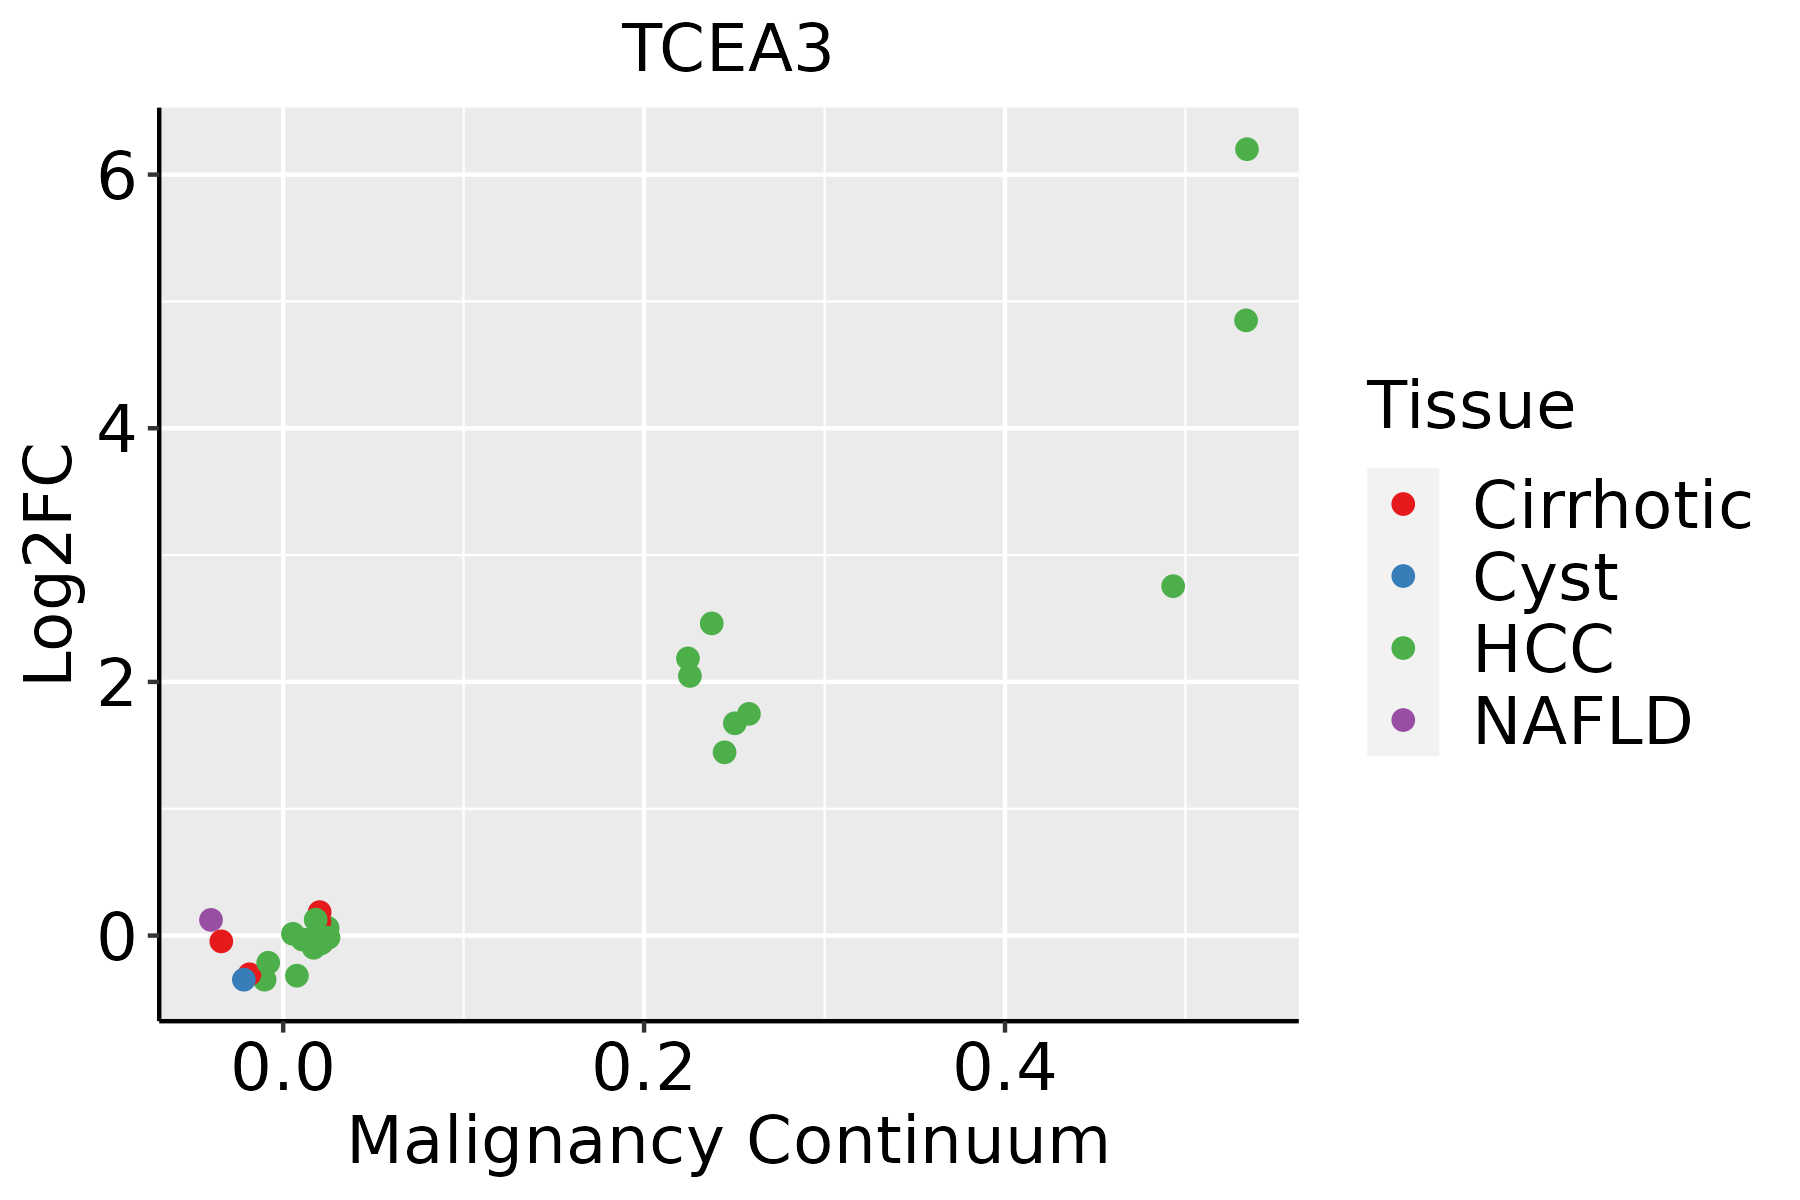 | HCC: Hepatocellular carcinoma |
| NAFLD: Non-alcoholic fatty liver disease | ||
| Oral Cavity | 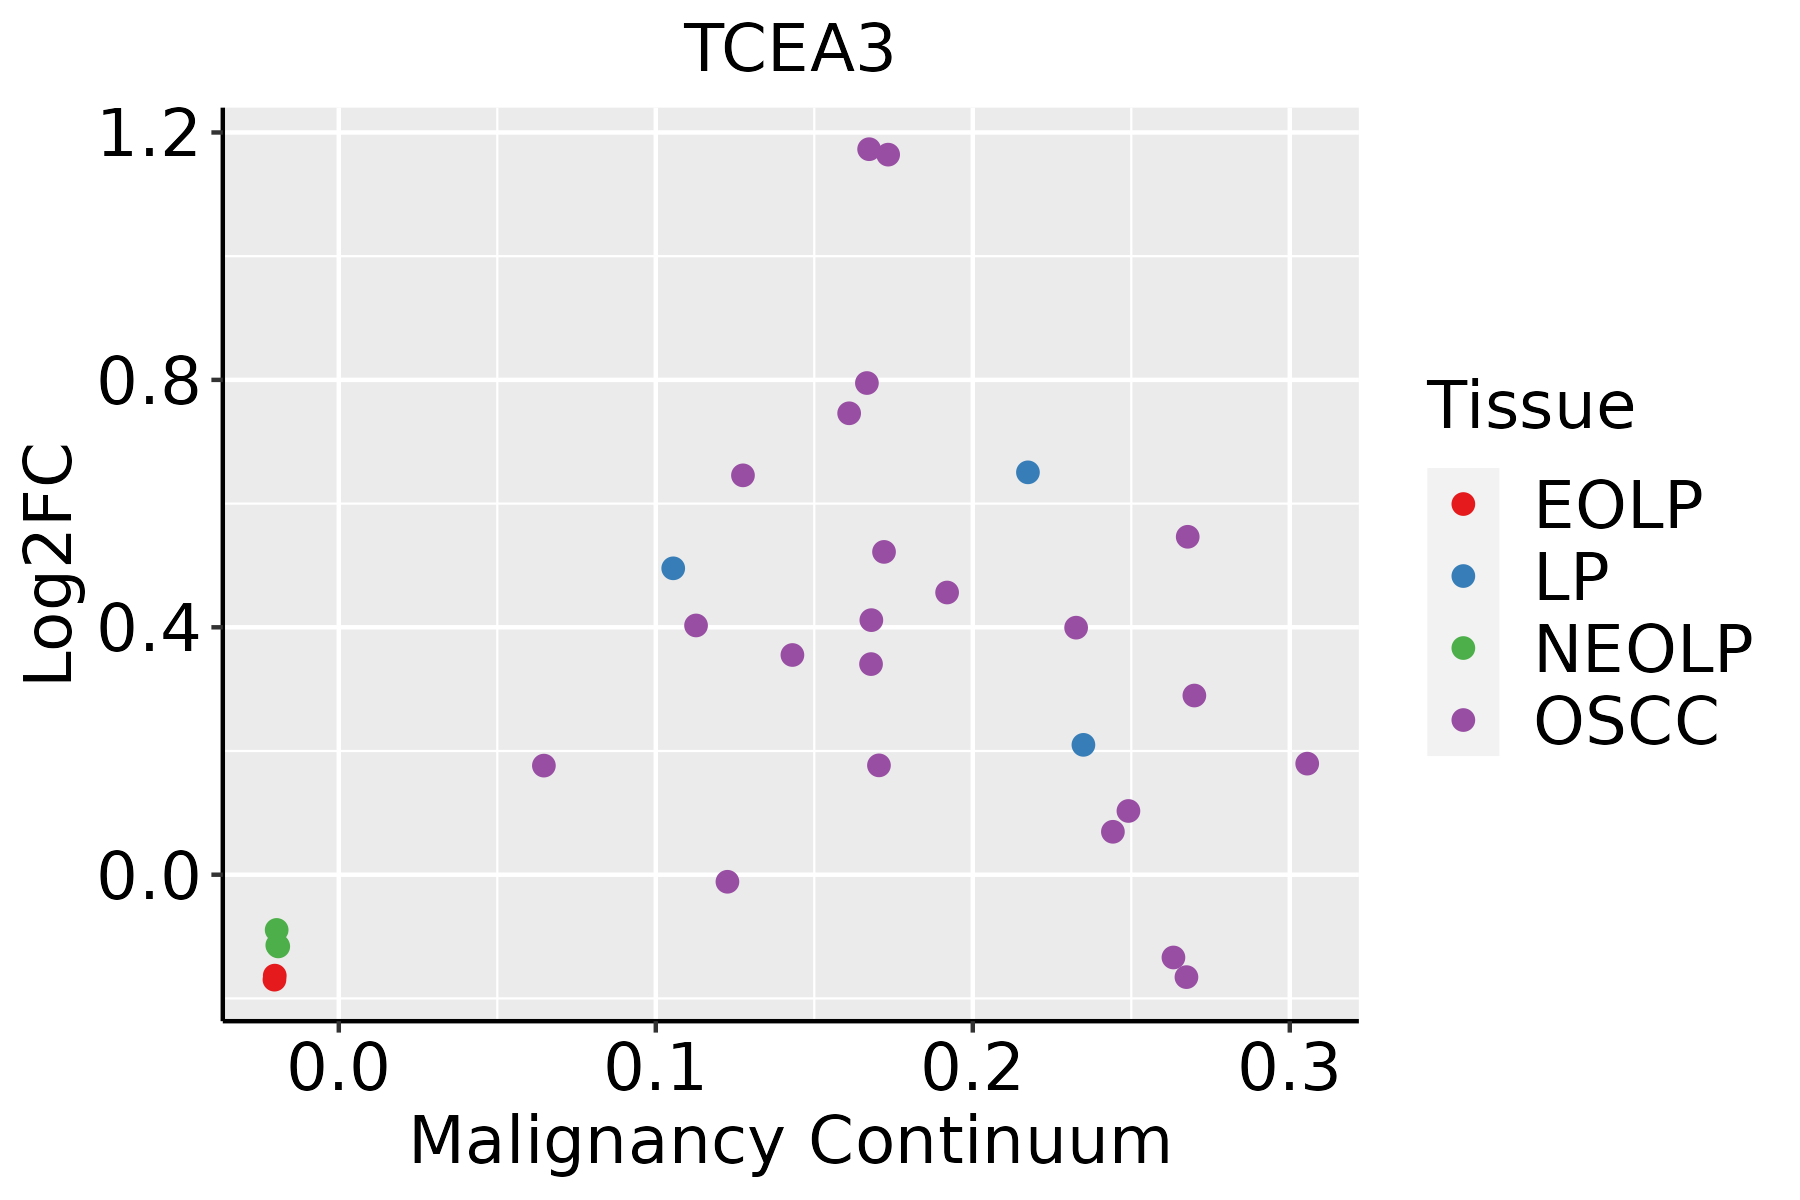 | EOLP: Erosive Oral lichen planus |
| LP: leukoplakia | ||
| NEOLP: Non-erosive oral lichen planus | ||
| OSCC: Oral squamous cell carcinoma | ||
| Prostate | 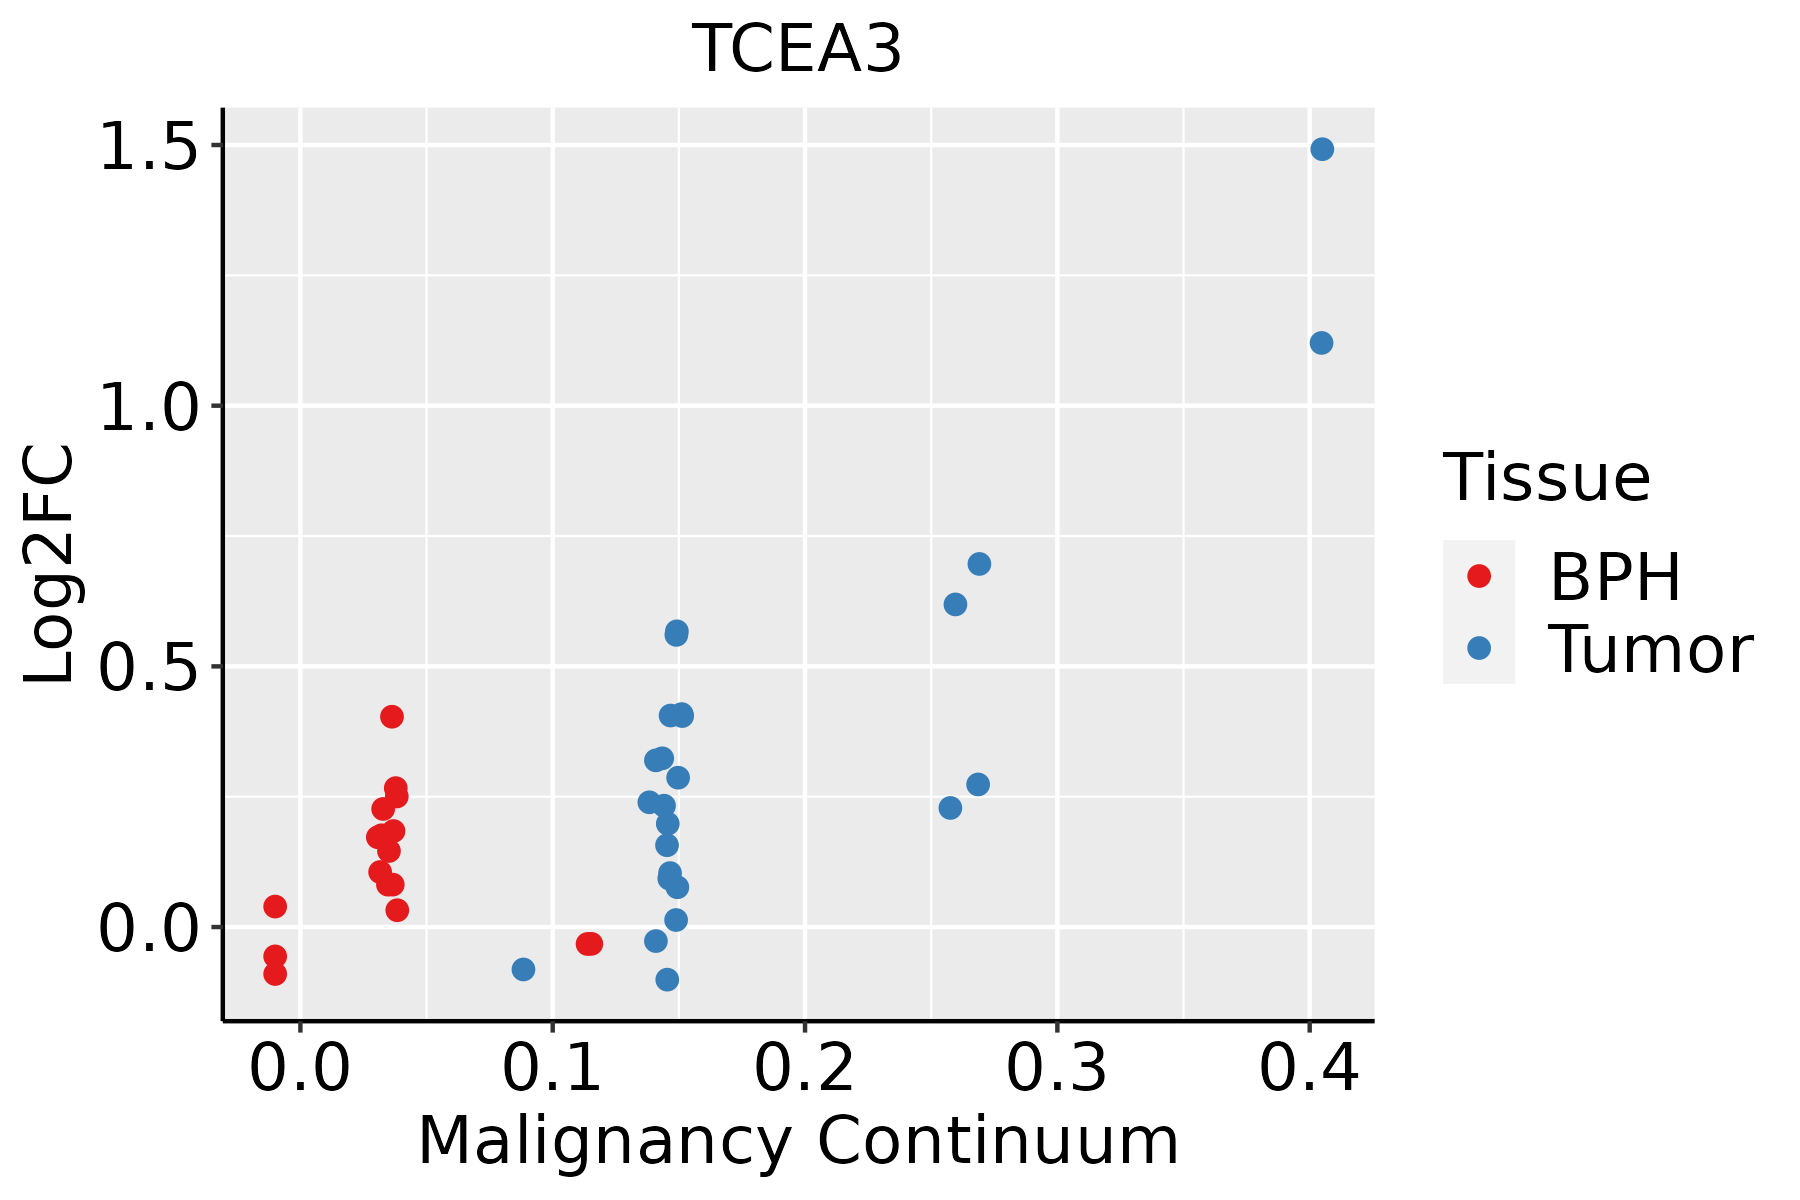 | BPH: Benign Prostatic Hyperplasia |
| Thyroid | 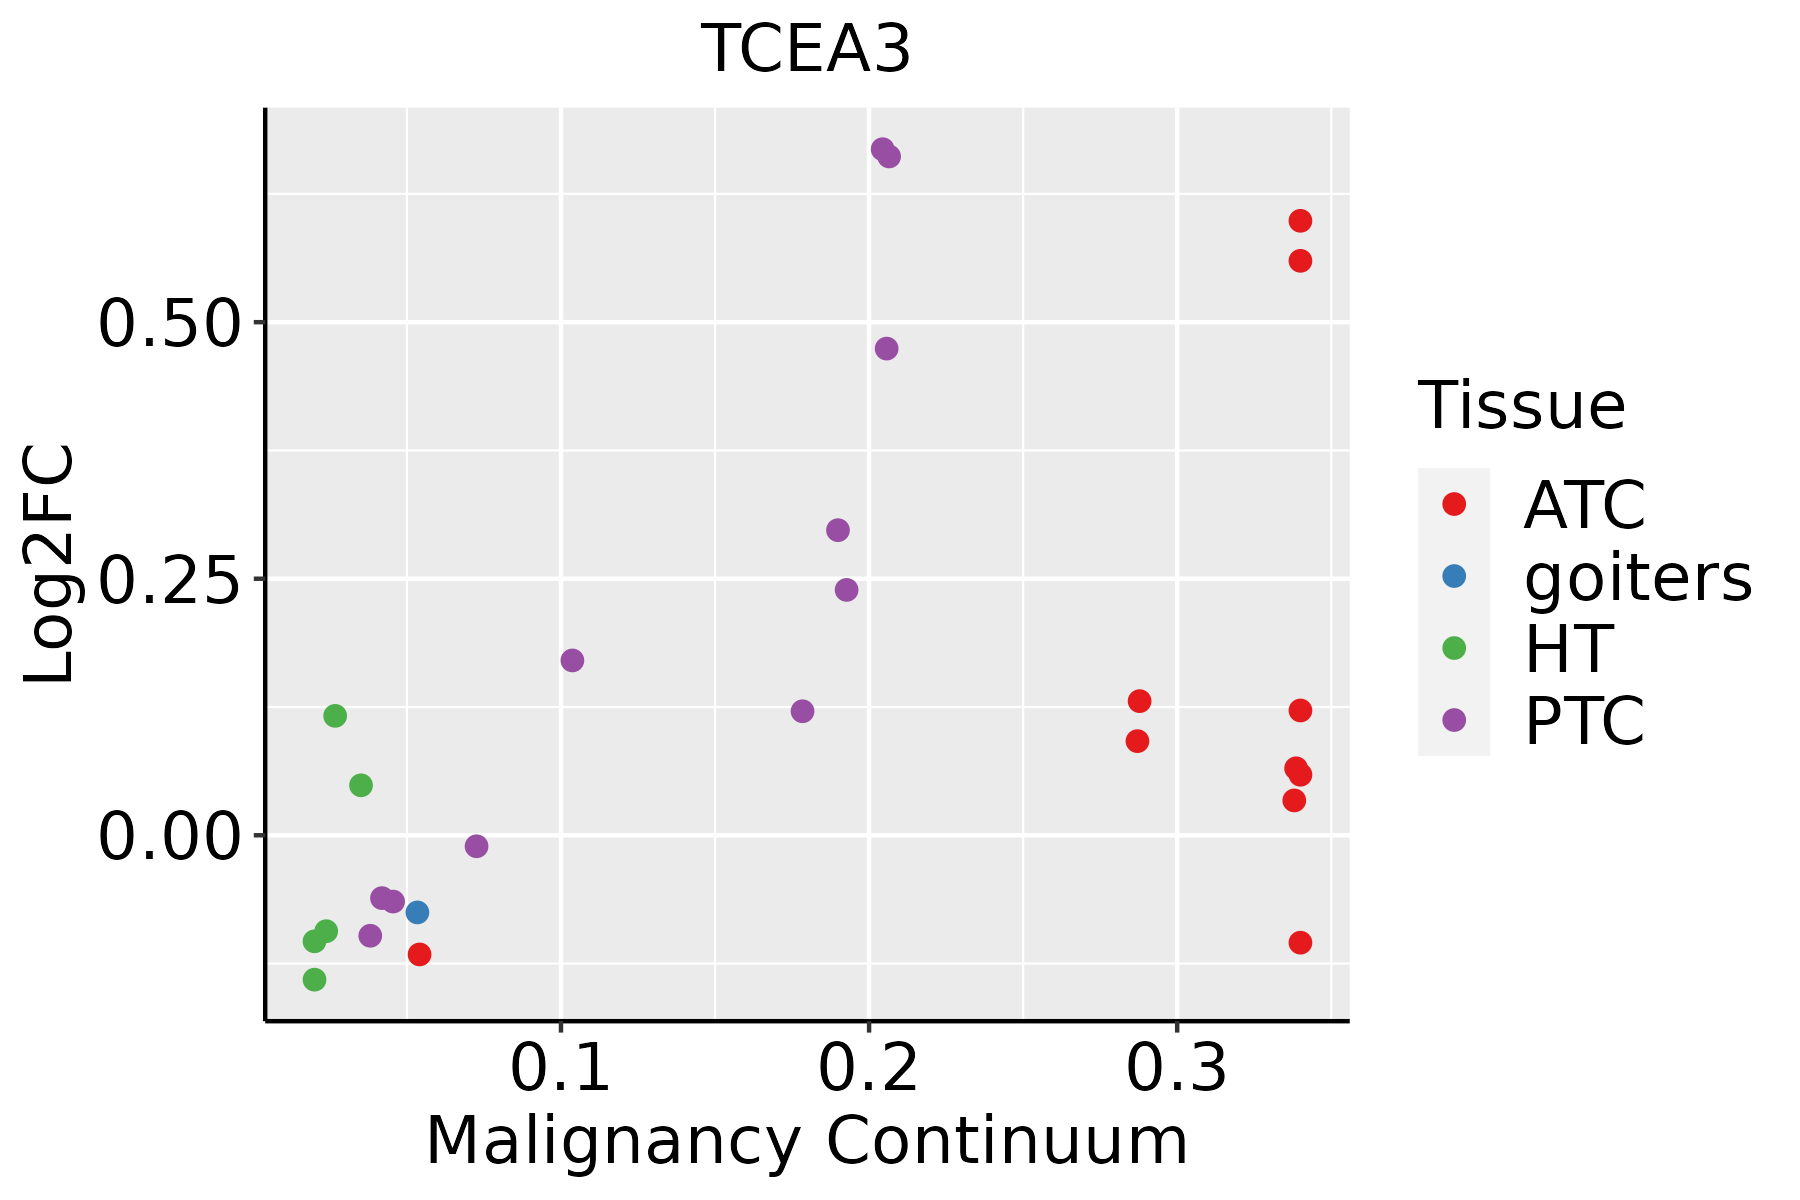 | ATC: Anaplastic thyroid cancer |
| HT: Hashimoto's thyroiditis | ||
| PTC: Papillary thyroid cancer |
| ∗log2FC in expression of this searched gene in stem-like cells from each diseased tissue sample relative to stem-like cells in normal samples in each tissue plotted against the malignancy continuum. Samples are colored based on if they are from different disease stage. |
Top |
Malignant transformation related pathway analysis |
| Find out the enriched GO biological processes and KEGG pathways involved in transition from healthy to precancer to cancer |
| Tissue | Disease Stage | Enriched GO biological Processes |
| Colorectum | AD |  |
| Colorectum | SER |  |
| Colorectum | MSS |  |
| Colorectum | MSI-H |  |
| Colorectum | FAP |  |
| ∗Top 15 enriched GO BP terms are showed in the bar plot of each disease state in each tissue. Each row represents a significant GO biological process which is colored according to the -log10(p.adjust). |
| Page: 1 2 3 4 5 6 7 8 9 |
| GO ID | Tissue | Disease Stage | Description | Gene Ratio | Bg Ratio | pvalue | p.adjust | Count |
| Page: 1 |
| Pathway ID | Tissue | Disease Stage | Description | Gene Ratio | Bg Ratio | pvalue | p.adjust | qvalue | Count |
| Page: 1 |
Top |
Cell-cell communication analysis |
| Identification of potential cell-cell interactions between two cell types and their ligand-receptor pairs for different disease states |
| Ligand | Receptor | LRpair | Pathway | Tissue | Disease Stage |
| Page: 1 |
Top |
Single-cell gene regulatory network inference analysis |
| Find out the significant the regulons (TFs) and the target genes of each regulon across cell types for different disease states |
| TF | Cell Type | Tissue | Disease Stage | Target Gene | RSS | Regulon Activity |
| ∗The dot plots of a searched regulon are shown for all cell subpopulations in each disease state of each tissue based on the regulon specific score inferred using pySCENIC and by calculating the average expression. |
| Page: 1 |
Top |
Somatic mutation of malignant transformation related genes |
| Annotation of somatic variants for genes involved in malignant transformation |
| Hugo Symbol | Variant Class | Variant Classification | dbSNP RS | HGVSc | HGVSp | HGVSp Short | SWISSPROT | BIOTYPE | SIFT | PolyPhen | Tumor Sample Barcode | Tissue | Histology | Sex | Age | Stage | Therapy Types | Drugs | Outcome |
| TCEA3 | SNV | Missense_Mutation | c.269G>T | p.Gly90Val | p.G90V | O75764 | protein_coding | tolerated(0.09) | benign(0.001) | TCGA-A8-A08L-01 | Breast | breast invasive carcinoma | Female | >=65 | III/IV | Unknown | Unknown | SD | |
| TCEA3 | SNV | Missense_Mutation | rs551455715 | c.760C>T | p.Arg254Trp | p.R254W | O75764 | protein_coding | deleterious(0) | possibly_damaging(0.708) | TCGA-CK-4950-01 | Colorectum | colon adenocarcinoma | Female | >=65 | III/IV | Chemotherapy | folfox | SD |
| TCEA3 | SNV | Missense_Mutation | rs549062868 | c.715C>T | p.Arg239Cys | p.R239C | O75764 | protein_coding | deleterious(0) | probably_damaging(0.982) | TCGA-F4-6856-01 | Colorectum | colon adenocarcinoma | Male | <65 | I/II | Ancillary | leucovorin | CR |
| TCEA3 | SNV | Missense_Mutation | novel | c.163N>A | p.Val55Ile | p.V55I | O75764 | protein_coding | tolerated(0.73) | benign(0.042) | TCGA-A5-A0G2-01 | Endometrium | uterine corpus endometrioid carcinoma | Female | <65 | III/IV | Unknown | Unknown | SD |
| TCEA3 | SNV | Missense_Mutation | rs774600357 | c.362N>A | p.Arg121Gln | p.R121Q | O75764 | protein_coding | tolerated(0.12) | benign(0) | TCGA-A5-A2K5-01 | Endometrium | uterine corpus endometrioid carcinoma | Female | >=65 | I/II | Unknown | Unknown | SD |
| TCEA3 | SNV | Missense_Mutation | rs551455715 | c.760C>T | p.Arg254Trp | p.R254W | O75764 | protein_coding | deleterious(0) | possibly_damaging(0.708) | TCGA-AJ-A3EK-01 | Endometrium | uterine corpus endometrioid carcinoma | Female | <65 | I/II | Chemotherapy | carboplatin | CR |
| TCEA3 | SNV | Missense_Mutation | rs763442834 | c.761N>A | p.Arg254Gln | p.R254Q | O75764 | protein_coding | deleterious(0) | probably_damaging(0.91) | TCGA-AP-A1DK-01 | Endometrium | uterine corpus endometrioid carcinoma | Female | <65 | I/II | Unknown | Unknown | SD |
| TCEA3 | SNV | Missense_Mutation | c.976N>T | p.Arg326Cys | p.R326C | O75764 | protein_coding | deleterious(0) | benign(0.351) | TCGA-AX-A0J1-01 | Endometrium | uterine corpus endometrioid carcinoma | Female | >=65 | I/II | Unknown | Unknown | SD | |
| TCEA3 | SNV | Missense_Mutation | rs777318907 | c.812C>T | p.Thr271Met | p.T271M | O75764 | protein_coding | deleterious(0.03) | benign(0.378) | TCGA-AX-A2HD-01 | Endometrium | uterine corpus endometrioid carcinoma | Female | >=65 | III/IV | Unknown | Unknown | SD |
| TCEA3 | SNV | Missense_Mutation | c.772C>T | p.Leu258Phe | p.L258F | O75764 | protein_coding | deleterious(0) | probably_damaging(0.949) | TCGA-B5-A0JY-01 | Endometrium | uterine corpus endometrioid carcinoma | Female | <65 | III/IV | Chemotherapy | doxorubicin | SD |
| Page: 1 2 3 4 |
Top |
Related drugs of malignant transformation related genes |
| Identification of chemicals and drugs interact with genes involved in malignant transfromation |
| (DGIdb 4.0) |
| Entrez ID | Symbol | Category | Interaction Types | Drug Claim Name | Drug Name | PMIDs |
| Page: 1 |

Copyright 2023-Present -The University of Texas Health Science Center at Houston |