
|
|||||
|
 | |
| |
| |
| |
| |
| |
|
Gene: TCEA2 |
Gene summary for TCEA2 |
| Gene information | Species | Human | Gene symbol | TCEA2 | Gene ID | 6919 |
| Gene name | transcription elongation factor A2 | |
| Gene Alias | TFIIS | |
| Cytomap | 20q13.33 | |
| Gene Type | protein-coding | GO ID | GO:0006139 | UniProtAcc | Q15560 |
Top |
Malignant transformation analysis |
| Identification of the aberrant gene expression in precancerous and cancerous lesions by comparing the gene expression of stem-like cells in diseased tissues with normal stem cells |
| Entrez ID | Symbol | Replicates | Species | Organ | Tissue | Adj P-value | Log2FC | Malignancy |
| 6919 | TCEA2 | P27T-E | Human | Esophagus | ESCC | 2.27e-09 | 1.72e-01 | 0.1055 |
| 6919 | TCEA2 | P28T-E | Human | Esophagus | ESCC | 9.76e-28 | 4.65e-01 | 0.1149 |
| 6919 | TCEA2 | P30T-E | Human | Esophagus | ESCC | 4.24e-07 | 3.69e-01 | 0.137 |
| 6919 | TCEA2 | P31T-E | Human | Esophagus | ESCC | 3.33e-22 | 4.39e-01 | 0.1251 |
| 6919 | TCEA2 | P32T-E | Human | Esophagus | ESCC | 7.95e-25 | 4.76e-01 | 0.1666 |
| 6919 | TCEA2 | P36T-E | Human | Esophagus | ESCC | 2.77e-06 | 2.82e-01 | 0.1187 |
| 6919 | TCEA2 | P37T-E | Human | Esophagus | ESCC | 7.04e-04 | 1.33e-01 | 0.1371 |
| 6919 | TCEA2 | P38T-E | Human | Esophagus | ESCC | 2.48e-05 | 3.12e-01 | 0.127 |
| 6919 | TCEA2 | P39T-E | Human | Esophagus | ESCC | 7.75e-13 | 1.91e-01 | 0.0894 |
| 6919 | TCEA2 | P40T-E | Human | Esophagus | ESCC | 2.19e-11 | 4.03e-01 | 0.109 |
| 6919 | TCEA2 | P42T-E | Human | Esophagus | ESCC | 7.16e-13 | 2.66e-01 | 0.1175 |
| 6919 | TCEA2 | P44T-E | Human | Esophagus | ESCC | 1.43e-08 | 2.18e-01 | 0.1096 |
| 6919 | TCEA2 | P47T-E | Human | Esophagus | ESCC | 2.07e-16 | 2.97e-01 | 0.1067 |
| 6919 | TCEA2 | P48T-E | Human | Esophagus | ESCC | 5.28e-10 | 1.45e-01 | 0.0959 |
| 6919 | TCEA2 | P49T-E | Human | Esophagus | ESCC | 1.69e-04 | 7.44e-01 | 0.1768 |
| 6919 | TCEA2 | P52T-E | Human | Esophagus | ESCC | 1.92e-17 | 3.72e-01 | 0.1555 |
| 6919 | TCEA2 | P54T-E | Human | Esophagus | ESCC | 4.00e-05 | 1.04e-01 | 0.0975 |
| 6919 | TCEA2 | P56T-E | Human | Esophagus | ESCC | 1.24e-12 | 1.08e+00 | 0.1613 |
| 6919 | TCEA2 | P57T-E | Human | Esophagus | ESCC | 1.09e-22 | 5.62e-01 | 0.0926 |
| 6919 | TCEA2 | P61T-E | Human | Esophagus | ESCC | 6.49e-32 | 7.72e-01 | 0.099 |
| Page: 1 2 3 4 5 |
| Tissue | Expression Dynamics | Abbreviation |
| Esophagus | 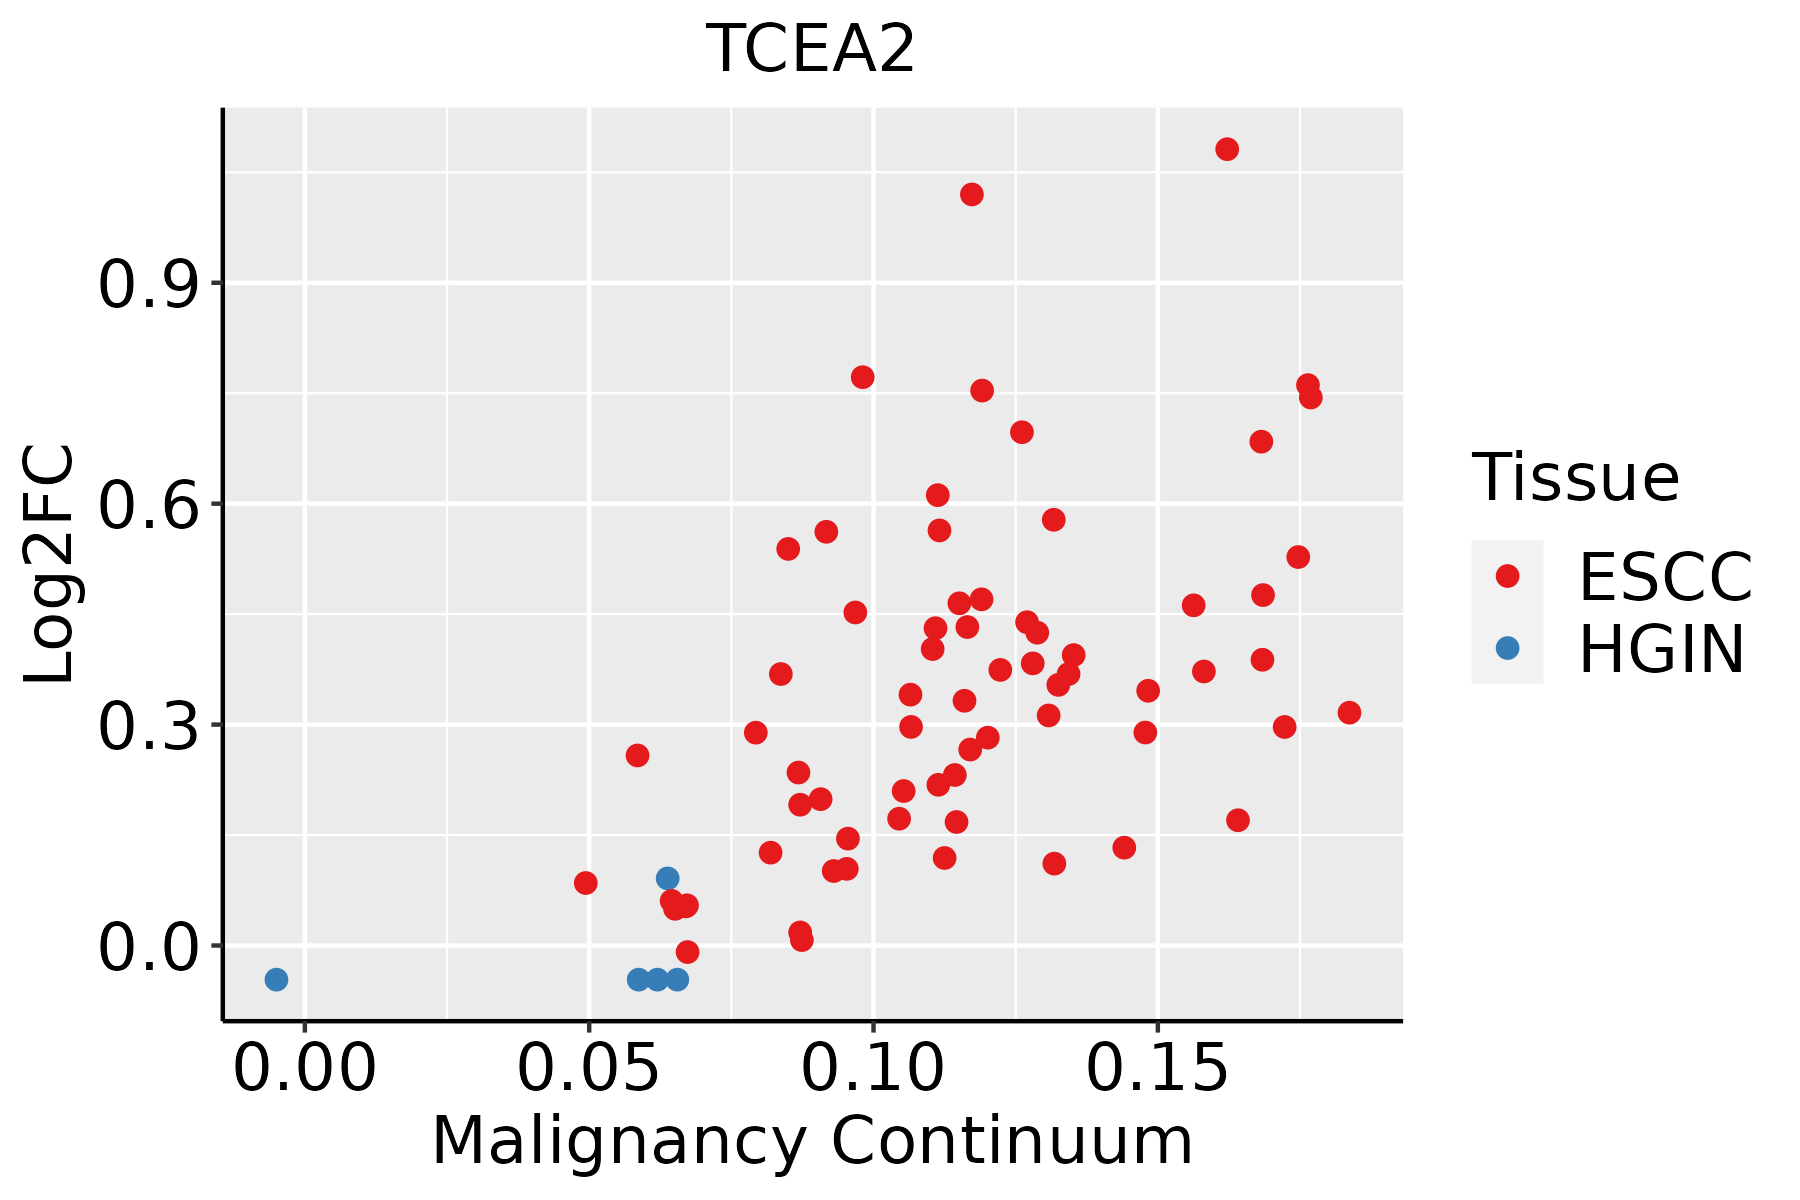 | ESCC: Esophageal squamous cell carcinoma |
| HGIN: High-grade intraepithelial neoplasias | ||
| LGIN: Low-grade intraepithelial neoplasias | ||
| Liver | 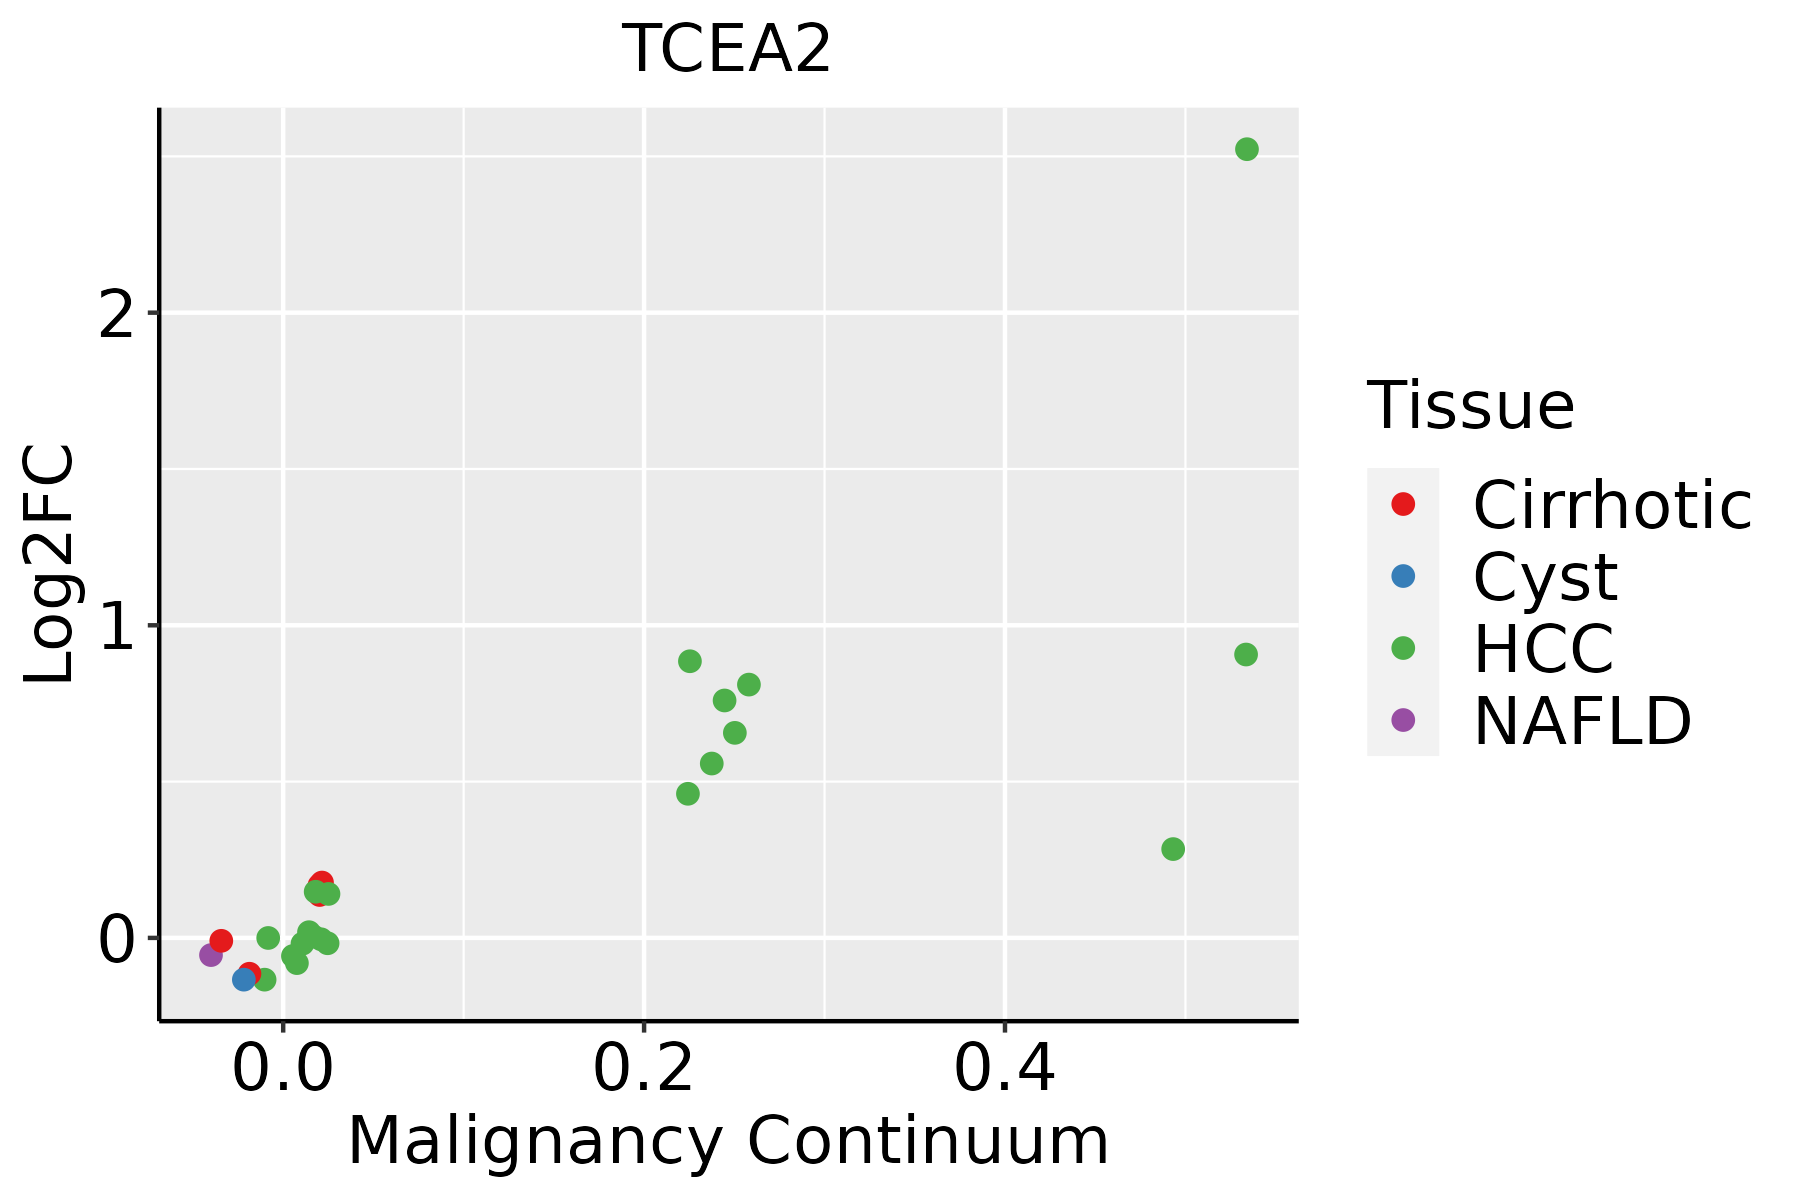 | HCC: Hepatocellular carcinoma |
| NAFLD: Non-alcoholic fatty liver disease | ||
| Oral Cavity | 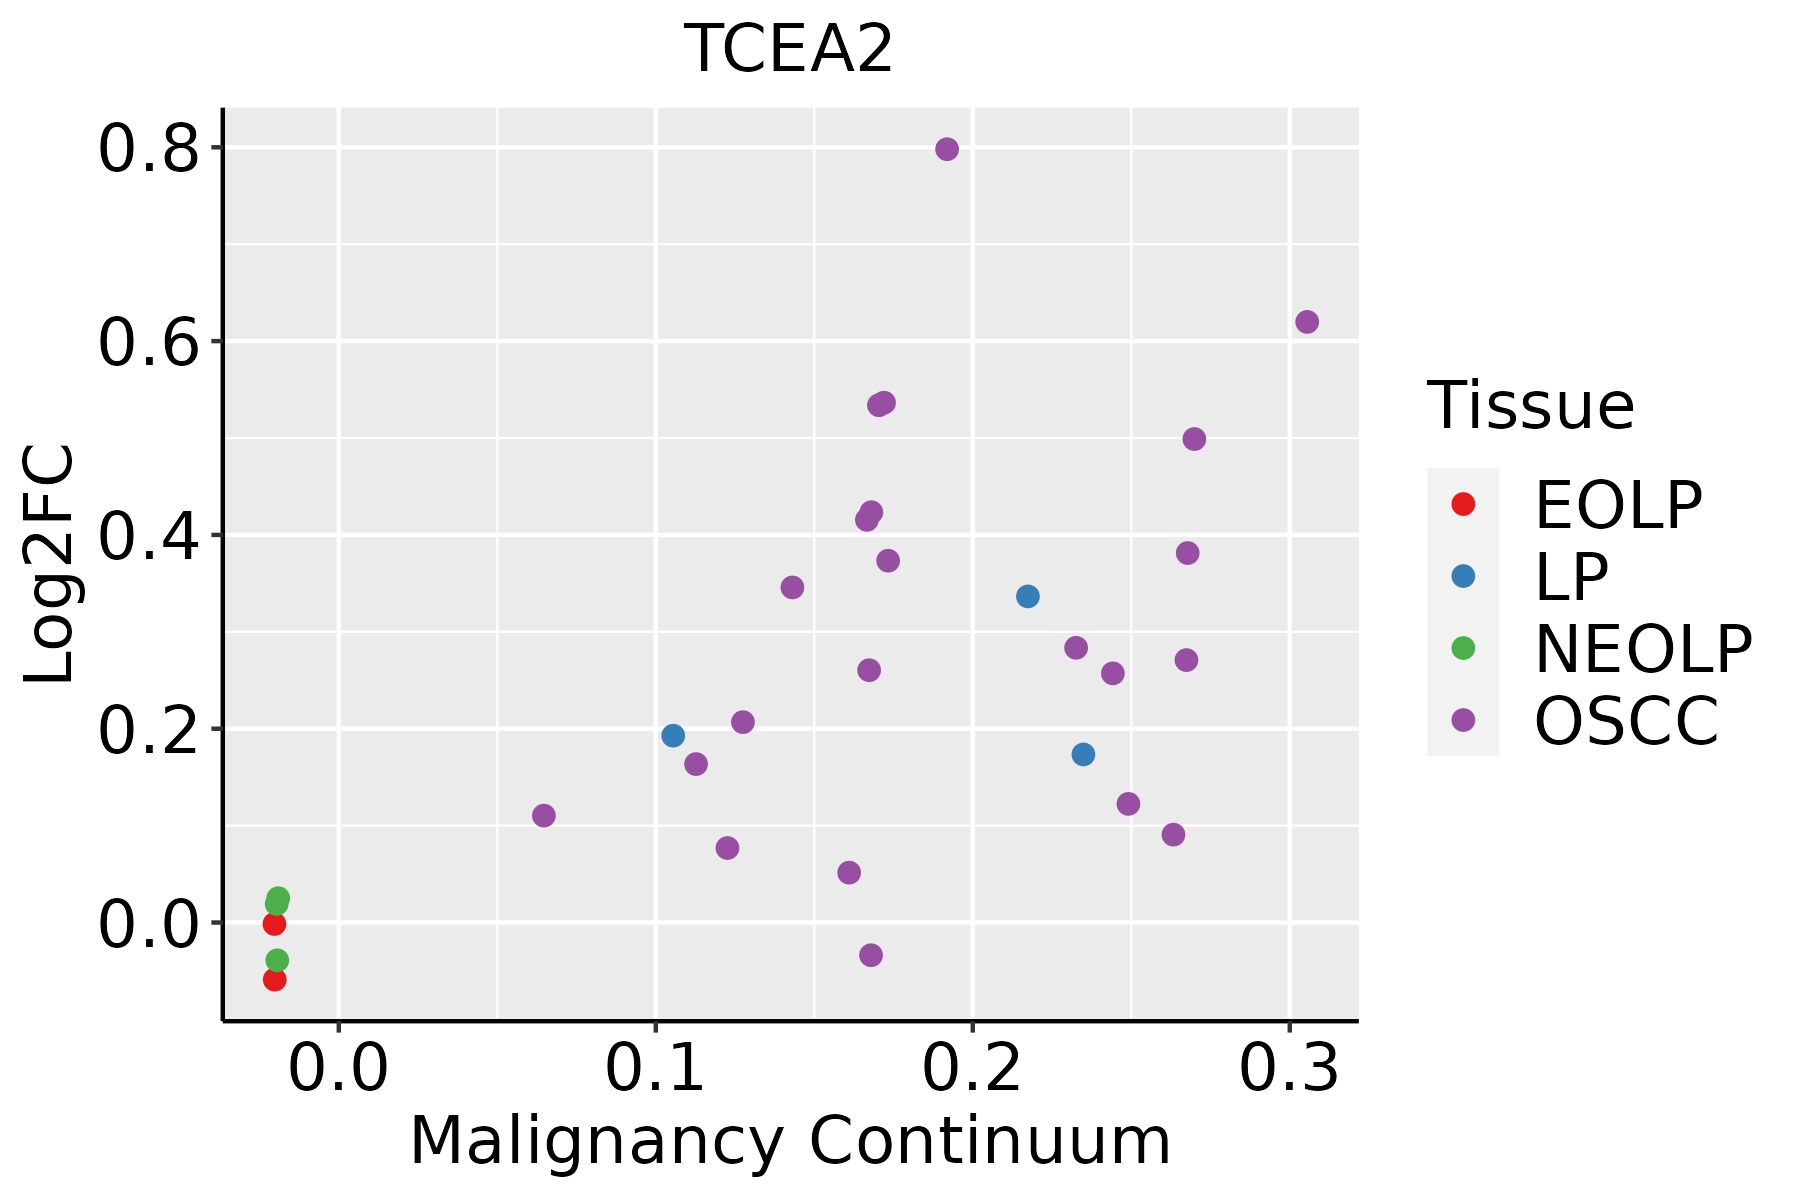 | EOLP: Erosive Oral lichen planus |
| LP: leukoplakia | ||
| NEOLP: Non-erosive oral lichen planus | ||
| OSCC: Oral squamous cell carcinoma | ||
| Thyroid | 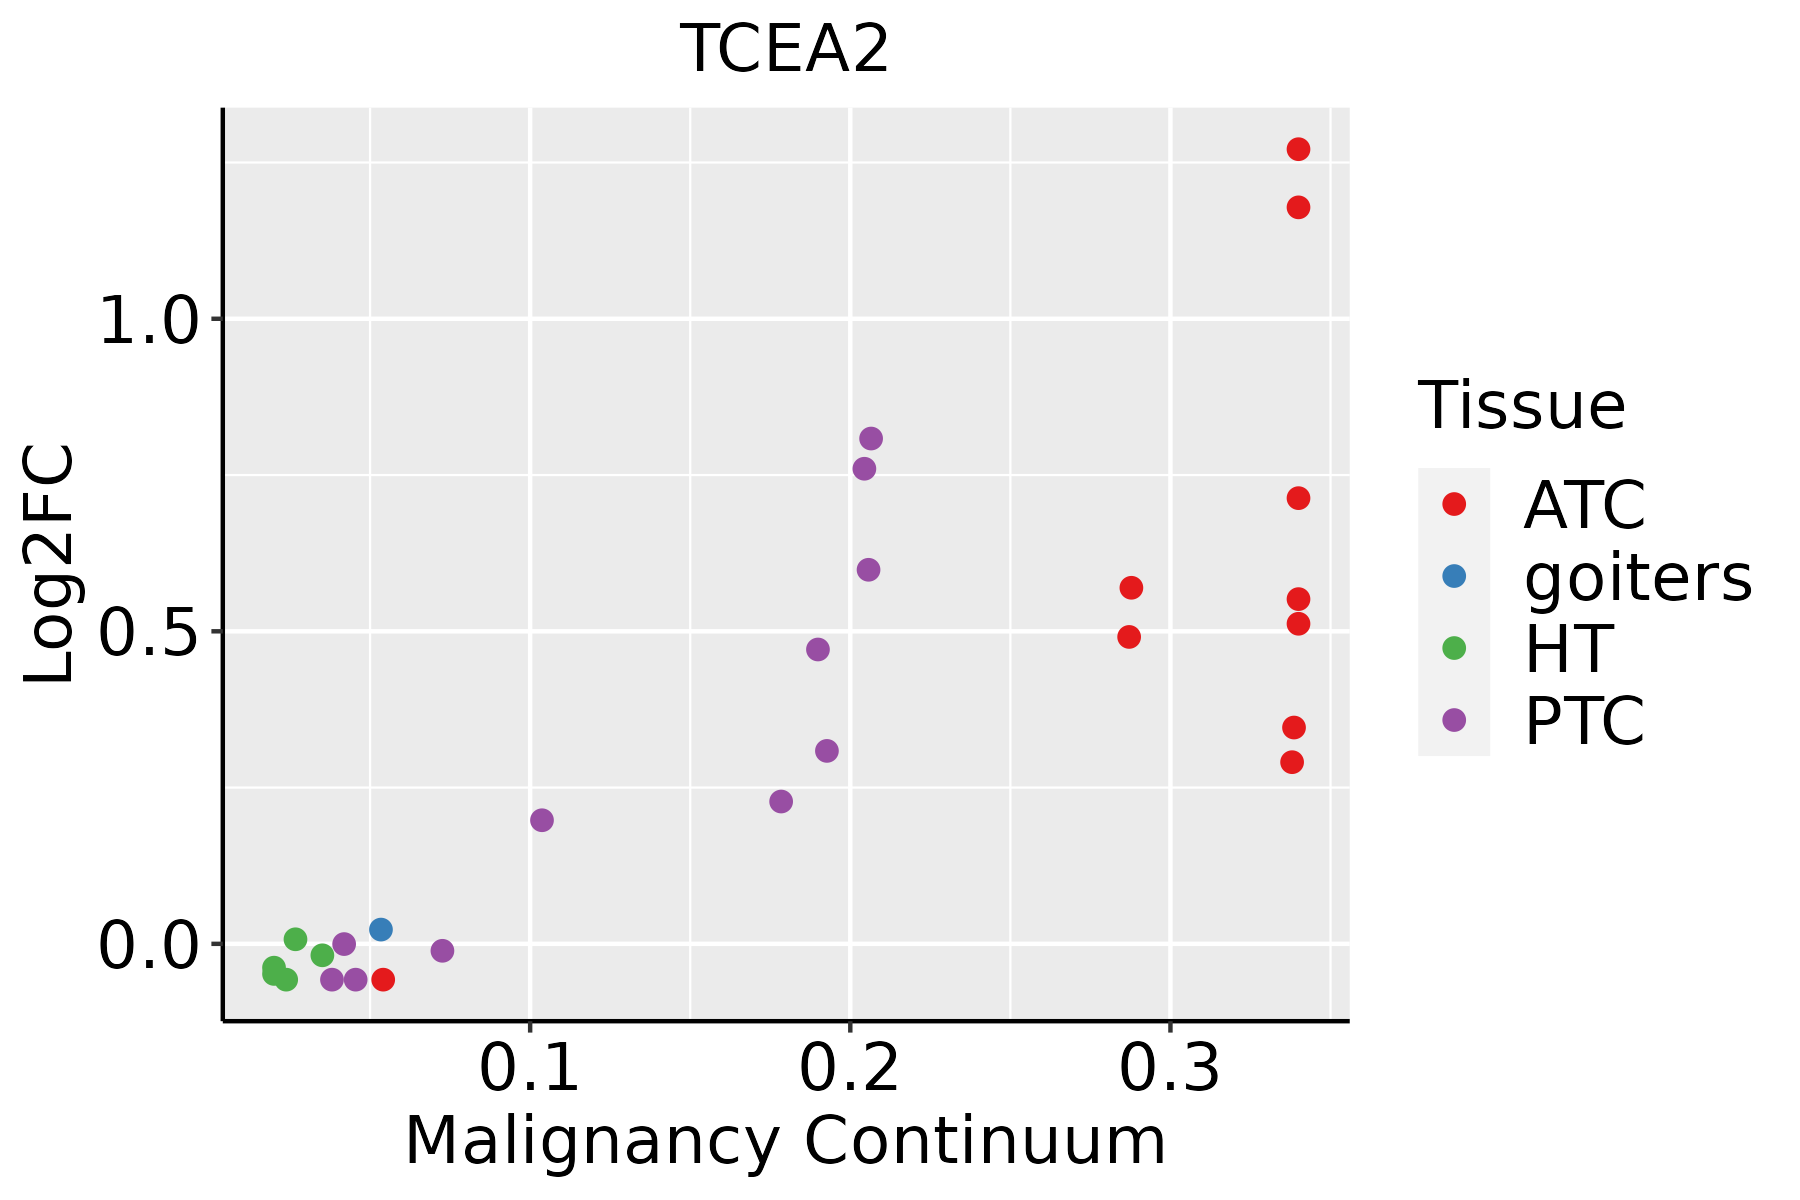 | ATC: Anaplastic thyroid cancer |
| HT: Hashimoto's thyroiditis | ||
| PTC: Papillary thyroid cancer |
| ∗log2FC in expression of this searched gene in stem-like cells from each diseased tissue sample relative to stem-like cells in normal samples in each tissue plotted against the malignancy continuum. Samples are colored based on if they are from different disease stage. |
Top |
Malignant transformation related pathway analysis |
| Find out the enriched GO biological processes and KEGG pathways involved in transition from healthy to precancer to cancer |
| Tissue | Disease Stage | Enriched GO biological Processes |
| Colorectum | AD |  |
| Colorectum | SER |  |
| Colorectum | MSS |  |
| Colorectum | MSI-H |  |
| Colorectum | FAP |  |
| ∗Top 15 enriched GO BP terms are showed in the bar plot of each disease state in each tissue. Each row represents a significant GO biological process which is colored according to the -log10(p.adjust). |
| Page: 1 2 3 4 5 6 7 8 9 |
| GO ID | Tissue | Disease Stage | Description | Gene Ratio | Bg Ratio | pvalue | p.adjust | Count |
| GO:000635414 | Esophagus | ESCC | DNA-templated transcription, elongation | 76/8552 | 91/18723 | 8.35e-14 | 4.11e-12 | 76 |
| GO:003278412 | Esophagus | ESCC | regulation of DNA-templated transcription, elongation | 45/8552 | 53/18723 | 3.64e-09 | 7.61e-08 | 45 |
| GO:00063544 | Liver | Cirrhotic | DNA-templated transcription, elongation | 35/4634 | 91/18723 | 2.56e-03 | 1.53e-02 | 35 |
| GO:000635411 | Liver | HCC | DNA-templated transcription, elongation | 64/7958 | 91/18723 | 7.00e-08 | 1.44e-06 | 64 |
| GO:0032784 | Liver | HCC | regulation of DNA-templated transcription, elongation | 39/7958 | 53/18723 | 4.34e-06 | 5.53e-05 | 39 |
| GO:00063547 | Oral cavity | OSCC | DNA-templated transcription, elongation | 63/7305 | 91/18723 | 4.86e-09 | 1.07e-07 | 63 |
| GO:00327843 | Oral cavity | OSCC | regulation of DNA-templated transcription, elongation | 36/7305 | 53/18723 | 1.89e-05 | 1.83e-04 | 36 |
| GO:000635416 | Thyroid | PTC | DNA-templated transcription, elongation | 62/5968 | 91/18723 | 1.30e-12 | 5.91e-11 | 62 |
| GO:00327846 | Thyroid | PTC | regulation of DNA-templated transcription, elongation | 38/5968 | 53/18723 | 3.07e-09 | 8.43e-08 | 38 |
| GO:000635421 | Thyroid | ATC | DNA-templated transcription, elongation | 63/6293 | 91/18723 | 3.89e-12 | 1.55e-10 | 63 |
| GO:003278414 | Thyroid | ATC | regulation of DNA-templated transcription, elongation | 39/6293 | 53/18723 | 3.04e-09 | 7.10e-08 | 39 |
| Page: 1 |
| Pathway ID | Tissue | Disease Stage | Description | Gene Ratio | Bg Ratio | pvalue | p.adjust | qvalue | Count |
| Page: 1 |
Top |
Cell-cell communication analysis |
| Identification of potential cell-cell interactions between two cell types and their ligand-receptor pairs for different disease states |
| Ligand | Receptor | LRpair | Pathway | Tissue | Disease Stage |
| Page: 1 |
Top |
Single-cell gene regulatory network inference analysis |
| Find out the significant the regulons (TFs) and the target genes of each regulon across cell types for different disease states |
| TF | Cell Type | Tissue | Disease Stage | Target Gene | RSS | Regulon Activity |
| ∗The dot plots of a searched regulon are shown for all cell subpopulations in each disease state of each tissue based on the regulon specific score inferred using pySCENIC and by calculating the average expression. |
| Page: 1 |
Top |
Somatic mutation of malignant transformation related genes |
| Annotation of somatic variants for genes involved in malignant transformation |
| Hugo Symbol | Variant Class | Variant Classification | dbSNP RS | HGVSc | HGVSp | HGVSp Short | SWISSPROT | BIOTYPE | SIFT | PolyPhen | Tumor Sample Barcode | Tissue | Histology | Sex | Age | Stage | Therapy Types | Drugs | Outcome |
| TCEA2 | SNV | Missense_Mutation | rs568253300 | c.169C>T | p.Arg57Trp | p.R57W | Q15560 | protein_coding | deleterious(0) | probably_damaging(0.999) | TCGA-AO-A128-01 | Breast | breast invasive carcinoma | Female | <65 | I/II | Chemotherapy | doxorubicin | SD |
| TCEA2 | SNV | Missense_Mutation | novel | c.868N>T | p.Asn290Tyr | p.N290Y | Q15560 | protein_coding | deleterious(0) | possibly_damaging(0.826) | TCGA-E2-A1LE-01 | Breast | breast invasive carcinoma | Female | >=65 | III/IV | Chemotherapy | herceptin | PD |
| TCEA2 | insertion | Frame_Shift_Ins | novel | c.852_853insGG | p.Thr285GlyfsTer67 | p.T285Gfs*67 | Q15560 | protein_coding | TCGA-A8-A079-01 | Breast | breast invasive carcinoma | Female | >=65 | III/IV | Chemotherapy | 5-fluorouracil | SD | ||
| TCEA2 | insertion | Frame_Shift_Ins | novel | c.853_854insTACTCAAGTCAGAGGGCCTGGCCTGGCCCAGC | p.Thr285IlefsTer77 | p.T285Ifs*77 | Q15560 | protein_coding | TCGA-A8-A079-01 | Breast | breast invasive carcinoma | Female | >=65 | III/IV | Chemotherapy | 5-fluorouracil | SD | ||
| TCEA2 | SNV | Missense_Mutation | novel | c.668C>T | p.Ser223Leu | p.S223L | Q15560 | protein_coding | deleterious(0.04) | benign(0.081) | TCGA-EK-A2R7-01 | Cervix | cervical & endocervical cancer | Female | <65 | I/II | Unknown | Unknown | SD |
| TCEA2 | SNV | Missense_Mutation | c.299N>G | p.Ser100Trp | p.S100W | Q15560 | protein_coding | deleterious(0) | probably_damaging(0.922) | TCGA-IR-A3LA-01 | Cervix | cervical & endocervical cancer | Female | <65 | I/II | Chemotherapy | cisplatin | CR | |
| TCEA2 | SNV | Missense_Mutation | rs373957561 | c.455N>T | p.Thr152Met | p.T152M | Q15560 | protein_coding | tolerated(0.17) | benign(0.305) | TCGA-5M-AAT6-01 | Colorectum | colon adenocarcinoma | Female | <65 | III/IV | Unknown | Unknown | PD |
| TCEA2 | SNV | Missense_Mutation | c.724N>A | p.Ala242Thr | p.A242T | Q15560 | protein_coding | deleterious(0.03) | possibly_damaging(0.868) | TCGA-A6-5665-01 | Colorectum | colon adenocarcinoma | Female | >=65 | I/II | Unknown | Unknown | PD | |
| TCEA2 | SNV | Missense_Mutation | c.38N>A | p.Arg13Gln | p.R13Q | Q15560 | protein_coding | deleterious(0.01) | benign(0.207) | TCGA-AA-3492-01 | Colorectum | colon adenocarcinoma | Female | >=65 | I/II | Unknown | Unknown | SD | |
| TCEA2 | SNV | Missense_Mutation | novel | c.94N>T | p.Arg32Trp | p.R32W | Q15560 | protein_coding | deleterious(0) | probably_damaging(0.952) | TCGA-AA-3877-01 | Colorectum | colon adenocarcinoma | Female | >=65 | I/II | Unknown | Unknown | SD |
| Page: 1 2 3 4 |
Top |
Related drugs of malignant transformation related genes |
| Identification of chemicals and drugs interact with genes involved in malignant transfromation |
| (DGIdb 4.0) |
| Entrez ID | Symbol | Category | Interaction Types | Drug Claim Name | Drug Name | PMIDs |
| Page: 1 |

Copyright 2023-Present -The University of Texas Health Science Center at Houston |