
|
|||||
|
 | |
| |
| |
| |
| |
| |
|
Gene: TBC1D9B |
Gene summary for TBC1D9B |
| Gene information | Species | Human | Gene symbol | TBC1D9B | Gene ID | 23061 |
| Gene name | TBC1 domain family member 9B | |
| Gene Alias | GRAMD9B | |
| Cytomap | 5q35.3 | |
| Gene Type | protein-coding | GO ID | GO:0006810 | UniProtAcc | B3KM54 |
Top |
Malignant transformation analysis |
| Identification of the aberrant gene expression in precancerous and cancerous lesions by comparing the gene expression of stem-like cells in diseased tissues with normal stem cells |
| Entrez ID | Symbol | Replicates | Species | Organ | Tissue | Adj P-value | Log2FC | Malignancy |
| 23061 | TBC1D9B | P22T-E | Human | Esophagus | ESCC | 8.16e-33 | 4.82e-01 | 0.1236 |
| 23061 | TBC1D9B | P23T-E | Human | Esophagus | ESCC | 1.79e-17 | 5.26e-01 | 0.108 |
| 23061 | TBC1D9B | P24T-E | Human | Esophagus | ESCC | 2.33e-18 | 2.53e-01 | 0.1287 |
| 23061 | TBC1D9B | P26T-E | Human | Esophagus | ESCC | 4.44e-19 | 3.30e-01 | 0.1276 |
| 23061 | TBC1D9B | P27T-E | Human | Esophagus | ESCC | 1.10e-29 | 2.63e-01 | 0.1055 |
| 23061 | TBC1D9B | P28T-E | Human | Esophagus | ESCC | 5.84e-35 | 6.10e-01 | 0.1149 |
| 23061 | TBC1D9B | P30T-E | Human | Esophagus | ESCC | 5.92e-20 | 5.33e-01 | 0.137 |
| 23061 | TBC1D9B | P31T-E | Human | Esophagus | ESCC | 1.63e-15 | 2.65e-01 | 0.1251 |
| 23061 | TBC1D9B | P32T-E | Human | Esophagus | ESCC | 3.46e-15 | 1.94e-01 | 0.1666 |
| 23061 | TBC1D9B | P36T-E | Human | Esophagus | ESCC | 7.31e-14 | 4.76e-01 | 0.1187 |
| 23061 | TBC1D9B | P37T-E | Human | Esophagus | ESCC | 2.55e-15 | 3.45e-01 | 0.1371 |
| 23061 | TBC1D9B | P38T-E | Human | Esophagus | ESCC | 1.04e-10 | 4.54e-01 | 0.127 |
| 23061 | TBC1D9B | P39T-E | Human | Esophagus | ESCC | 8.31e-06 | 2.34e-01 | 0.0894 |
| 23061 | TBC1D9B | P40T-E | Human | Esophagus | ESCC | 5.79e-13 | 3.39e-01 | 0.109 |
| 23061 | TBC1D9B | P42T-E | Human | Esophagus | ESCC | 7.53e-12 | 3.05e-01 | 0.1175 |
| 23061 | TBC1D9B | P44T-E | Human | Esophagus | ESCC | 1.75e-14 | 2.68e-01 | 0.1096 |
| 23061 | TBC1D9B | P47T-E | Human | Esophagus | ESCC | 1.12e-13 | 2.48e-01 | 0.1067 |
| 23061 | TBC1D9B | P48T-E | Human | Esophagus | ESCC | 1.38e-17 | 3.30e-01 | 0.0959 |
| 23061 | TBC1D9B | P49T-E | Human | Esophagus | ESCC | 1.34e-08 | 1.12e+00 | 0.1768 |
| 23061 | TBC1D9B | P52T-E | Human | Esophagus | ESCC | 1.79e-25 | 5.38e-01 | 0.1555 |
| Page: 1 2 3 4 5 6 |
| Tissue | Expression Dynamics | Abbreviation |
| Esophagus | 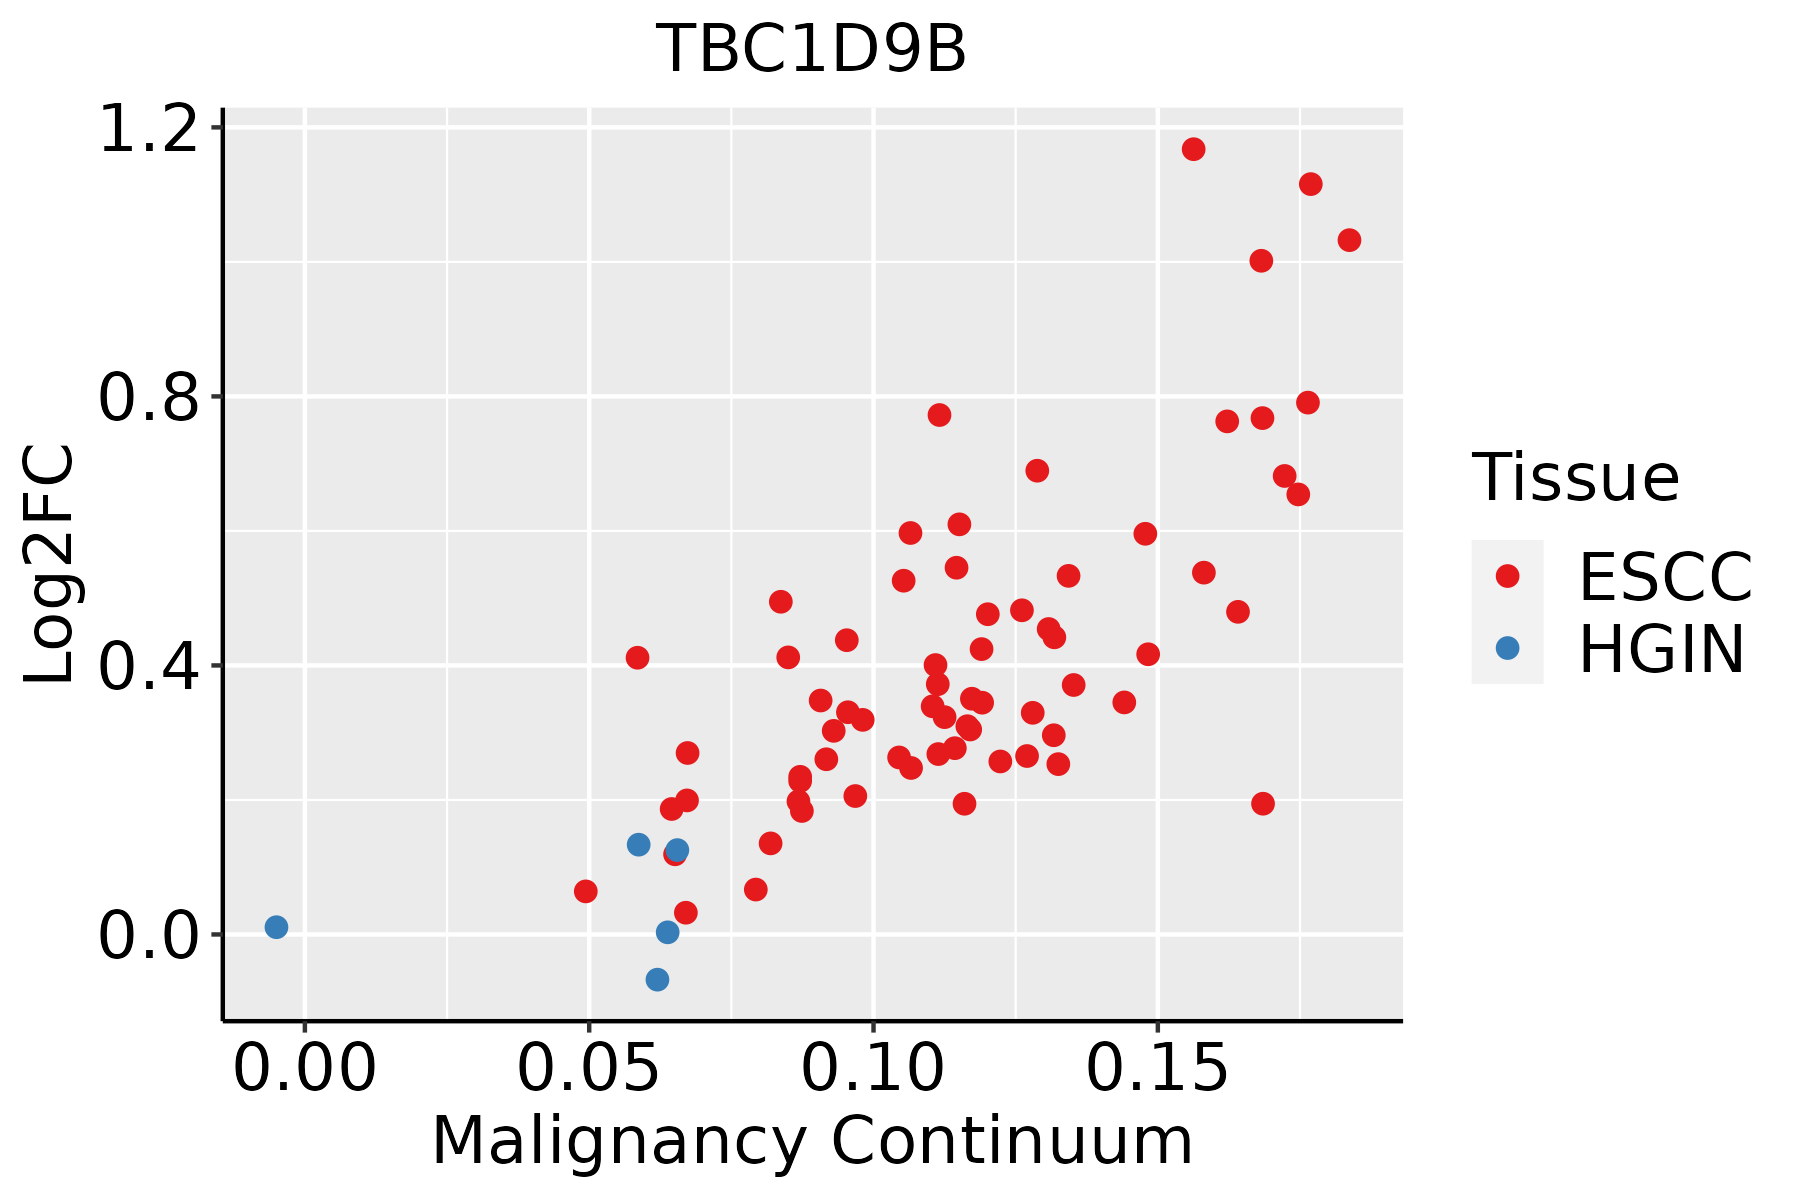 | ESCC: Esophageal squamous cell carcinoma |
| HGIN: High-grade intraepithelial neoplasias | ||
| LGIN: Low-grade intraepithelial neoplasias | ||
| Liver | 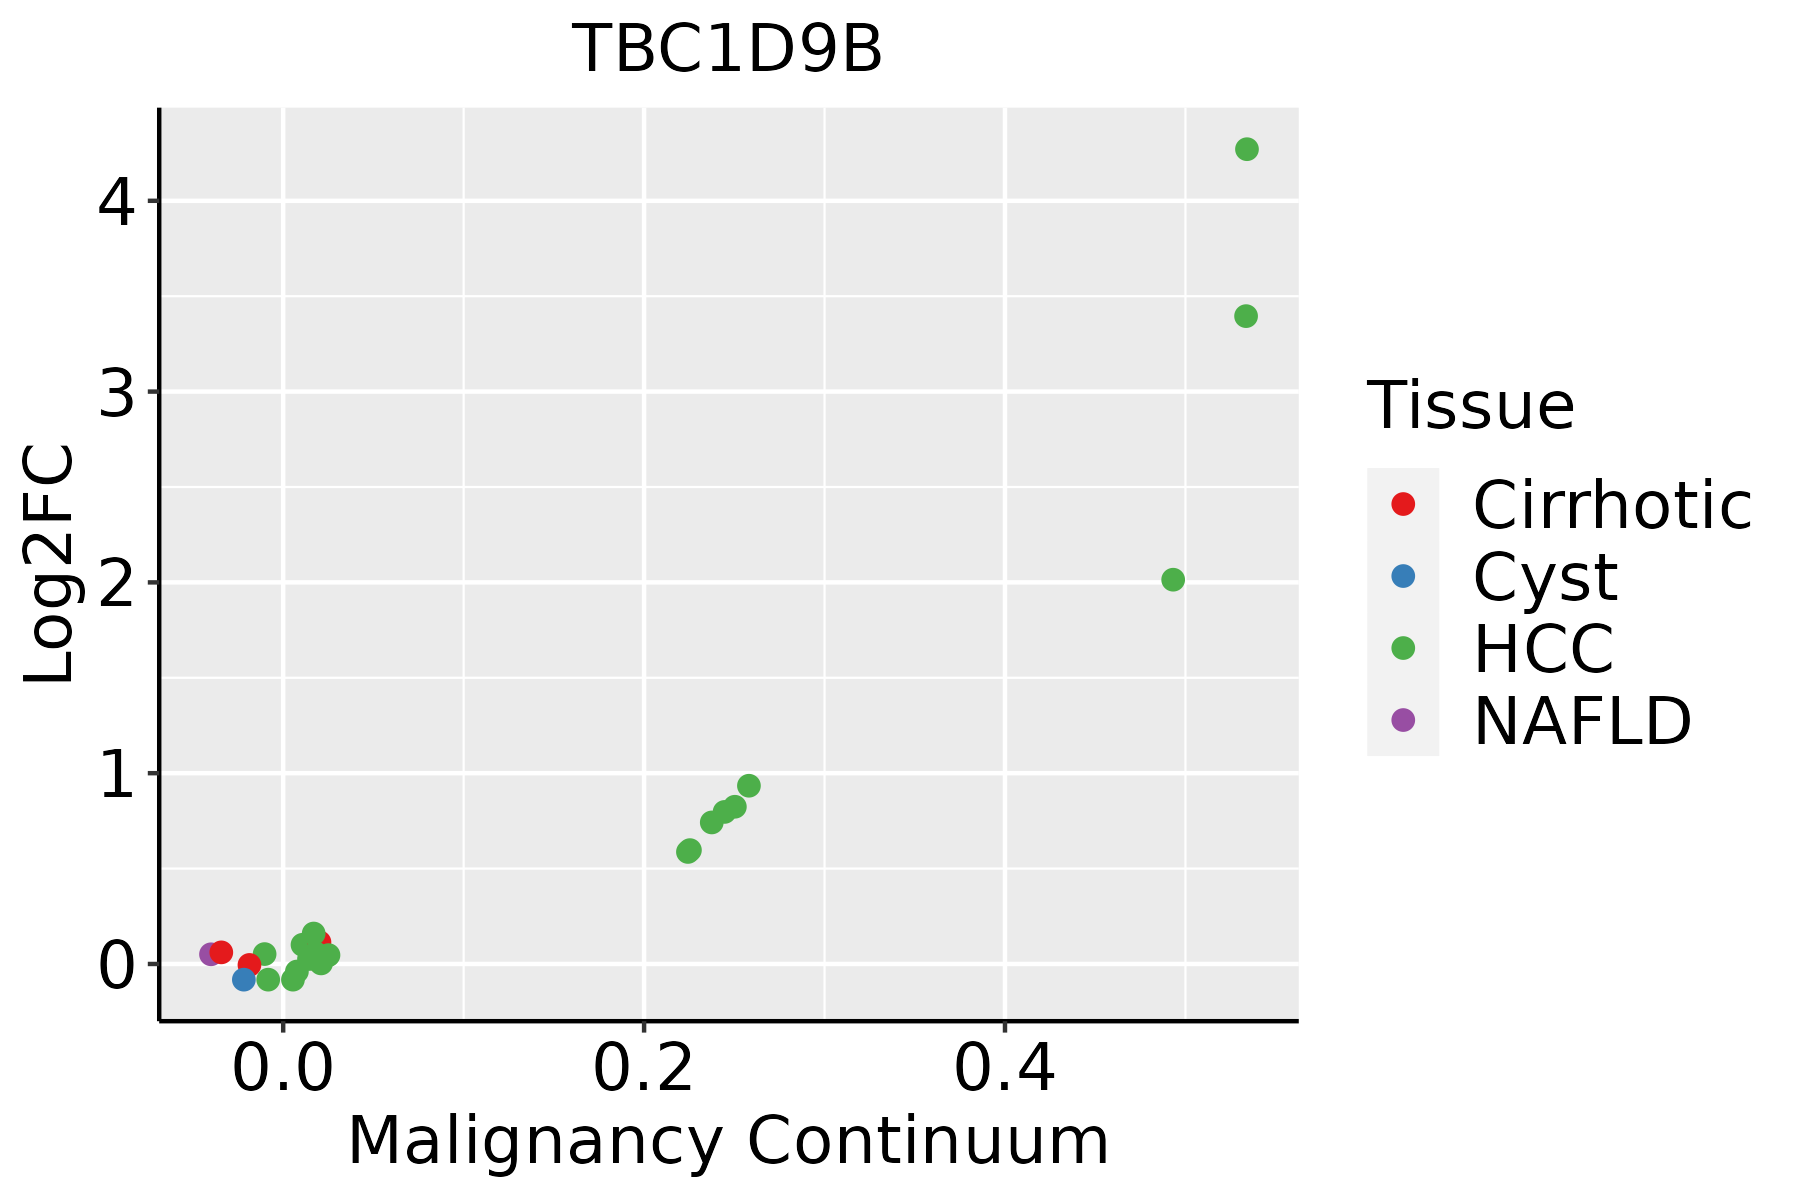 | HCC: Hepatocellular carcinoma |
| NAFLD: Non-alcoholic fatty liver disease | ||
| Oral Cavity | 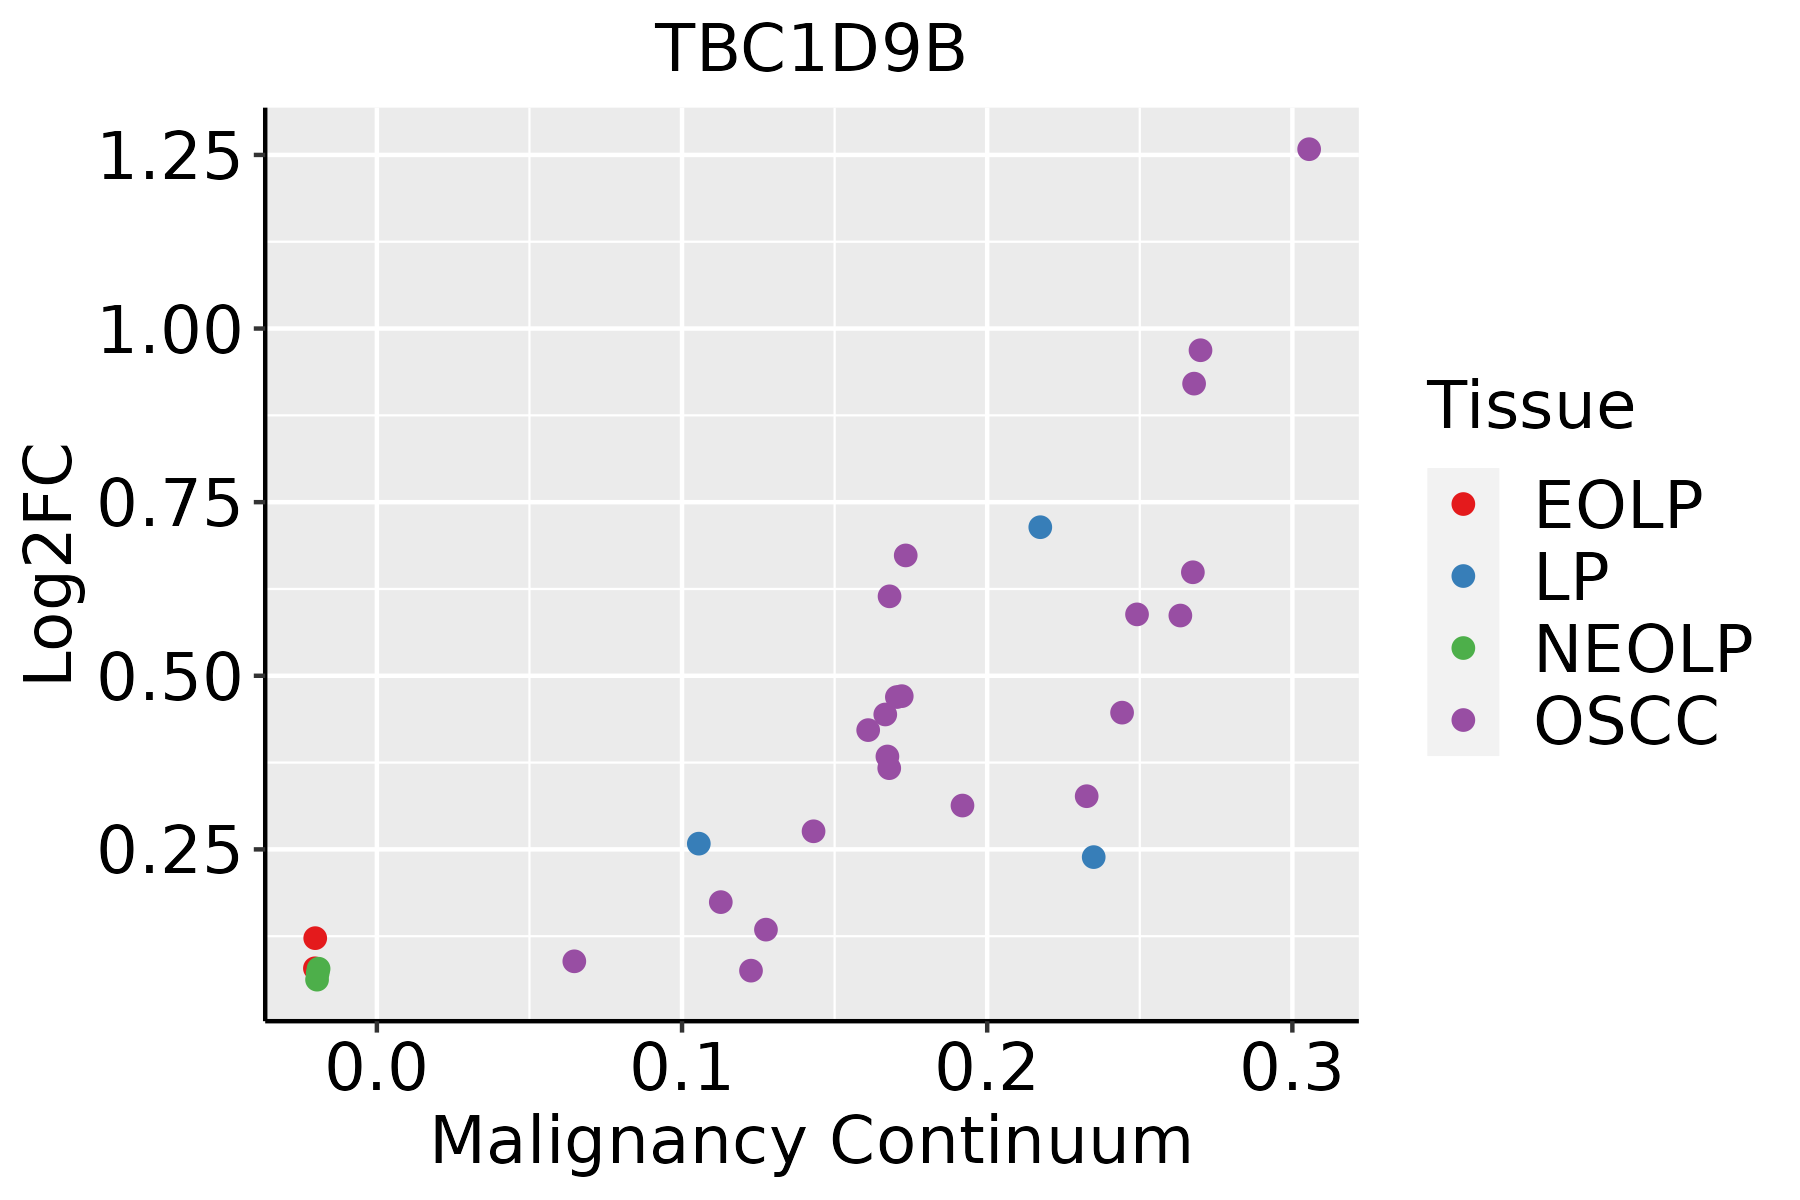 | EOLP: Erosive Oral lichen planus |
| LP: leukoplakia | ||
| NEOLP: Non-erosive oral lichen planus | ||
| OSCC: Oral squamous cell carcinoma | ||
| Prostate | 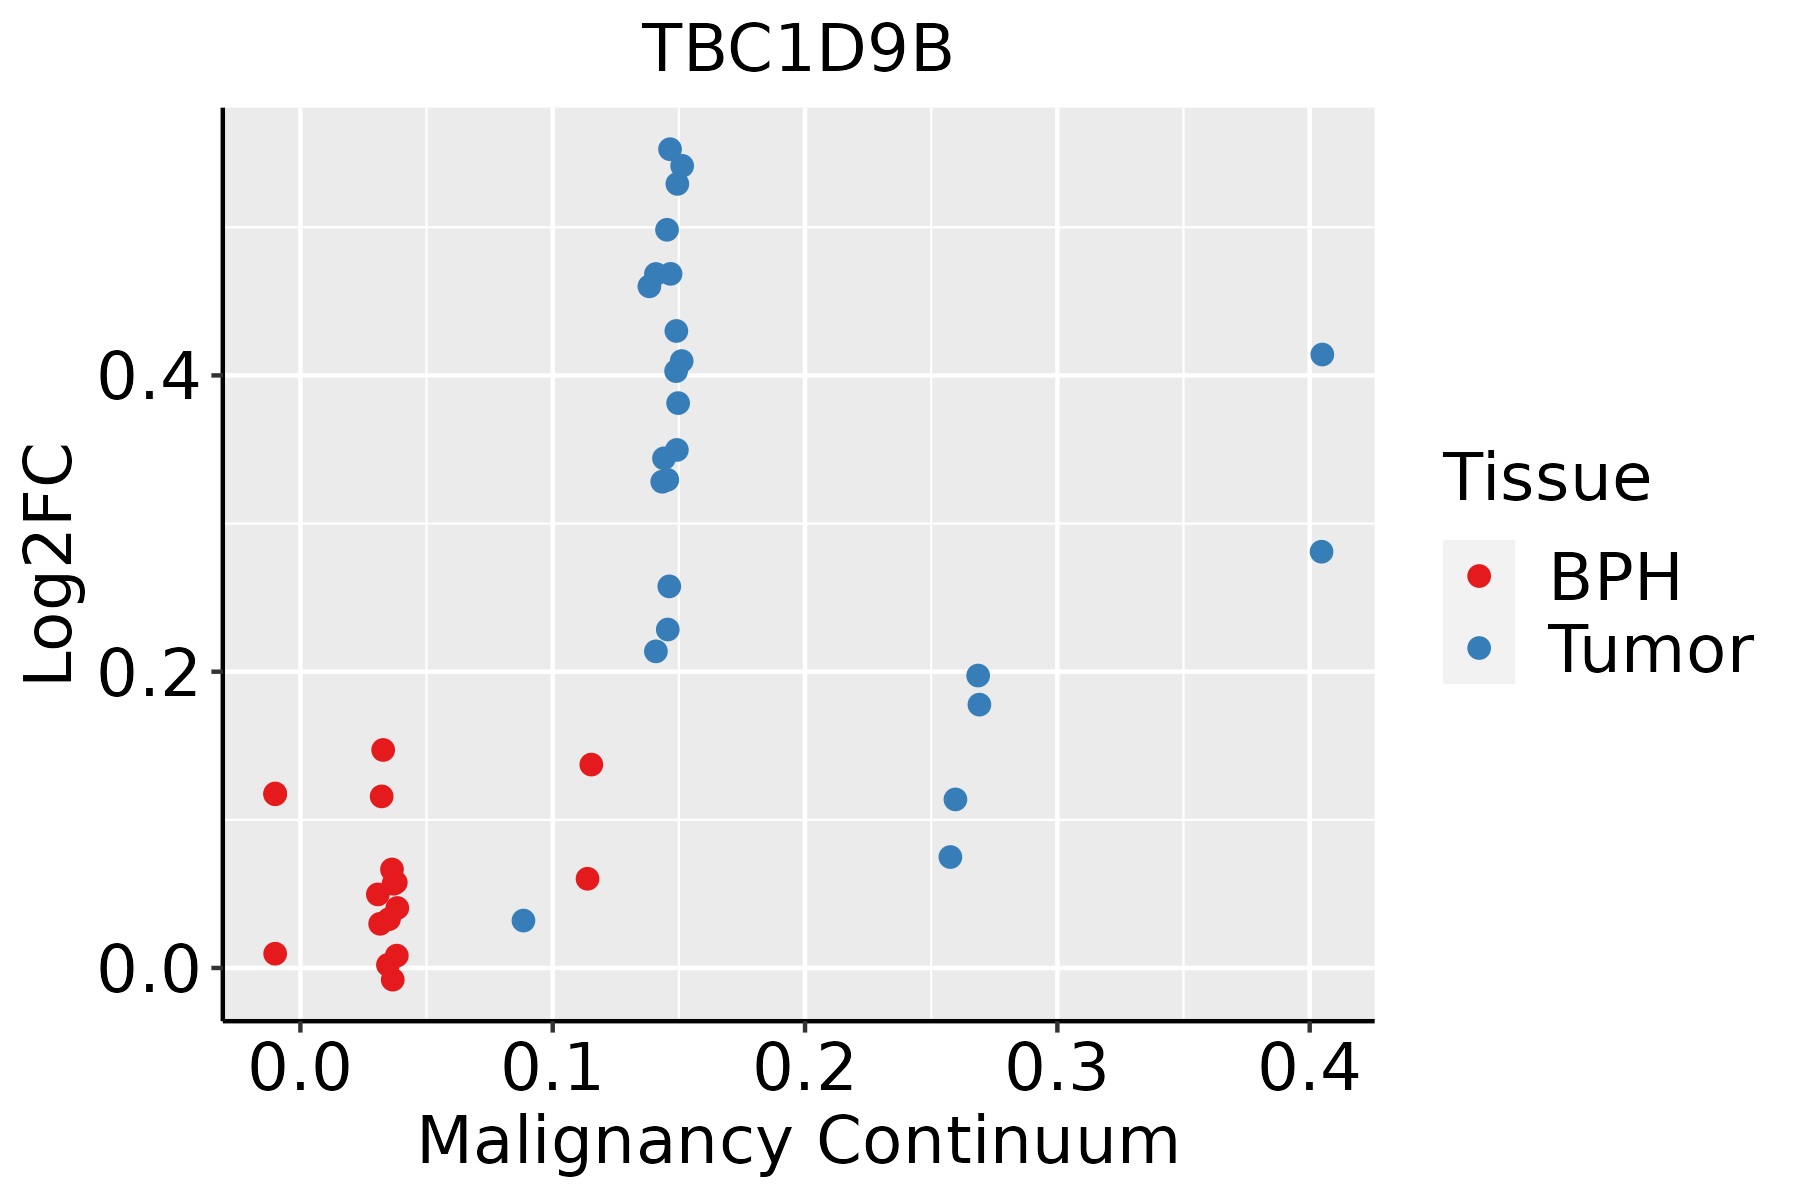 | BPH: Benign Prostatic Hyperplasia |
| Skin |  | AK: Actinic keratosis |
| cSCC: Cutaneous squamous cell carcinoma | ||
| SCCIS:squamous cell carcinoma in situ | ||
| Thyroid | 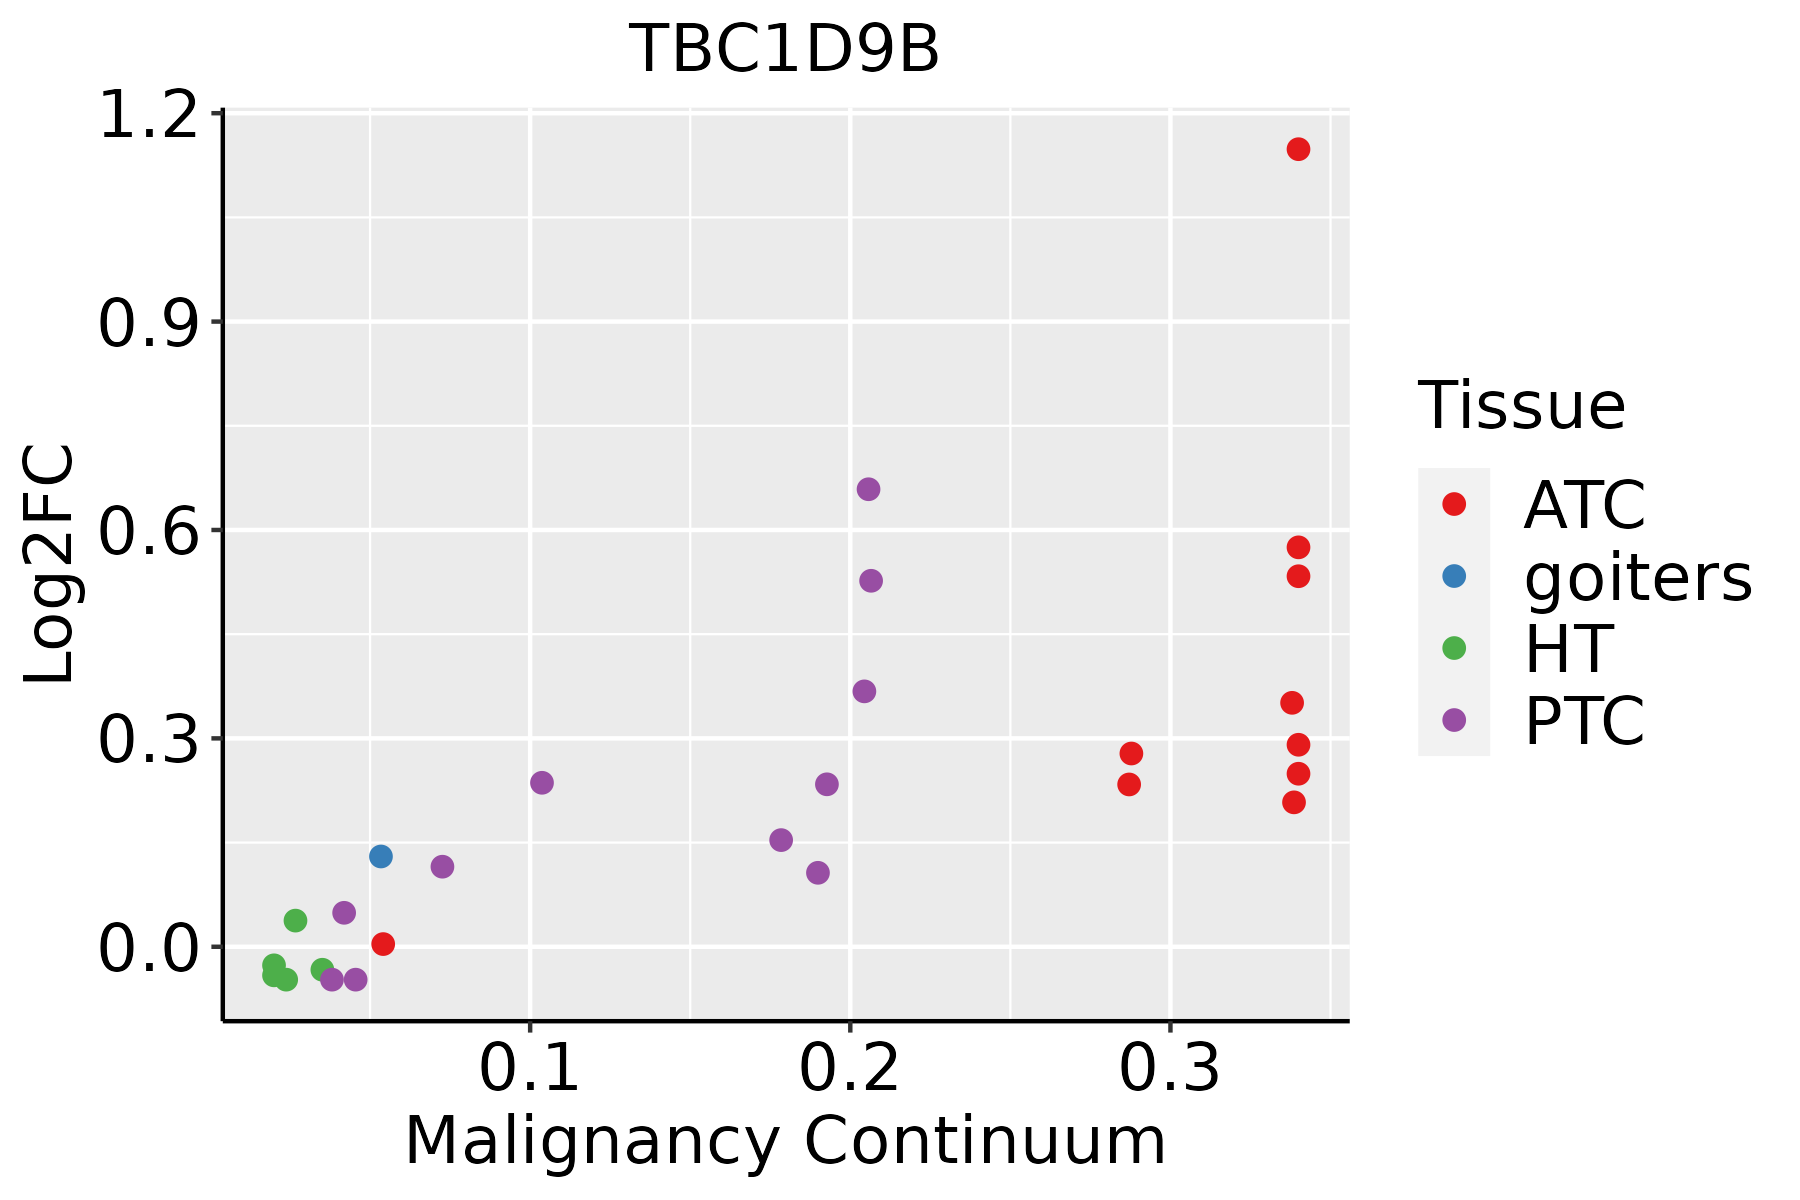 | ATC: Anaplastic thyroid cancer |
| HT: Hashimoto's thyroiditis | ||
| PTC: Papillary thyroid cancer |
| ∗log2FC in expression of this searched gene in stem-like cells from each diseased tissue sample relative to stem-like cells in normal samples in each tissue plotted against the malignancy continuum. Samples are colored based on if they are from different disease stage. |
Top |
Malignant transformation related pathway analysis |
| Find out the enriched GO biological processes and KEGG pathways involved in transition from healthy to precancer to cancer |
| Tissue | Disease Stage | Enriched GO biological Processes |
| Colorectum | AD |  |
| Colorectum | SER |  |
| Colorectum | MSS |  |
| Colorectum | MSI-H |  |
| Colorectum | FAP |  |
| ∗Top 15 enriched GO BP terms are showed in the bar plot of each disease state in each tissue. Each row represents a significant GO biological process which is colored according to the -log10(p.adjust). |
| Page: 1 2 3 4 5 6 7 8 9 |
| GO ID | Tissue | Disease Stage | Description | Gene Ratio | Bg Ratio | pvalue | p.adjust | Count |
| GO:004308715 | Esophagus | ESCC | regulation of GTPase activity | 183/8552 | 348/18723 | 5.34e-03 | 2.00e-02 | 183 |
| GO:004308710 | Oral cavity | OSCC | regulation of GTPase activity | 165/7305 | 348/18723 | 7.94e-04 | 4.27e-03 | 165 |
| GO:004308713 | Prostate | Tumor | regulation of GTPase activity | 88/3246 | 348/18723 | 1.04e-04 | 1.00e-03 | 88 |
| GO:004354713 | Prostate | Tumor | positive regulation of GTPase activity | 60/3246 | 255/18723 | 6.87e-03 | 3.11e-02 | 60 |
| GO:004308718 | Thyroid | PTC | regulation of GTPase activity | 148/5968 | 348/18723 | 1.63e-05 | 1.71e-04 | 148 |
| GO:004354714 | Thyroid | PTC | positive regulation of GTPase activity | 103/5968 | 255/18723 | 2.38e-03 | 1.25e-02 | 103 |
| GO:004308719 | Thyroid | ATC | regulation of GTPase activity | 153/6293 | 348/18723 | 3.24e-05 | 2.68e-04 | 153 |
| GO:004354715 | Thyroid | ATC | positive regulation of GTPase activity | 106/6293 | 255/18723 | 4.58e-03 | 1.89e-02 | 106 |
| Page: 1 |
| Pathway ID | Tissue | Disease Stage | Description | Gene Ratio | Bg Ratio | pvalue | p.adjust | qvalue | Count |
| Page: 1 |
Top |
Cell-cell communication analysis |
| Identification of potential cell-cell interactions between two cell types and their ligand-receptor pairs for different disease states |
| Ligand | Receptor | LRpair | Pathway | Tissue | Disease Stage |
| Page: 1 |
Top |
Single-cell gene regulatory network inference analysis |
| Find out the significant the regulons (TFs) and the target genes of each regulon across cell types for different disease states |
| TF | Cell Type | Tissue | Disease Stage | Target Gene | RSS | Regulon Activity |
| ∗The dot plots of a searched regulon are shown for all cell subpopulations in each disease state of each tissue based on the regulon specific score inferred using pySCENIC and by calculating the average expression. |
| Page: 1 |
Top |
Somatic mutation of malignant transformation related genes |
| Annotation of somatic variants for genes involved in malignant transformation |
| Hugo Symbol | Variant Class | Variant Classification | dbSNP RS | HGVSc | HGVSp | HGVSp Short | SWISSPROT | BIOTYPE | SIFT | PolyPhen | Tumor Sample Barcode | Tissue | Histology | Sex | Age | Stage | Therapy Types | Drugs | Outcome |
| TBC1D9B | SNV | Missense_Mutation | novel | c.3460N>G | p.Met1154Val | p.M1154V | Q66K14 | protein_coding | tolerated_low_confidence(0.5) | benign(0) | TCGA-A7-A3IZ-01 | Breast | breast invasive carcinoma | Female | <65 | I/II | Chemotherapy | cytoxan | SD |
| TBC1D9B | SNV | Missense_Mutation | rs775909263 | c.1927N>A | p.Glu643Lys | p.E643K | Q66K14 | protein_coding | deleterious(0) | probably_damaging(0.993) | TCGA-AN-A046-01 | Breast | breast invasive carcinoma | Female | >=65 | I/II | Unknown | Unknown | SD |
| TBC1D9B | SNV | Missense_Mutation | rs756398026 | c.2656C>T | p.Arg886Cys | p.R886C | Q66K14 | protein_coding | deleterious(0) | probably_damaging(0.996) | TCGA-AN-A0AK-01 | Breast | breast invasive carcinoma | Female | >=65 | I/II | Unknown | Unknown | SD |
| TBC1D9B | SNV | Missense_Mutation | c.970T>C | p.Phe324Leu | p.F324L | Q66K14 | protein_coding | tolerated(0.06) | possibly_damaging(0.5) | TCGA-AN-A0AK-01 | Breast | breast invasive carcinoma | Female | >=65 | I/II | Unknown | Unknown | SD | |
| TBC1D9B | SNV | Missense_Mutation | novel | c.2167G>T | p.Ala723Ser | p.A723S | Q66K14 | protein_coding | deleterious(0) | probably_damaging(0.998) | TCGA-BH-A0BZ-01 | Breast | breast invasive carcinoma | Female | <65 | III/IV | Chemotherapy | doxorubicin | CR |
| TBC1D9B | SNV | Missense_Mutation | novel | c.2965N>C | p.Glu989Gln | p.E989Q | Q66K14 | protein_coding | tolerated(0.23) | benign(0.018) | TCGA-D8-A73X-01 | Breast | breast invasive carcinoma | Female | <65 | I/II | Hormone Therapy | tamoxiphen | SD |
| TBC1D9B | SNV | Missense_Mutation | novel | c.2740G>T | p.Gly914Trp | p.G914W | Q66K14 | protein_coding | deleterious(0) | probably_damaging(1) | TCGA-LL-A7SZ-01 | Breast | breast invasive carcinoma | Female | <65 | I/II | Chemotherapy | adriamycin | CR |
| TBC1D9B | insertion | Frame_Shift_Ins | novel | c.1586_1587insCCTCCCCAGCAGCTGCACC | p.Thr530LeufsTer14 | p.T530Lfs*14 | Q66K14 | protein_coding | TCGA-AQ-A04J-01 | Breast | breast invasive carcinoma | Female | <65 | I/II | Chemotherapy | cytoxan | SD | ||
| TBC1D9B | insertion | Frame_Shift_Ins | novel | c.3316_3317insTCCGTGCTGGTGA | p.Asp1106ValfsTer44 | p.D1106Vfs*44 | Q66K14 | protein_coding | TCGA-B6-A0IB-01 | Breast | breast invasive carcinoma | Female | <65 | III/IV | Unknown | Unknown | PD | ||
| TBC1D9B | deletion | Frame_Shift_Del | novel | c.3165delN | p.Ser1056AlafsTer153 | p.S1056Afs*153 | Q66K14 | protein_coding | TCGA-EW-A2FV-01 | Breast | breast invasive carcinoma | Female | <65 | III/IV | Chemotherapy | docetaxel | SD |
| Page: 1 2 3 4 5 6 7 8 9 10 11 |
Top |
Related drugs of malignant transformation related genes |
| Identification of chemicals and drugs interact with genes involved in malignant transfromation |
| (DGIdb 4.0) |
| Entrez ID | Symbol | Category | Interaction Types | Drug Claim Name | Drug Name | PMIDs |
| Page: 1 |

Copyright 2023-Present -The University of Texas Health Science Center at Houston |