
|
|||||
|
 | |
| |
| |
| |
| |
| |
|
Gene: TAF10 |
Gene summary for TAF10 |
| Gene information | Species | Human | Gene symbol | TAF10 | Gene ID | 6881 |
| Gene name | TATA-box binding protein associated factor 10 | |
| Gene Alias | TAF2A | |
| Cytomap | 11p15.4 | |
| Gene Type | protein-coding | GO ID | GO:0000082 | UniProtAcc | Q12962 |
Top |
Malignant transformation analysis |
| Identification of the aberrant gene expression in precancerous and cancerous lesions by comparing the gene expression of stem-like cells in diseased tissues with normal stem cells |
| Entrez ID | Symbol | Replicates | Species | Organ | Tissue | Adj P-value | Log2FC | Malignancy |
| 6881 | TAF10 | P16T-E | Human | Esophagus | ESCC | 1.47e-08 | 1.37e-01 | 0.1153 |
| 6881 | TAF10 | P17T-E | Human | Esophagus | ESCC | 1.82e-13 | 5.06e-01 | 0.1278 |
| 6881 | TAF10 | P19T-E | Human | Esophagus | ESCC | 1.00e-03 | 4.56e-01 | 0.1662 |
| 6881 | TAF10 | P20T-E | Human | Esophagus | ESCC | 2.17e-18 | 4.92e-01 | 0.1124 |
| 6881 | TAF10 | P21T-E | Human | Esophagus | ESCC | 9.62e-17 | 4.48e-01 | 0.1617 |
| 6881 | TAF10 | P22T-E | Human | Esophagus | ESCC | 1.73e-55 | 9.84e-01 | 0.1236 |
| 6881 | TAF10 | P23T-E | Human | Esophagus | ESCC | 1.39e-33 | 8.68e-01 | 0.108 |
| 6881 | TAF10 | P24T-E | Human | Esophagus | ESCC | 2.82e-19 | 5.24e-01 | 0.1287 |
| 6881 | TAF10 | P26T-E | Human | Esophagus | ESCC | 6.19e-37 | 6.83e-01 | 0.1276 |
| 6881 | TAF10 | P27T-E | Human | Esophagus | ESCC | 9.90e-18 | 3.78e-01 | 0.1055 |
| 6881 | TAF10 | P28T-E | Human | Esophagus | ESCC | 2.99e-82 | 1.90e+00 | 0.1149 |
| 6881 | TAF10 | P30T-E | Human | Esophagus | ESCC | 1.89e-13 | 3.89e-01 | 0.137 |
| 6881 | TAF10 | P31T-E | Human | Esophagus | ESCC | 4.36e-20 | 3.85e-01 | 0.1251 |
| 6881 | TAF10 | P32T-E | Human | Esophagus | ESCC | 1.97e-54 | 1.15e+00 | 0.1666 |
| 6881 | TAF10 | P36T-E | Human | Esophagus | ESCC | 3.52e-07 | 3.32e-01 | 0.1187 |
| 6881 | TAF10 | P37T-E | Human | Esophagus | ESCC | 1.19e-22 | 6.00e-01 | 0.1371 |
| 6881 | TAF10 | P38T-E | Human | Esophagus | ESCC | 5.24e-09 | 4.29e-01 | 0.127 |
| 6881 | TAF10 | P39T-E | Human | Esophagus | ESCC | 1.80e-38 | 6.99e-01 | 0.0894 |
| 6881 | TAF10 | P40T-E | Human | Esophagus | ESCC | 9.18e-43 | 1.00e+00 | 0.109 |
| 6881 | TAF10 | P42T-E | Human | Esophagus | ESCC | 1.01e-12 | 3.75e-01 | 0.1175 |
| Page: 1 2 3 4 5 6 7 |
| Tissue | Expression Dynamics | Abbreviation |
| Cervix |  | CC: Cervix cancer |
| HSIL_HPV: HPV-infected high-grade squamous intraepithelial lesions | ||
| N_HPV: HPV-infected normal cervix | ||
| Esophagus |  | ESCC: Esophageal squamous cell carcinoma |
| HGIN: High-grade intraepithelial neoplasias | ||
| LGIN: Low-grade intraepithelial neoplasias | ||
| Liver |  | HCC: Hepatocellular carcinoma |
| NAFLD: Non-alcoholic fatty liver disease | ||
| Oral Cavity |  | EOLP: Erosive Oral lichen planus |
| LP: leukoplakia | ||
| NEOLP: Non-erosive oral lichen planus | ||
| OSCC: Oral squamous cell carcinoma | ||
| Prostate | 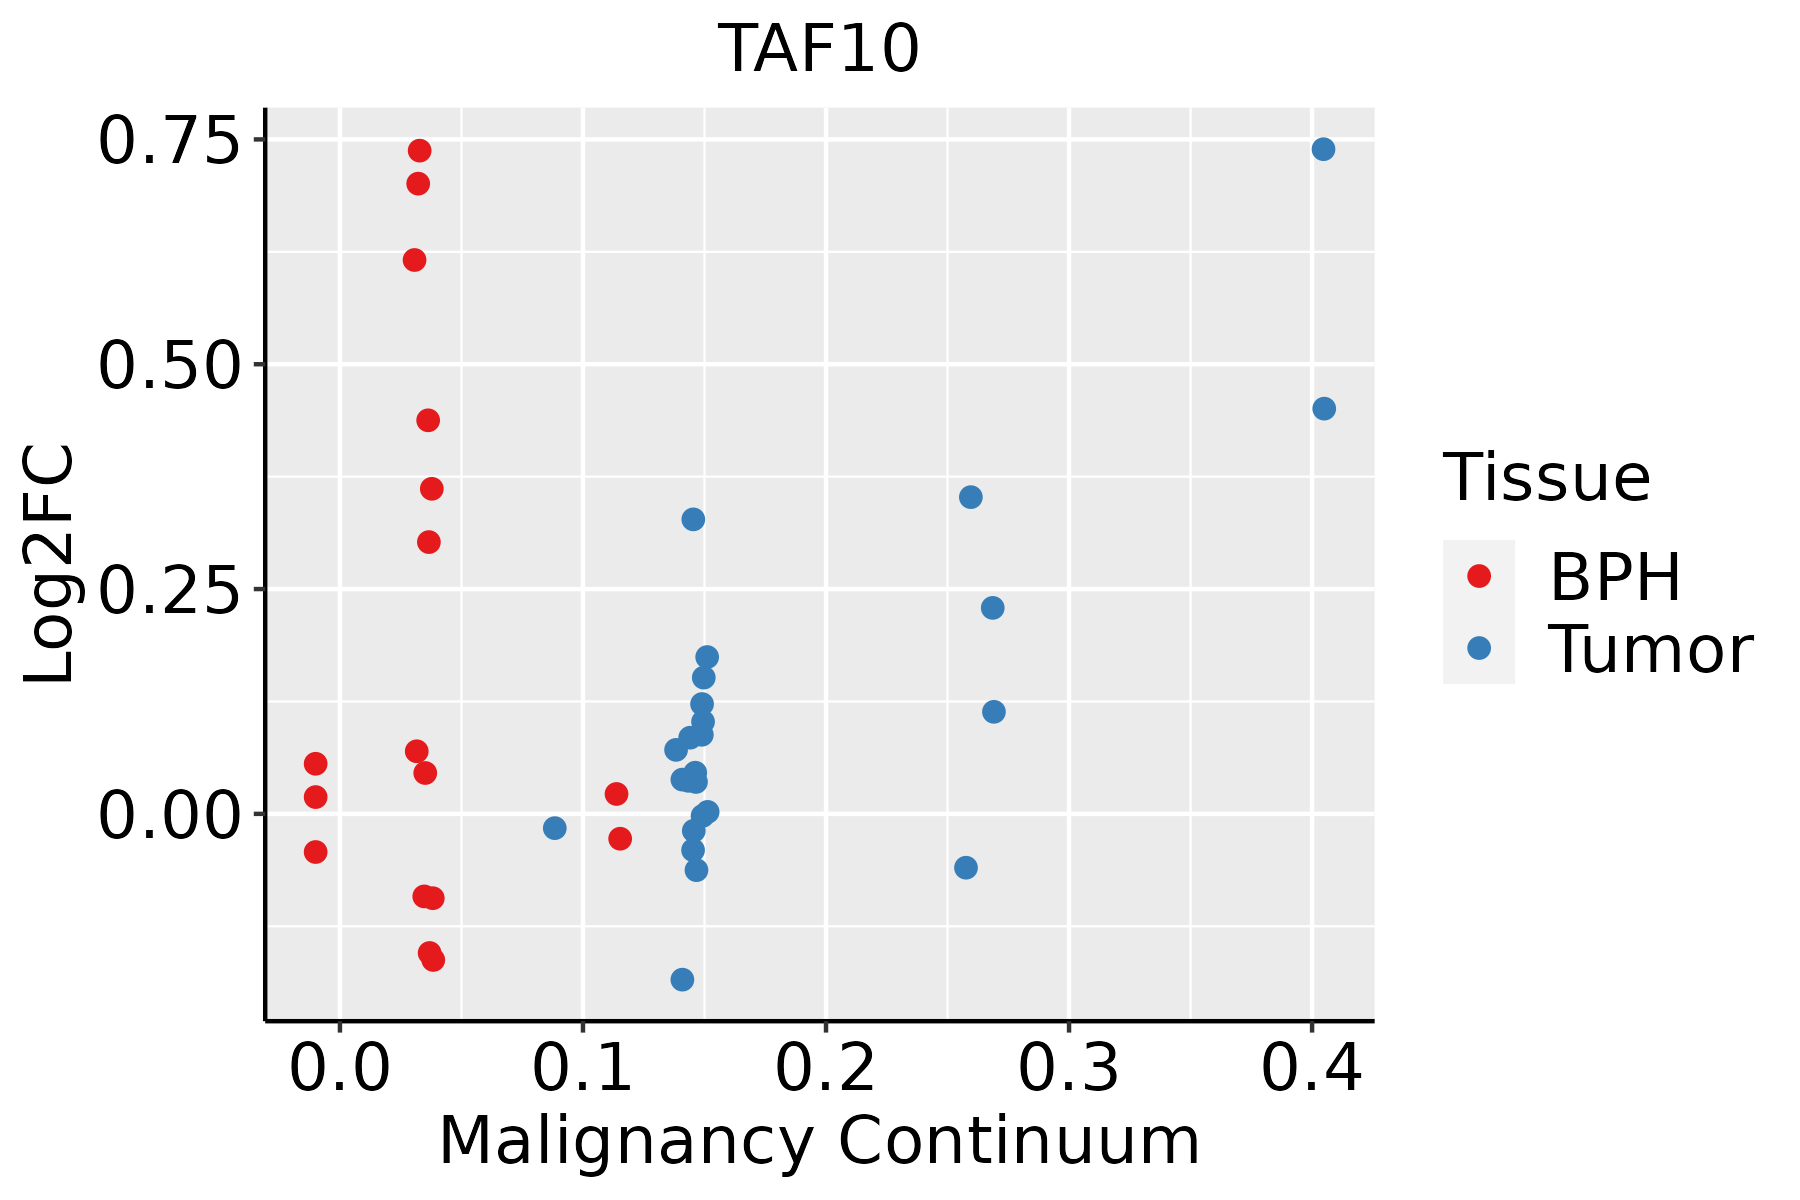 | BPH: Benign Prostatic Hyperplasia |
| Skin | 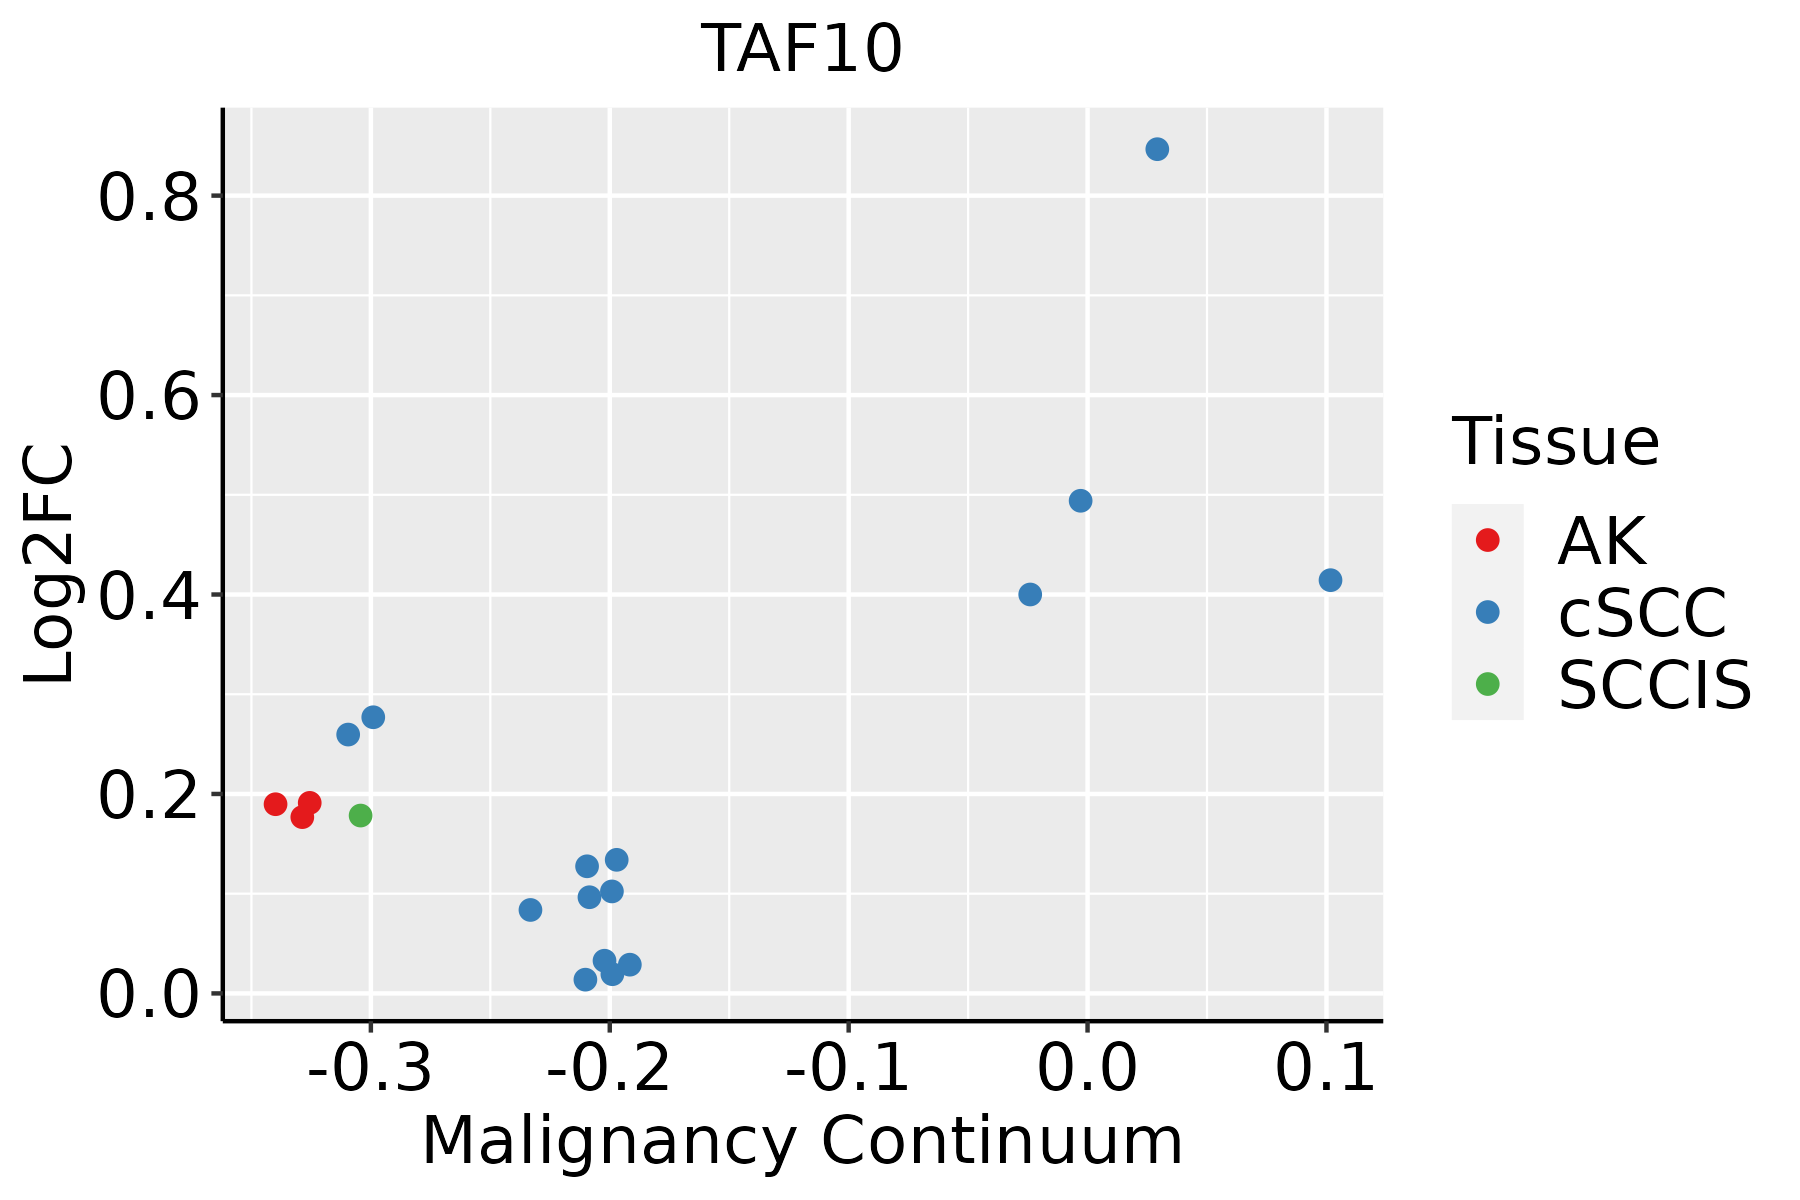 | AK: Actinic keratosis |
| cSCC: Cutaneous squamous cell carcinoma | ||
| SCCIS:squamous cell carcinoma in situ | ||
| Thyroid | 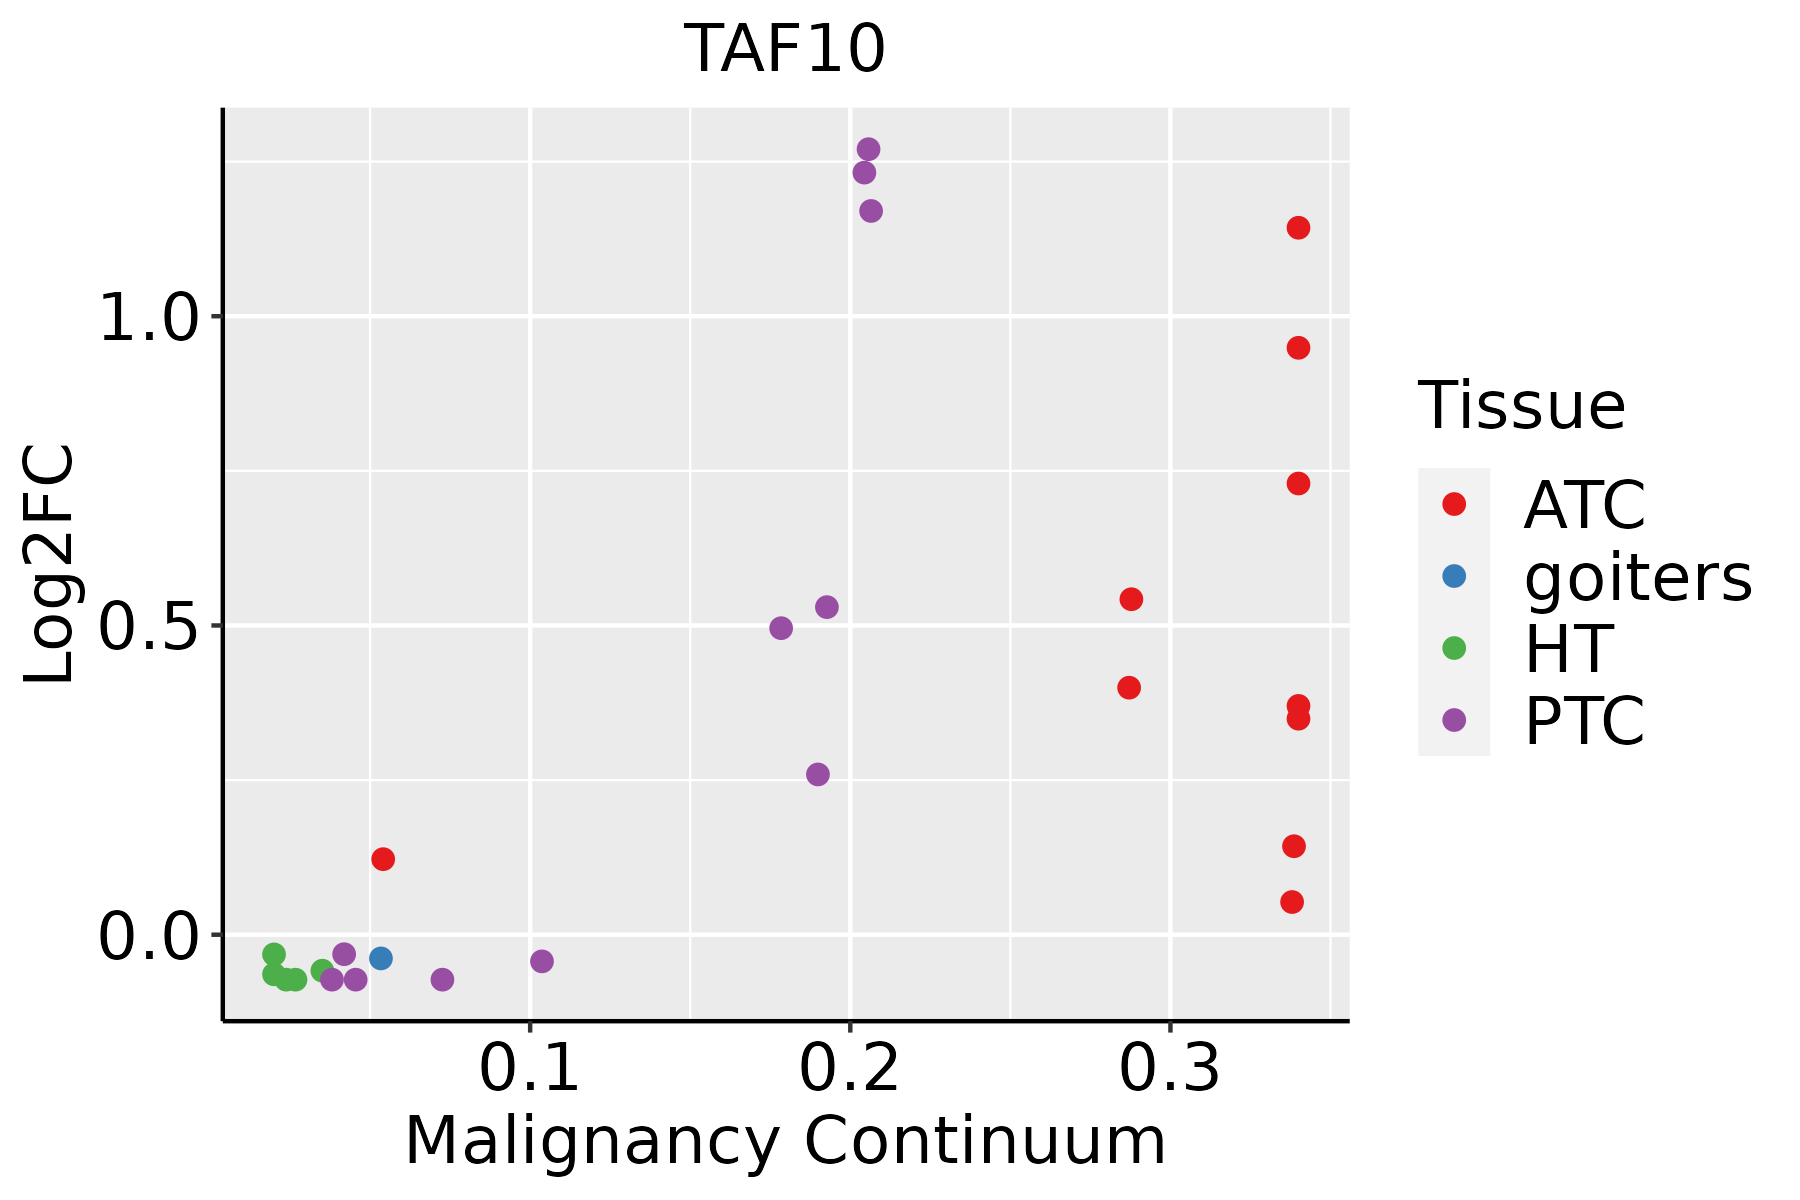 | ATC: Anaplastic thyroid cancer |
| HT: Hashimoto's thyroiditis | ||
| PTC: Papillary thyroid cancer |
| ∗log2FC in expression of this searched gene in stem-like cells from each diseased tissue sample relative to stem-like cells in normal samples in each tissue plotted against the malignancy continuum. Samples are colored based on if they are from different disease stage. |
Top |
Malignant transformation related pathway analysis |
| Find out the enriched GO biological processes and KEGG pathways involved in transition from healthy to precancer to cancer |
| Tissue | Disease Stage | Enriched GO biological Processes |
| Colorectum | AD |  |
| Colorectum | SER |  |
| Colorectum | MSS |  |
| Colorectum | MSI-H |  |
| Colorectum | FAP |  |
| ∗Top 15 enriched GO BP terms are showed in the bar plot of each disease state in each tissue. Each row represents a significant GO biological process which is colored according to the -log10(p.adjust). |
| Page: 1 2 3 4 5 6 7 8 9 |
| GO ID | Tissue | Disease Stage | Description | Gene Ratio | Bg Ratio | pvalue | p.adjust | Count |
| GO:005109810 | Cervix | CC | regulation of binding | 80/2311 | 363/18723 | 1.32e-07 | 6.42e-06 | 80 |
| GO:00447725 | Cervix | CC | mitotic cell cycle phase transition | 89/2311 | 424/18723 | 2.70e-07 | 1.12e-05 | 89 |
| GO:00000824 | Cervix | CC | G1/S transition of mitotic cell cycle | 49/2311 | 214/18723 | 1.16e-05 | 2.48e-04 | 49 |
| GO:00448434 | Cervix | CC | cell cycle G1/S phase transition | 53/2311 | 241/18723 | 1.76e-05 | 3.32e-04 | 53 |
| GO:004873210 | Cervix | CC | gland development | 84/2311 | 436/18723 | 1.93e-05 | 3.54e-04 | 84 |
| GO:005110110 | Cervix | CC | regulation of DNA binding | 31/2311 | 118/18723 | 2.91e-05 | 4.81e-04 | 31 |
| GO:00165705 | Cervix | CC | histone modification | 84/2311 | 463/18723 | 1.70e-04 | 2.01e-03 | 84 |
| GO:00610089 | Cervix | CC | hepaticobiliary system development | 34/2311 | 150/18723 | 2.92e-04 | 3.14e-03 | 34 |
| GO:00018899 | Cervix | CC | liver development | 33/2311 | 147/18723 | 4.27e-04 | 4.30e-03 | 33 |
| GO:00182054 | Cervix | CC | peptidyl-lysine modification | 62/2311 | 376/18723 | 1.04e-02 | 4.97e-02 | 62 |
| GO:005109815 | Cervix | N_HPV | regulation of binding | 26/534 | 363/18723 | 1.75e-05 | 5.22e-04 | 26 |
| GO:005110115 | Cervix | N_HPV | regulation of DNA binding | 12/534 | 118/18723 | 1.41e-04 | 2.64e-03 | 12 |
| GO:000188914 | Cervix | N_HPV | liver development | 13/534 | 147/18723 | 3.06e-04 | 4.69e-03 | 13 |
| GO:006100814 | Cervix | N_HPV | hepaticobiliary system development | 13/534 | 150/18723 | 3.72e-04 | 5.41e-03 | 13 |
| GO:004873215 | Cervix | N_HPV | gland development | 25/534 | 436/18723 | 7.93e-04 | 9.90e-03 | 25 |
| GO:004477212 | Cervix | N_HPV | mitotic cell cycle phase transition | 22/534 | 424/18723 | 5.33e-03 | 3.84e-02 | 22 |
| GO:001657015 | Esophagus | ESCC | histone modification | 323/8552 | 463/18723 | 2.61e-26 | 7.88e-24 | 323 |
| GO:001820514 | Esophagus | ESCC | peptidyl-lysine modification | 259/8552 | 376/18723 | 3.90e-20 | 5.26e-18 | 259 |
| GO:0051098111 | Esophagus | ESCC | regulation of binding | 251/8552 | 363/18723 | 6.73e-20 | 8.46e-18 | 251 |
| GO:004477216 | Esophagus | ESCC | mitotic cell cycle phase transition | 281/8552 | 424/18723 | 4.63e-18 | 4.45e-16 | 281 |
| Page: 1 2 3 4 5 6 7 8 9 10 11 12 |
| Pathway ID | Tissue | Disease Stage | Description | Gene Ratio | Bg Ratio | pvalue | p.adjust | qvalue | Count |
| hsa030222 | Esophagus | ESCC | Basal transcription factors | 35/4205 | 45/8465 | 1.01e-04 | 4.06e-04 | 2.08e-04 | 35 |
| hsa0302211 | Esophagus | ESCC | Basal transcription factors | 35/4205 | 45/8465 | 1.01e-04 | 4.06e-04 | 2.08e-04 | 35 |
| hsa03022 | Oral cavity | OSCC | Basal transcription factors | 28/3704 | 45/8465 | 9.53e-03 | 2.11e-02 | 1.08e-02 | 28 |
| hsa030221 | Oral cavity | OSCC | Basal transcription factors | 28/3704 | 45/8465 | 9.53e-03 | 2.11e-02 | 1.08e-02 | 28 |
| Page: 1 |
Top |
Cell-cell communication analysis |
| Identification of potential cell-cell interactions between two cell types and their ligand-receptor pairs for different disease states |
| Ligand | Receptor | LRpair | Pathway | Tissue | Disease Stage |
| Page: 1 |
Top |
Single-cell gene regulatory network inference analysis |
| Find out the significant the regulons (TFs) and the target genes of each regulon across cell types for different disease states |
| TF | Cell Type | Tissue | Disease Stage | Target Gene | RSS | Regulon Activity |
| ∗The dot plots of a searched regulon are shown for all cell subpopulations in each disease state of each tissue based on the regulon specific score inferred using pySCENIC and by calculating the average expression. |
| Page: 1 |
Top |
Somatic mutation of malignant transformation related genes |
| Annotation of somatic variants for genes involved in malignant transformation |
| Hugo Symbol | Variant Class | Variant Classification | dbSNP RS | HGVSc | HGVSp | HGVSp Short | SWISSPROT | BIOTYPE | SIFT | PolyPhen | Tumor Sample Barcode | Tissue | Histology | Sex | Age | Stage | Therapy Types | Drugs | Outcome |
| TAF10 | SNV | Missense_Mutation | novel | c.538G>A | p.Ala180Thr | p.A180T | Q12962 | protein_coding | deleterious(0.04) | benign(0.184) | TCGA-BH-A8FZ-01 | Breast | breast invasive carcinoma | Female | <65 | I/II | Unknown | Unknown | SD |
| TAF10 | SNV | Missense_Mutation | c.627C>G | p.Ile209Met | p.I209M | Q12962 | protein_coding | deleterious(0.02) | possibly_damaging(0.826) | TCGA-C5-A3HE-01 | Cervix | cervical & endocervical cancer | Female | <65 | I/II | Unknown | Unknown | PD | |
| TAF10 | SNV | Missense_Mutation | novel | c.449N>A | p.Arg150His | p.R150H | Q12962 | protein_coding | deleterious(0.03) | possibly_damaging(0.886) | TCGA-VS-A953-01 | Cervix | cervical & endocervical cancer | Female | <65 | I/II | Unknown | Unknown | PD |
| TAF10 | SNV | Missense_Mutation | c.572N>A | p.Arg191His | p.R191H | Q12962 | protein_coding | deleterious(0.04) | probably_damaging(0.917) | TCGA-AA-3663-01 | Colorectum | colon adenocarcinoma | Male | <65 | I/II | Unknown | Unknown | SD | |
| TAF10 | SNV | Missense_Mutation | novel | c.482A>C | p.Lys161Thr | p.K161T | Q12962 | protein_coding | deleterious(0) | probably_damaging(0.997) | TCGA-F5-6814-01 | Colorectum | rectum adenocarcinoma | Male | <65 | I/II | Unknown | Unknown | SD |
| TAF10 | SNV | Missense_Mutation | novel | c.499N>A | p.Ala167Thr | p.A167T | Q12962 | protein_coding | deleterious(0.02) | possibly_damaging(0.665) | TCGA-A5-A0G2-01 | Endometrium | uterine corpus endometrioid carcinoma | Female | <65 | III/IV | Unknown | Unknown | SD |
| TAF10 | SNV | Missense_Mutation | novel | c.595N>A | p.Asp199Asn | p.D199N | Q12962 | protein_coding | deleterious(0) | probably_damaging(0.999) | TCGA-AP-A059-01 | Endometrium | uterine corpus endometrioid carcinoma | Female | >=65 | I/II | Unknown | Unknown | SD |
| TAF10 | SNV | Missense_Mutation | novel | c.511N>A | p.Leu171Ile | p.L171I | Q12962 | protein_coding | deleterious(0.01) | possibly_damaging(0.906) | TCGA-AP-A0LS-01 | Endometrium | uterine corpus endometrioid carcinoma | Female | <65 | I/II | Unknown | Unknown | SD |
| TAF10 | SNV | Missense_Mutation | novel | c.442N>T | p.Asp148Tyr | p.D148Y | Q12962 | protein_coding | deleterious(0) | probably_damaging(1) | TCGA-AX-A2HC-01 | Endometrium | uterine corpus endometrioid carcinoma | Female | <65 | III/IV | Chemotherapy | paclitaxel | PD |
| TAF10 | SNV | Missense_Mutation | c.458G>A | p.Arg153Gln | p.R153Q | Q12962 | protein_coding | deleterious(0) | probably_damaging(0.97) | TCGA-D1-A16X-01 | Endometrium | uterine corpus endometrioid carcinoma | Female | <65 | I/II | Unknown | Unknown | SD |
| Page: 1 2 |
Top |
Related drugs of malignant transformation related genes |
| Identification of chemicals and drugs interact with genes involved in malignant transfromation |
| (DGIdb 4.0) |
| Entrez ID | Symbol | Category | Interaction Types | Drug Claim Name | Drug Name | PMIDs |
| Page: 1 |

Copyright 2023-Present -The University of Texas Health Science Center at Houston |