
|
|||||
|
 | |
| |
| |
| |
| |
| |
|
Gene: SYNGR2 |
Gene summary for SYNGR2 |
| Gene information | Species | Human | Gene symbol | SYNGR2 | Gene ID | 9144 |
| Gene name | synaptogyrin 2 | |
| Gene Alias | SYNGR2 | |
| Cytomap | 17q25.3 | |
| Gene Type | protein-coding | GO ID | GO:0006810 | UniProtAcc | O43760 |
Top |
Malignant transformation analysis |
| Identification of the aberrant gene expression in precancerous and cancerous lesions by comparing the gene expression of stem-like cells in diseased tissues with normal stem cells |
| Entrez ID | Symbol | Replicates | Species | Organ | Tissue | Adj P-value | Log2FC | Malignancy |
| 9144 | SYNGR2 | NCCBC14 | Human | Breast | DCIS | 8.78e-09 | 1.38e-01 | 0.2021 |
| 9144 | SYNGR2 | NCCBC2 | Human | Breast | DCIS | 4.50e-02 | -2.79e-01 | 0.1554 |
| 9144 | SYNGR2 | NCCBC5 | Human | Breast | DCIS | 4.16e-12 | -1.40e-01 | 0.2046 |
| 9144 | SYNGR2 | P1 | Human | Breast | IDC | 6.11e-20 | 2.18e-01 | 0.1527 |
| 9144 | SYNGR2 | P2 | Human | Breast | IDC | 8.51e-07 | 2.81e-01 | 0.21 |
| 9144 | SYNGR2 | DCIS2 | Human | Breast | DCIS | 6.38e-48 | 1.03e-01 | 0.0085 |
| 9144 | SYNGR2 | HTA11_3410_2000001011 | Human | Colorectum | AD | 2.68e-18 | 5.70e-01 | 0.0155 |
| 9144 | SYNGR2 | HTA11_2487_2000001011 | Human | Colorectum | SER | 1.39e-24 | 1.13e+00 | -0.1808 |
| 9144 | SYNGR2 | HTA11_2951_2000001011 | Human | Colorectum | AD | 3.85e-06 | 8.30e-01 | 0.0216 |
| 9144 | SYNGR2 | HTA11_1938_2000001011 | Human | Colorectum | AD | 2.22e-30 | 1.12e+00 | -0.0811 |
| 9144 | SYNGR2 | HTA11_78_2000001011 | Human | Colorectum | AD | 1.31e-15 | 7.60e-01 | -0.1088 |
| 9144 | SYNGR2 | HTA11_347_2000001011 | Human | Colorectum | AD | 2.08e-45 | 1.13e+00 | -0.1954 |
| 9144 | SYNGR2 | HTA11_411_2000001011 | Human | Colorectum | SER | 1.18e-13 | 1.65e+00 | -0.2602 |
| 9144 | SYNGR2 | HTA11_2112_2000001011 | Human | Colorectum | SER | 3.97e-11 | 1.70e+00 | -0.2196 |
| 9144 | SYNGR2 | HTA11_3361_2000001011 | Human | Colorectum | AD | 8.12e-13 | 8.97e-01 | -0.1207 |
| 9144 | SYNGR2 | HTA11_83_2000001011 | Human | Colorectum | SER | 4.62e-17 | 1.02e+00 | -0.1526 |
| 9144 | SYNGR2 | HTA11_696_2000001011 | Human | Colorectum | AD | 2.14e-61 | 1.35e+00 | -0.1464 |
| 9144 | SYNGR2 | HTA11_866_2000001011 | Human | Colorectum | AD | 1.02e-39 | 8.88e-01 | -0.1001 |
| 9144 | SYNGR2 | HTA11_1391_2000001011 | Human | Colorectum | AD | 2.68e-38 | 1.71e+00 | -0.059 |
| 9144 | SYNGR2 | HTA11_2992_2000001011 | Human | Colorectum | SER | 4.42e-10 | 9.84e-01 | -0.1706 |
| Page: 1 2 3 4 5 6 7 8 9 10 11 |
| Tissue | Expression Dynamics | Abbreviation |
| Breast |  | IDC: Invasive ductal carcinoma |
| DCIS: Ductal carcinoma in situ | ||
| Precancer(BRCA1-mut): Precancerous lesion from BRCA1 mutation carriers | ||
| Colorectum (GSE201348) |  | FAP: Familial adenomatous polyposis |
| CRC: Colorectal cancer | ||
| Colorectum (HTA11) |  | AD: Adenomas |
| SER: Sessile serrated lesions | ||
| MSI-H: Microsatellite-high colorectal cancer | ||
| MSS: Microsatellite stable colorectal cancer | ||
| Esophagus | 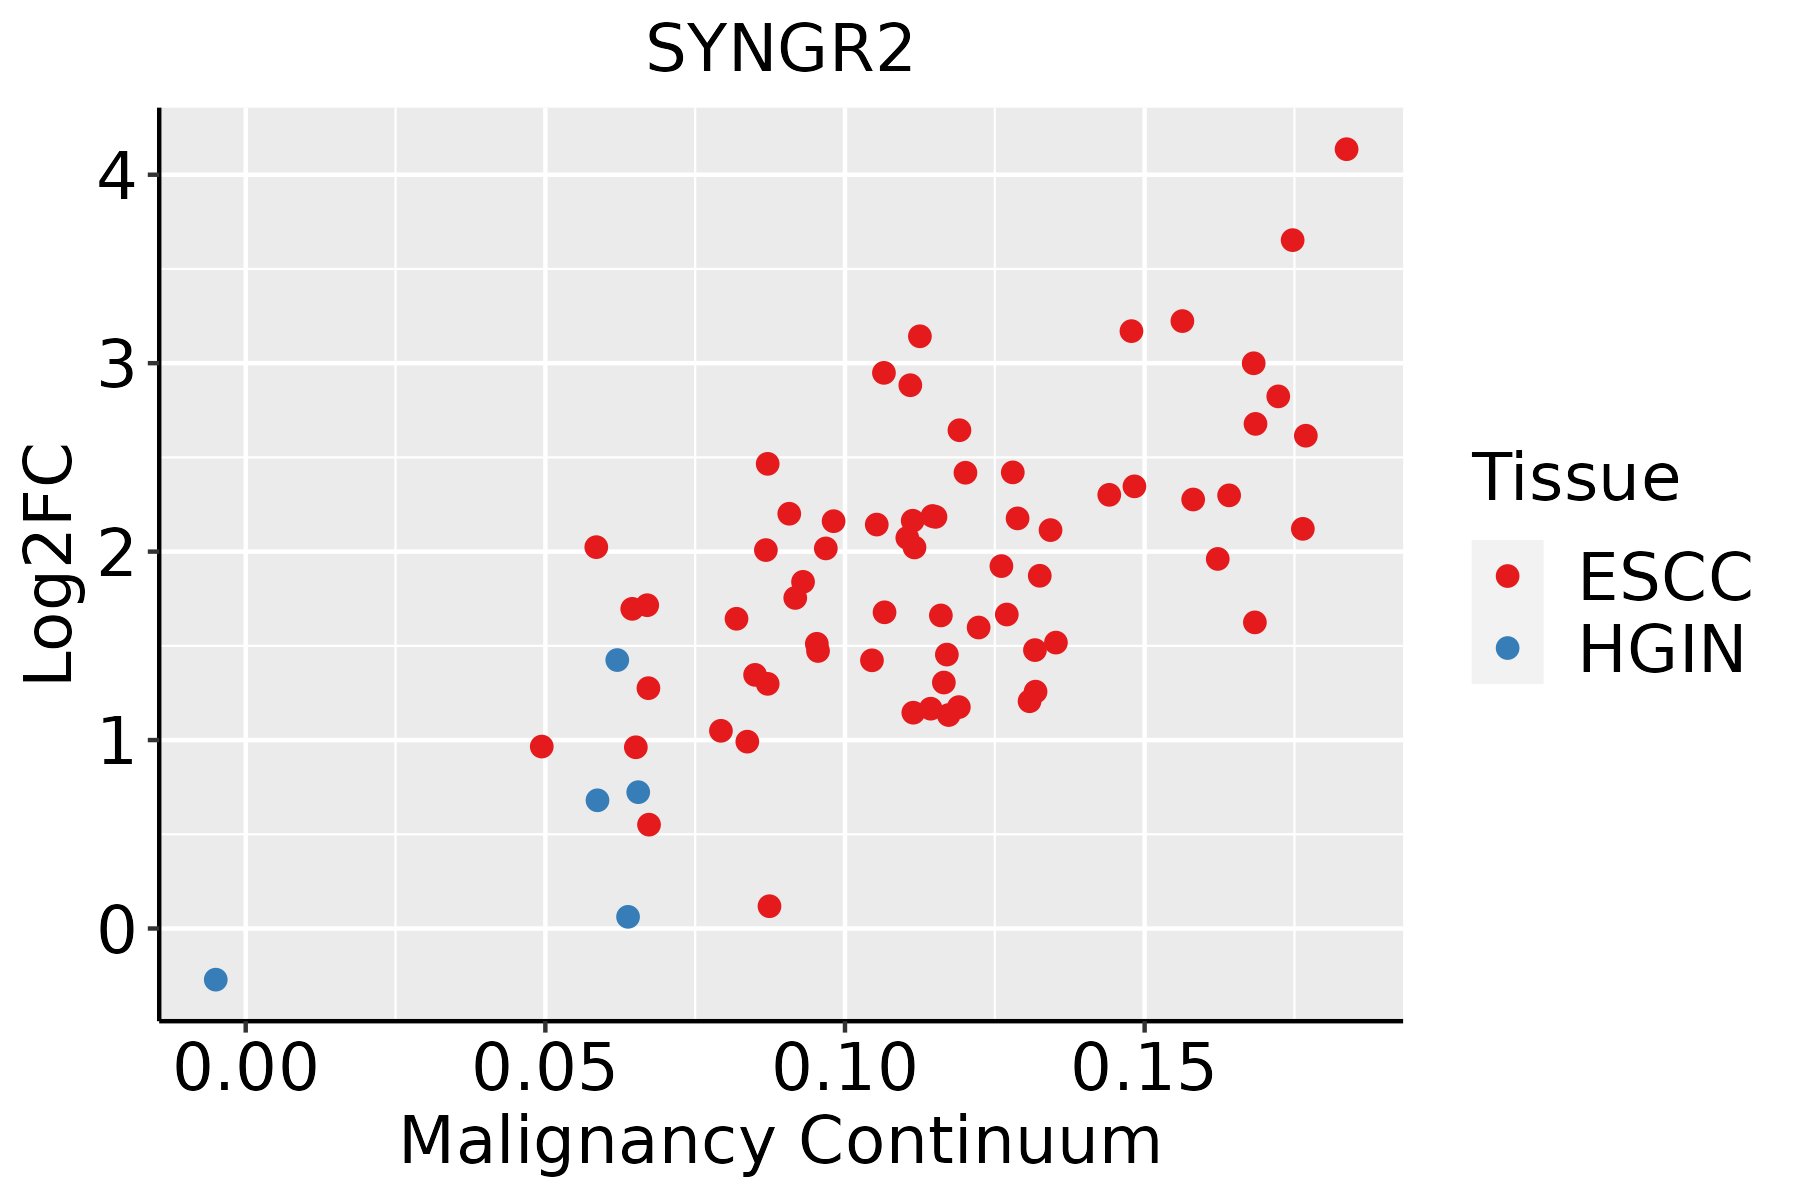 | ESCC: Esophageal squamous cell carcinoma |
| HGIN: High-grade intraepithelial neoplasias | ||
| LGIN: Low-grade intraepithelial neoplasias | ||
| Liver | 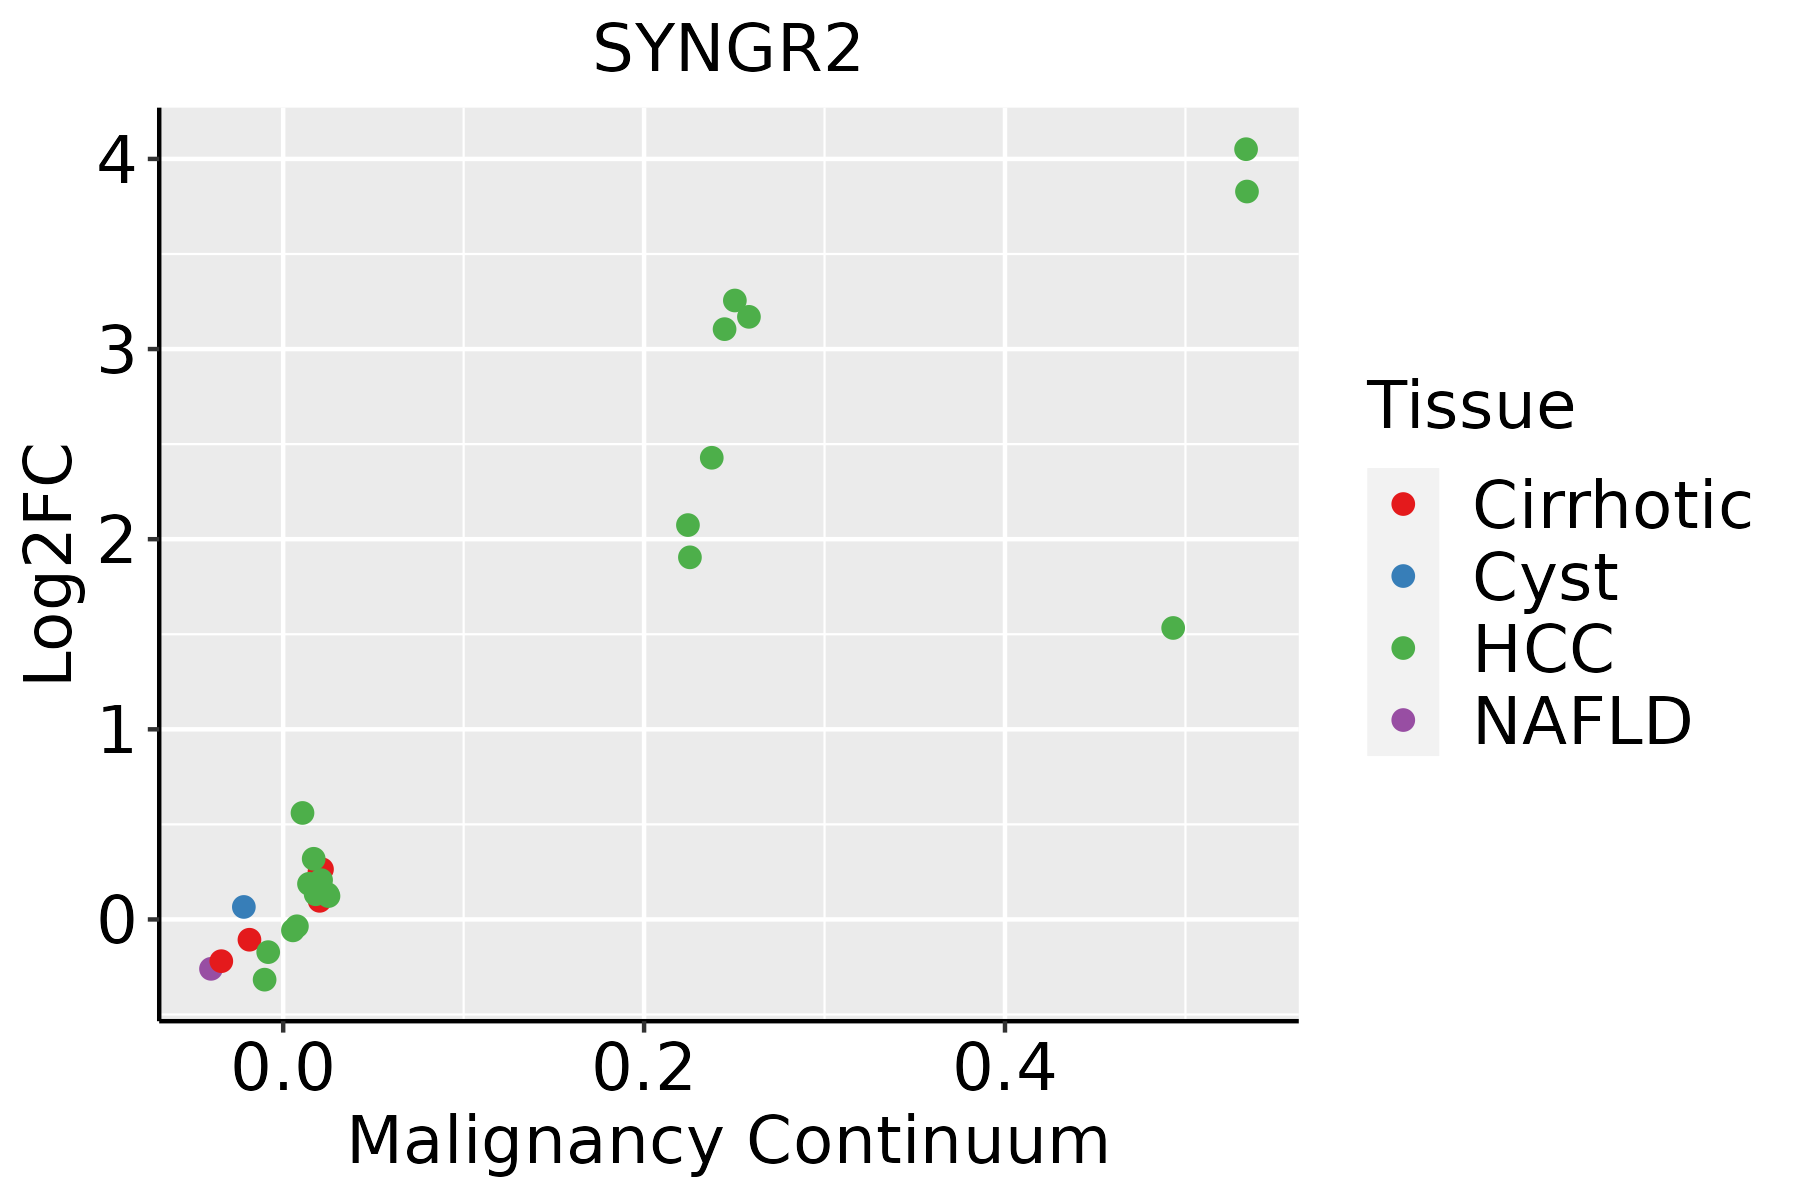 | HCC: Hepatocellular carcinoma |
| NAFLD: Non-alcoholic fatty liver disease | ||
| Oral Cavity | 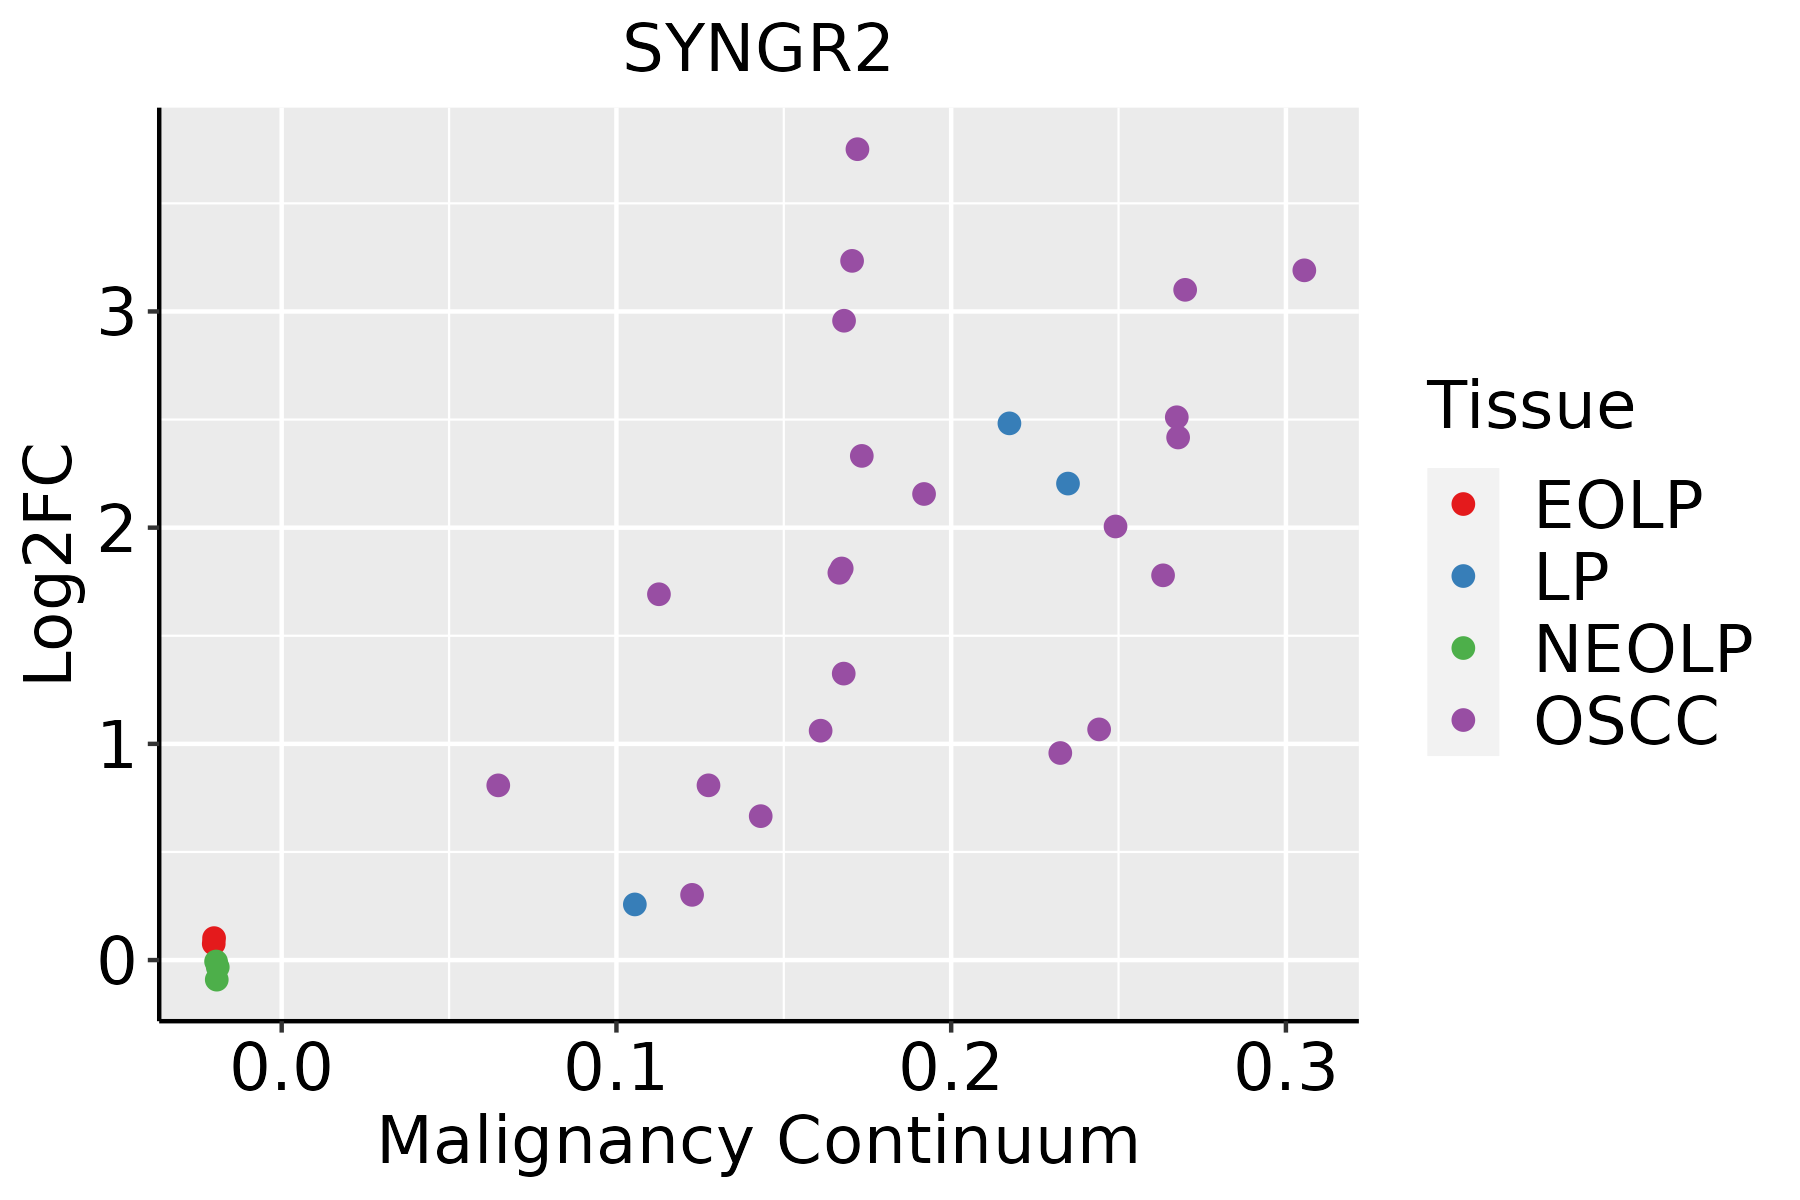 | EOLP: Erosive Oral lichen planus |
| LP: leukoplakia | ||
| NEOLP: Non-erosive oral lichen planus | ||
| OSCC: Oral squamous cell carcinoma | ||
| Prostate | 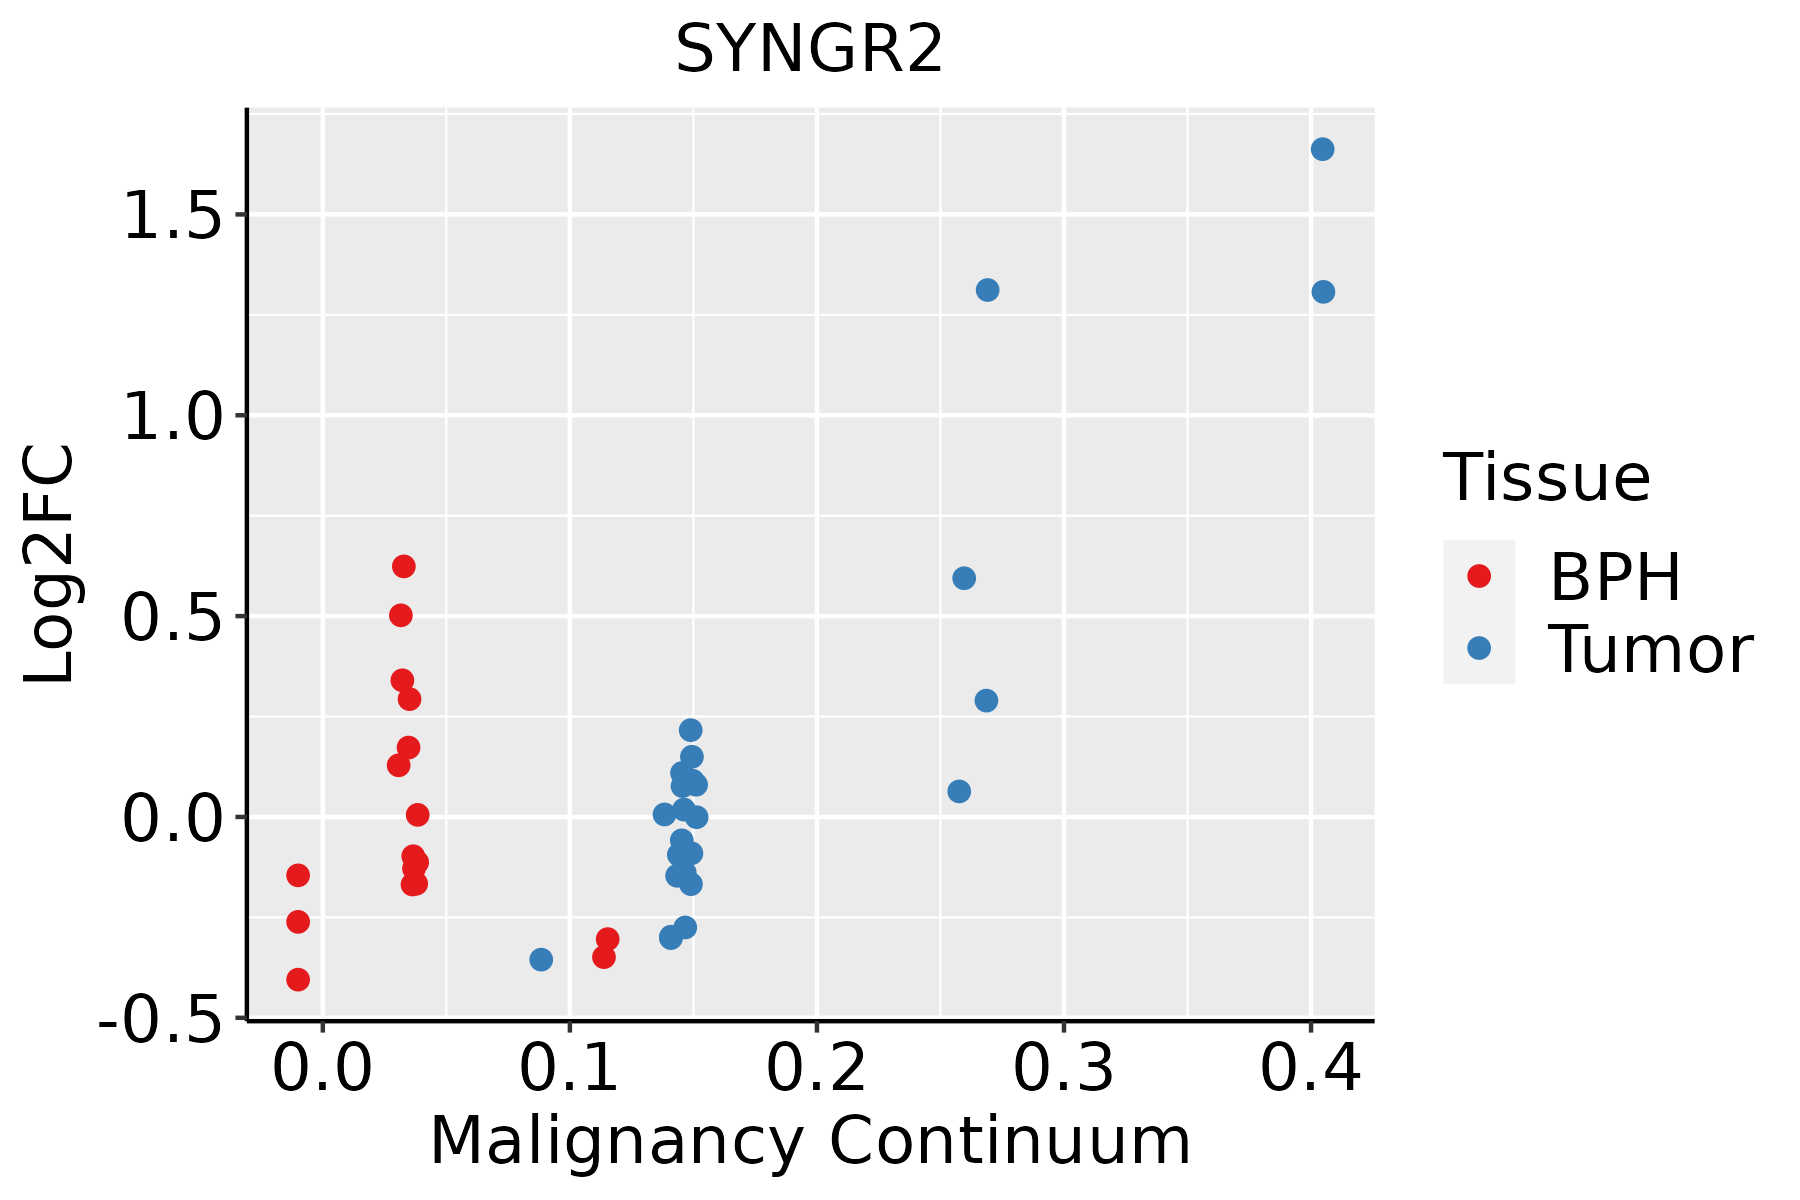 | BPH: Benign Prostatic Hyperplasia |
| Skin | 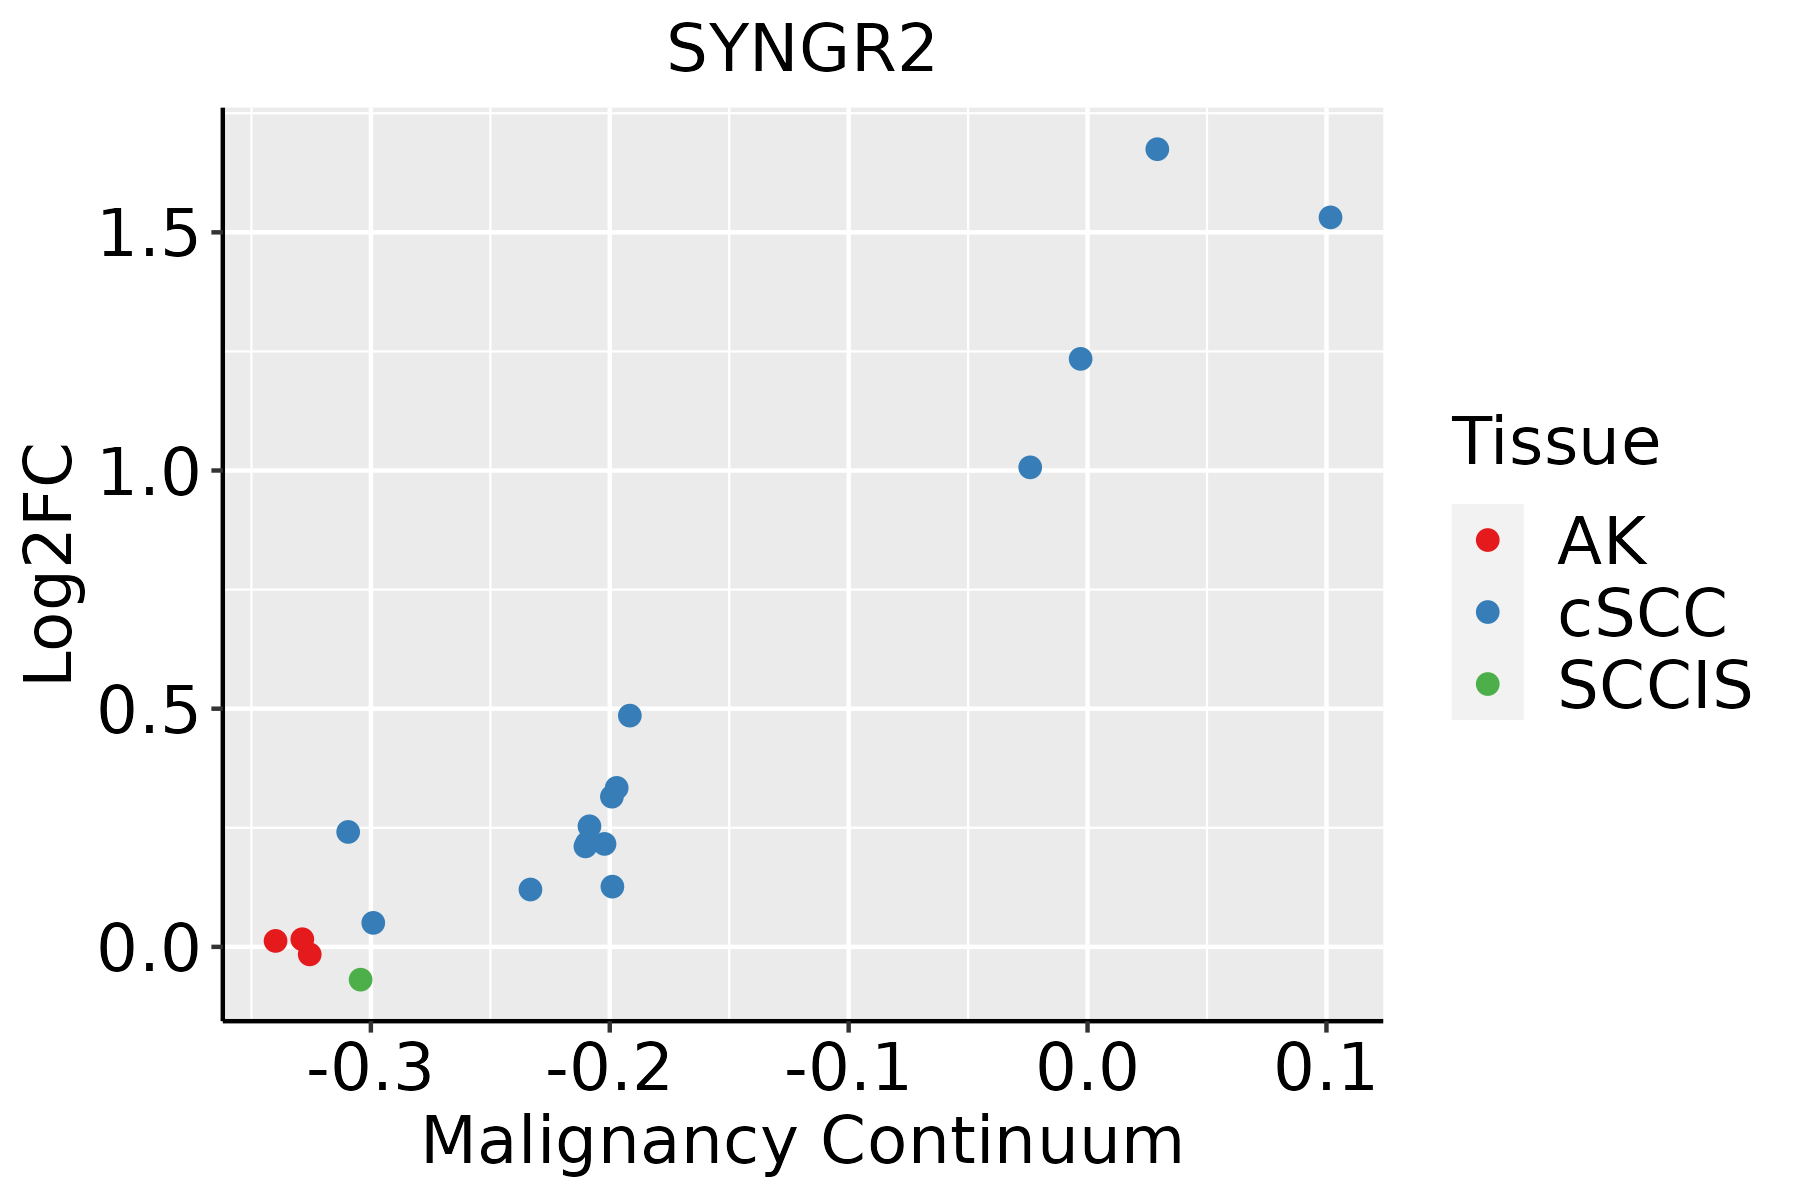 | AK: Actinic keratosis |
| cSCC: Cutaneous squamous cell carcinoma | ||
| SCCIS:squamous cell carcinoma in situ | ||
| Thyroid | 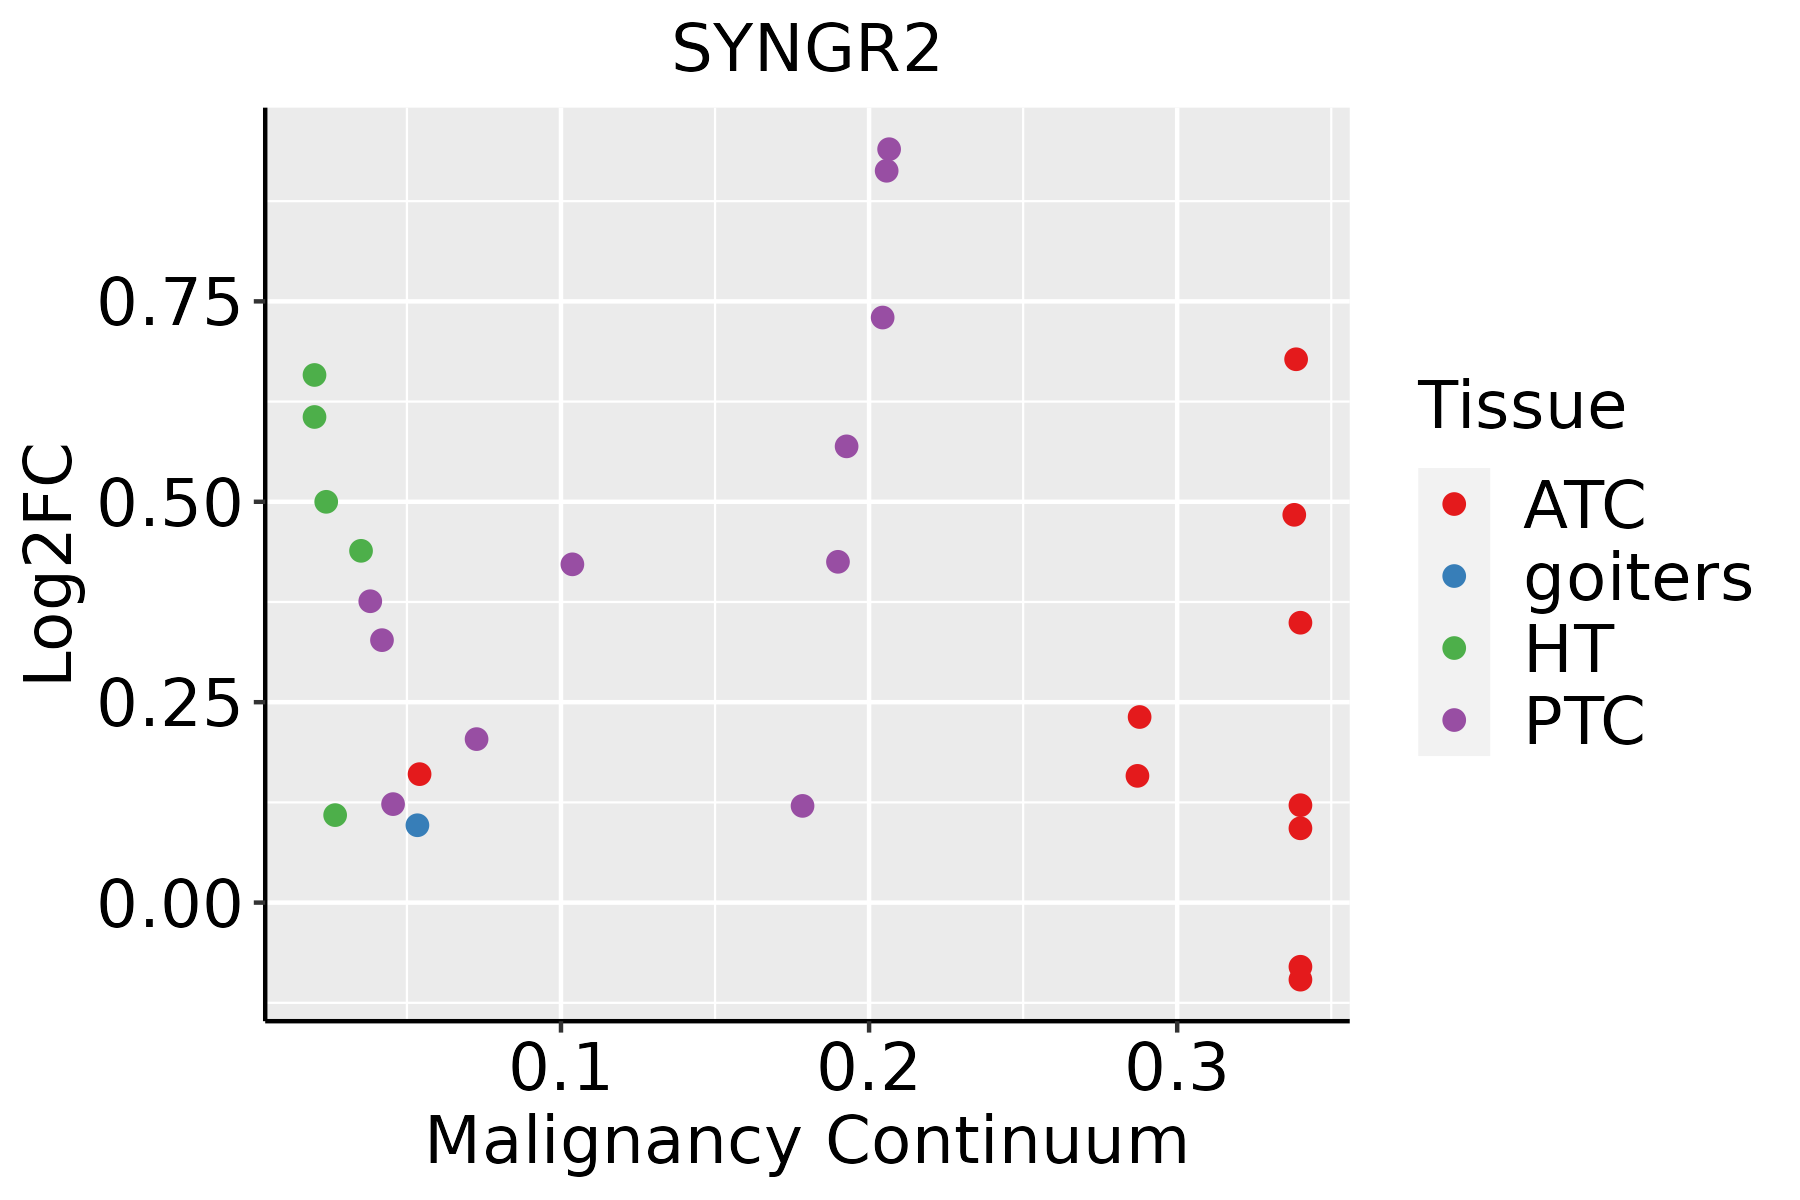 | ATC: Anaplastic thyroid cancer |
| HT: Hashimoto's thyroiditis | ||
| PTC: Papillary thyroid cancer |
| ∗log2FC in expression of this searched gene in stem-like cells from each diseased tissue sample relative to stem-like cells in normal samples in each tissue plotted against the malignancy continuum. Samples are colored based on if they are from different disease stage. |
Top |
Malignant transformation related pathway analysis |
| Find out the enriched GO biological processes and KEGG pathways involved in transition from healthy to precancer to cancer |
| Tissue | Disease Stage | Enriched GO biological Processes |
| Colorectum | AD |  |
| Colorectum | SER |  |
| Colorectum | MSS |  |
| Colorectum | MSI-H |  |
| Colorectum | FAP |  |
| ∗Top 15 enriched GO BP terms are showed in the bar plot of each disease state in each tissue. Each row represents a significant GO biological process which is colored according to the -log10(p.adjust). |
| Page: 1 2 3 4 5 6 7 8 9 |
| GO ID | Tissue | Disease Stage | Description | Gene Ratio | Bg Ratio | pvalue | p.adjust | Count |
| GO:0006887 | Colorectum | AD | exocytosis | 96/3918 | 352/18723 | 2.48e-03 | 1.90e-02 | 96 |
| GO:00068871 | Colorectum | SER | exocytosis | 75/2897 | 352/18723 | 2.05e-03 | 2.03e-02 | 75 |
| Page: 1 |
| Pathway ID | Tissue | Disease Stage | Description | Gene Ratio | Bg Ratio | pvalue | p.adjust | qvalue | Count |
| Page: 1 |
Top |
Cell-cell communication analysis |
| Identification of potential cell-cell interactions between two cell types and their ligand-receptor pairs for different disease states |
| Ligand | Receptor | LRpair | Pathway | Tissue | Disease Stage |
| Page: 1 |
Top |
Single-cell gene regulatory network inference analysis |
| Find out the significant the regulons (TFs) and the target genes of each regulon across cell types for different disease states |
| TF | Cell Type | Tissue | Disease Stage | Target Gene | RSS | Regulon Activity |
| ∗The dot plots of a searched regulon are shown for all cell subpopulations in each disease state of each tissue based on the regulon specific score inferred using pySCENIC and by calculating the average expression. |
| Page: 1 |
Top |
Somatic mutation of malignant transformation related genes |
| Annotation of somatic variants for genes involved in malignant transformation |
| Hugo Symbol | Variant Class | Variant Classification | dbSNP RS | HGVSc | HGVSp | HGVSp Short | SWISSPROT | BIOTYPE | SIFT | PolyPhen | Tumor Sample Barcode | Tissue | Histology | Sex | Age | Stage | Therapy Types | Drugs | Outcome |
| SYNGR2 | SNV | Missense_Mutation | novel | c.183N>G | p.Phe61Leu | p.F61L | O43760 | protein_coding | deleterious(0) | probably_damaging(0.998) | TCGA-5L-AAT1-01 | Breast | breast invasive carcinoma | Female | <65 | III/IV | Hormone Therapy | letrozol | SD |
| SYNGR2 | SNV | Missense_Mutation | c.161N>G | p.Ser54Cys | p.S54C | O43760 | protein_coding | deleterious(0) | possibly_damaging(0.87) | TCGA-AC-A23H-01 | Breast | breast invasive carcinoma | Female | >=65 | I/II | Unknown | Unknown | PD | |
| SYNGR2 | SNV | Missense_Mutation | rs78947498 | c.178N>A | p.Val60Met | p.V60M | O43760 | protein_coding | tolerated(0.14) | possibly_damaging(0.787) | TCGA-A5-A0G2-01 | Endometrium | uterine corpus endometrioid carcinoma | Female | <65 | III/IV | Unknown | Unknown | SD |
| SYNGR2 | SNV | Missense_Mutation | novel | c.397N>C | p.Thr133Pro | p.T133P | O43760 | protein_coding | deleterious(0) | probably_damaging(0.989) | TCGA-A5-A2K5-01 | Endometrium | uterine corpus endometrioid carcinoma | Female | >=65 | I/II | Unknown | Unknown | SD |
| SYNGR2 | SNV | Missense_Mutation | c.247N>A | p.Ala83Thr | p.A83T | O43760 | protein_coding | tolerated(0.23) | benign(0.197) | TCGA-AP-A059-01 | Endometrium | uterine corpus endometrioid carcinoma | Female | >=65 | I/II | Unknown | Unknown | SD | |
| SYNGR2 | SNV | Missense_Mutation | c.125N>A | p.Cys42Tyr | p.C42Y | O43760 | protein_coding | deleterious(0) | probably_damaging(0.989) | TCGA-AP-A0LP-01 | Endometrium | uterine corpus endometrioid carcinoma | Female | >=65 | I/II | Hormone Therapy | megace | SD | |
| SYNGR2 | SNV | Missense_Mutation | rs544604839 | c.404C>T | p.Pro135Leu | p.P135L | O43760 | protein_coding | tolerated(0.16) | benign(0.017) | TCGA-D1-A1O8-01 | Endometrium | uterine corpus endometrioid carcinoma | Female | >=65 | III/IV | Unknown | Unknown | SD |
| SYNGR2 | SNV | Missense_Mutation | rs9889851 | c.646N>A | p.Glu216Lys | p.E216K | O43760 | protein_coding | tolerated(0.68) | possibly_damaging(0.603) | TCGA-EC-A24G-01 | Endometrium | uterine corpus endometrioid carcinoma | Female | <65 | I/II | Chemotherapy | doxorubicin | SD |
| SYNGR2 | SNV | Missense_Mutation | rs533720150 | c.635N>T | p.Ala212Val | p.A212V | O43760 | protein_coding | tolerated(0.34) | benign(0) | TCGA-FI-A2D5-01 | Endometrium | uterine corpus endometrioid carcinoma | Female | <65 | III/IV | Chemotherapy | carboplatinum | PD |
| SYNGR2 | SNV | Missense_Mutation | c.305N>T | p.Lys102Met | p.K102M | O43760 | protein_coding | deleterious(0) | probably_damaging(0.997) | TCGA-BR-8373-01 | Stomach | stomach adenocarcinoma | Female | >=65 | III/IV | Chemotherapy | 5-fluorouracil | CR |
| Page: 1 2 |
Top |
Related drugs of malignant transformation related genes |
| Identification of chemicals and drugs interact with genes involved in malignant transfromation |
| (DGIdb 4.0) |
| Entrez ID | Symbol | Category | Interaction Types | Drug Claim Name | Drug Name | PMIDs |
| Page: 1 |

Copyright 2023-Present -The University of Texas Health Science Center at Houston |