
|
|||||
|
 | |
| |
| |
| |
| |
| |
|
Gene: SYAP1 |
Gene summary for SYAP1 |
| Gene information | Species | Human | Gene symbol | SYAP1 | Gene ID | 94056 |
| Gene name | synapse associated protein 1 | |
| Gene Alias | BSTA | |
| Cytomap | Xp22.2 | |
| Gene Type | protein-coding | GO ID | GO:0001932 | UniProtAcc | Q96A49 |
Top |
Malignant transformation analysis |
| Identification of the aberrant gene expression in precancerous and cancerous lesions by comparing the gene expression of stem-like cells in diseased tissues with normal stem cells |
| Entrez ID | Symbol | Replicates | Species | Organ | Tissue | Adj P-value | Log2FC | Malignancy |
| 94056 | SYAP1 | P1 | Human | Breast | IDC | 1.25e-15 | 1.94e-01 | 0.1527 |
| 94056 | SYAP1 | DCIS2 | Human | Breast | DCIS | 2.44e-48 | 1.18e-01 | 0.0085 |
| 94056 | SYAP1 | HTA11_2487_2000001011 | Human | Colorectum | SER | 4.30e-13 | 5.16e-01 | -0.1808 |
| 94056 | SYAP1 | HTA11_1938_2000001011 | Human | Colorectum | AD | 8.98e-12 | 6.15e-01 | -0.0811 |
| 94056 | SYAP1 | HTA11_78_2000001011 | Human | Colorectum | AD | 1.31e-05 | 3.96e-01 | -0.1088 |
| 94056 | SYAP1 | HTA11_347_2000001011 | Human | Colorectum | AD | 5.42e-32 | 8.22e-01 | -0.1954 |
| 94056 | SYAP1 | HTA11_3361_2000001011 | Human | Colorectum | AD | 9.06e-05 | 2.94e-01 | -0.1207 |
| 94056 | SYAP1 | HTA11_83_2000001011 | Human | Colorectum | SER | 2.45e-02 | 3.25e-01 | -0.1526 |
| 94056 | SYAP1 | HTA11_696_2000001011 | Human | Colorectum | AD | 1.74e-08 | 4.84e-01 | -0.1464 |
| 94056 | SYAP1 | HTA11_1391_2000001011 | Human | Colorectum | AD | 3.51e-11 | 5.80e-01 | -0.059 |
| 94056 | SYAP1 | HTA11_2992_2000001011 | Human | Colorectum | SER | 1.90e-03 | 5.55e-01 | -0.1706 |
| 94056 | SYAP1 | HTA11_546_2000001011 | Human | Colorectum | AD | 2.68e-05 | 4.44e-01 | -0.0842 |
| 94056 | SYAP1 | HTA11_99999965104_69814 | Human | Colorectum | MSS | 4.58e-11 | 6.68e-01 | 0.281 |
| 94056 | SYAP1 | HTA11_99999971662_82457 | Human | Colorectum | MSS | 2.26e-09 | 5.46e-01 | 0.3859 |
| 94056 | SYAP1 | HTA11_99999973899_84307 | Human | Colorectum | MSS | 4.49e-06 | 5.28e-01 | 0.2585 |
| 94056 | SYAP1 | HTA11_99999974143_84620 | Human | Colorectum | MSS | 3.99e-04 | 3.48e-01 | 0.3005 |
| 94056 | SYAP1 | A015-C-203 | Human | Colorectum | FAP | 8.06e-04 | -9.70e-02 | -0.1294 |
| 94056 | SYAP1 | A015-C-104 | Human | Colorectum | FAP | 6.96e-05 | -1.44e-01 | -0.1899 |
| 94056 | SYAP1 | A002-C-016 | Human | Colorectum | FAP | 4.75e-04 | -9.52e-02 | 0.0521 |
| 94056 | SYAP1 | A002-C-116 | Human | Colorectum | FAP | 1.81e-04 | -3.41e-02 | -0.0452 |
| Page: 1 2 3 4 5 6 7 8 9 |
| Tissue | Expression Dynamics | Abbreviation |
| Breast | 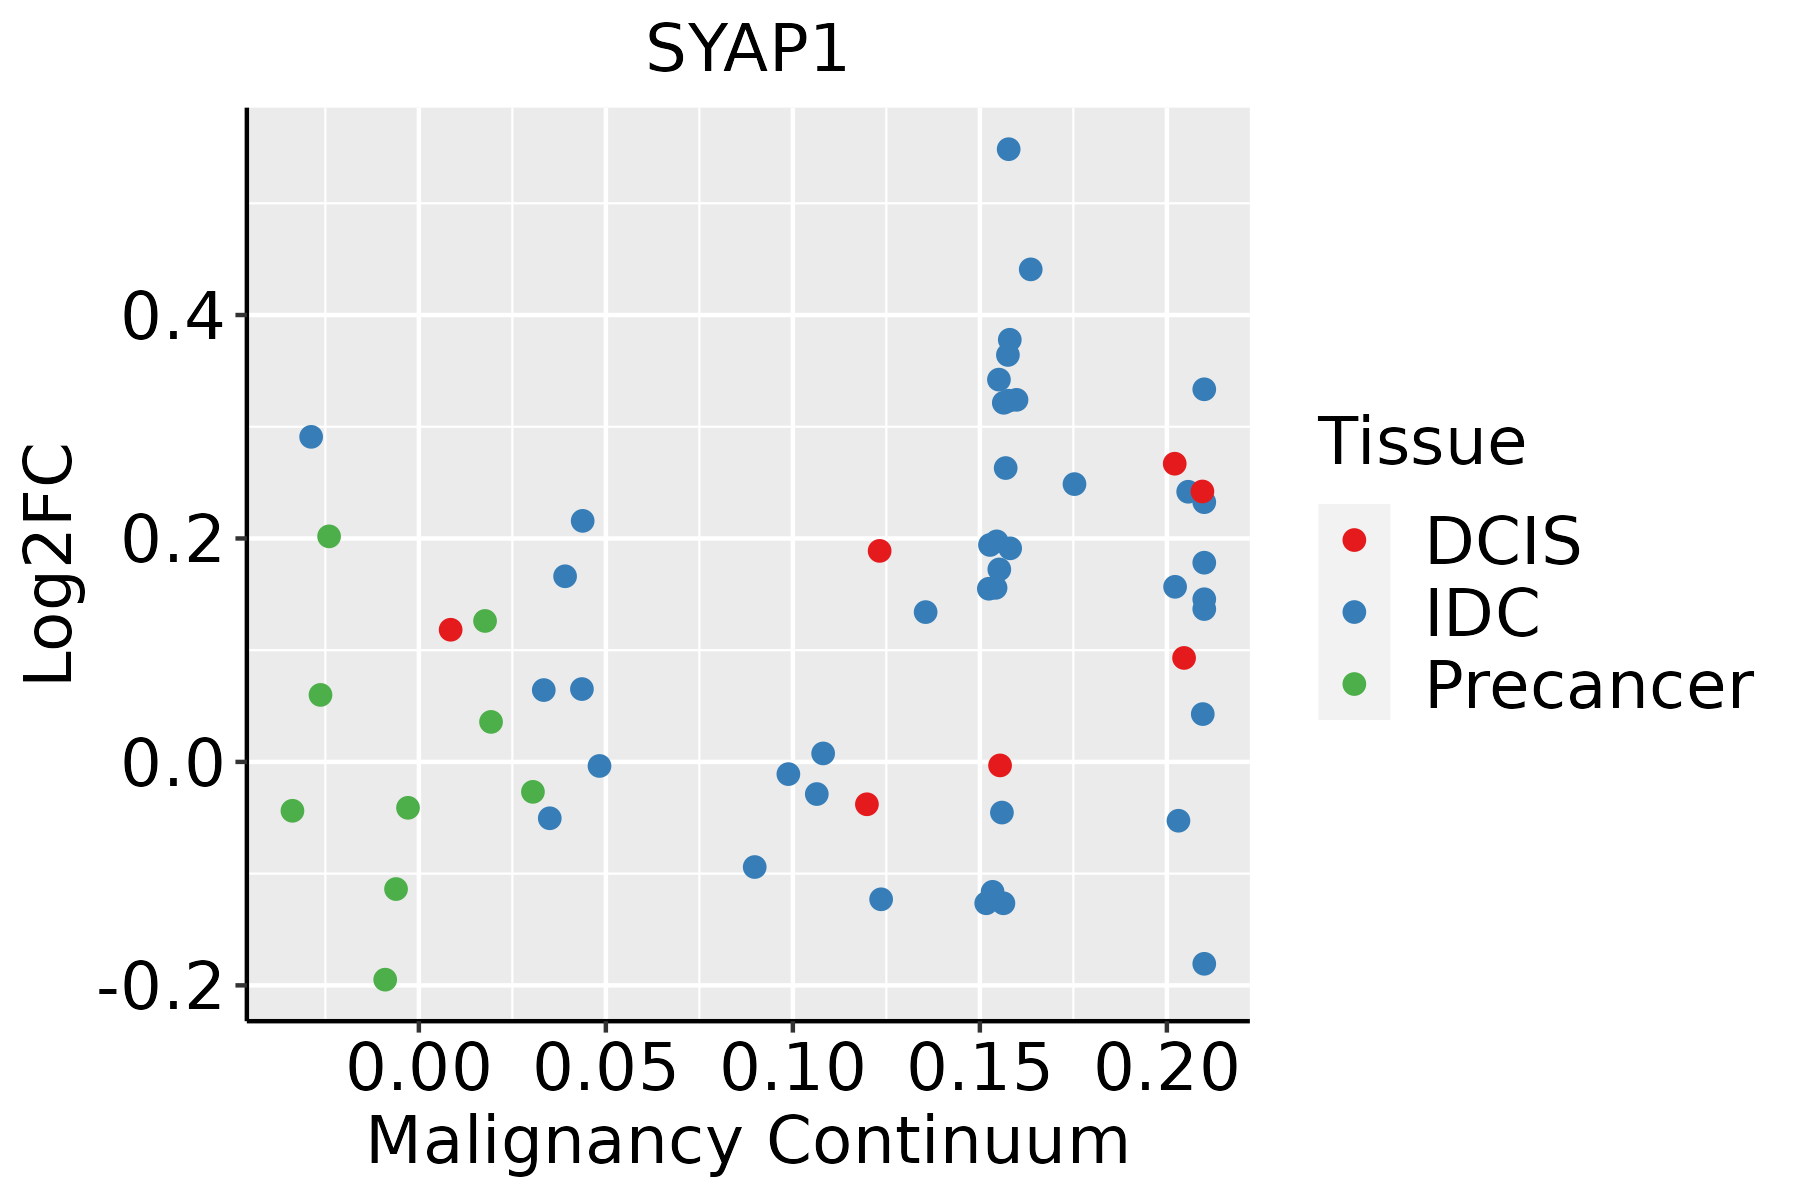 | IDC: Invasive ductal carcinoma |
| DCIS: Ductal carcinoma in situ | ||
| Precancer(BRCA1-mut): Precancerous lesion from BRCA1 mutation carriers | ||
| Colorectum (GSE201348) |  | FAP: Familial adenomatous polyposis |
| CRC: Colorectal cancer | ||
| Colorectum (HTA11) |  | AD: Adenomas |
| SER: Sessile serrated lesions | ||
| MSI-H: Microsatellite-high colorectal cancer | ||
| MSS: Microsatellite stable colorectal cancer | ||
| Esophagus | 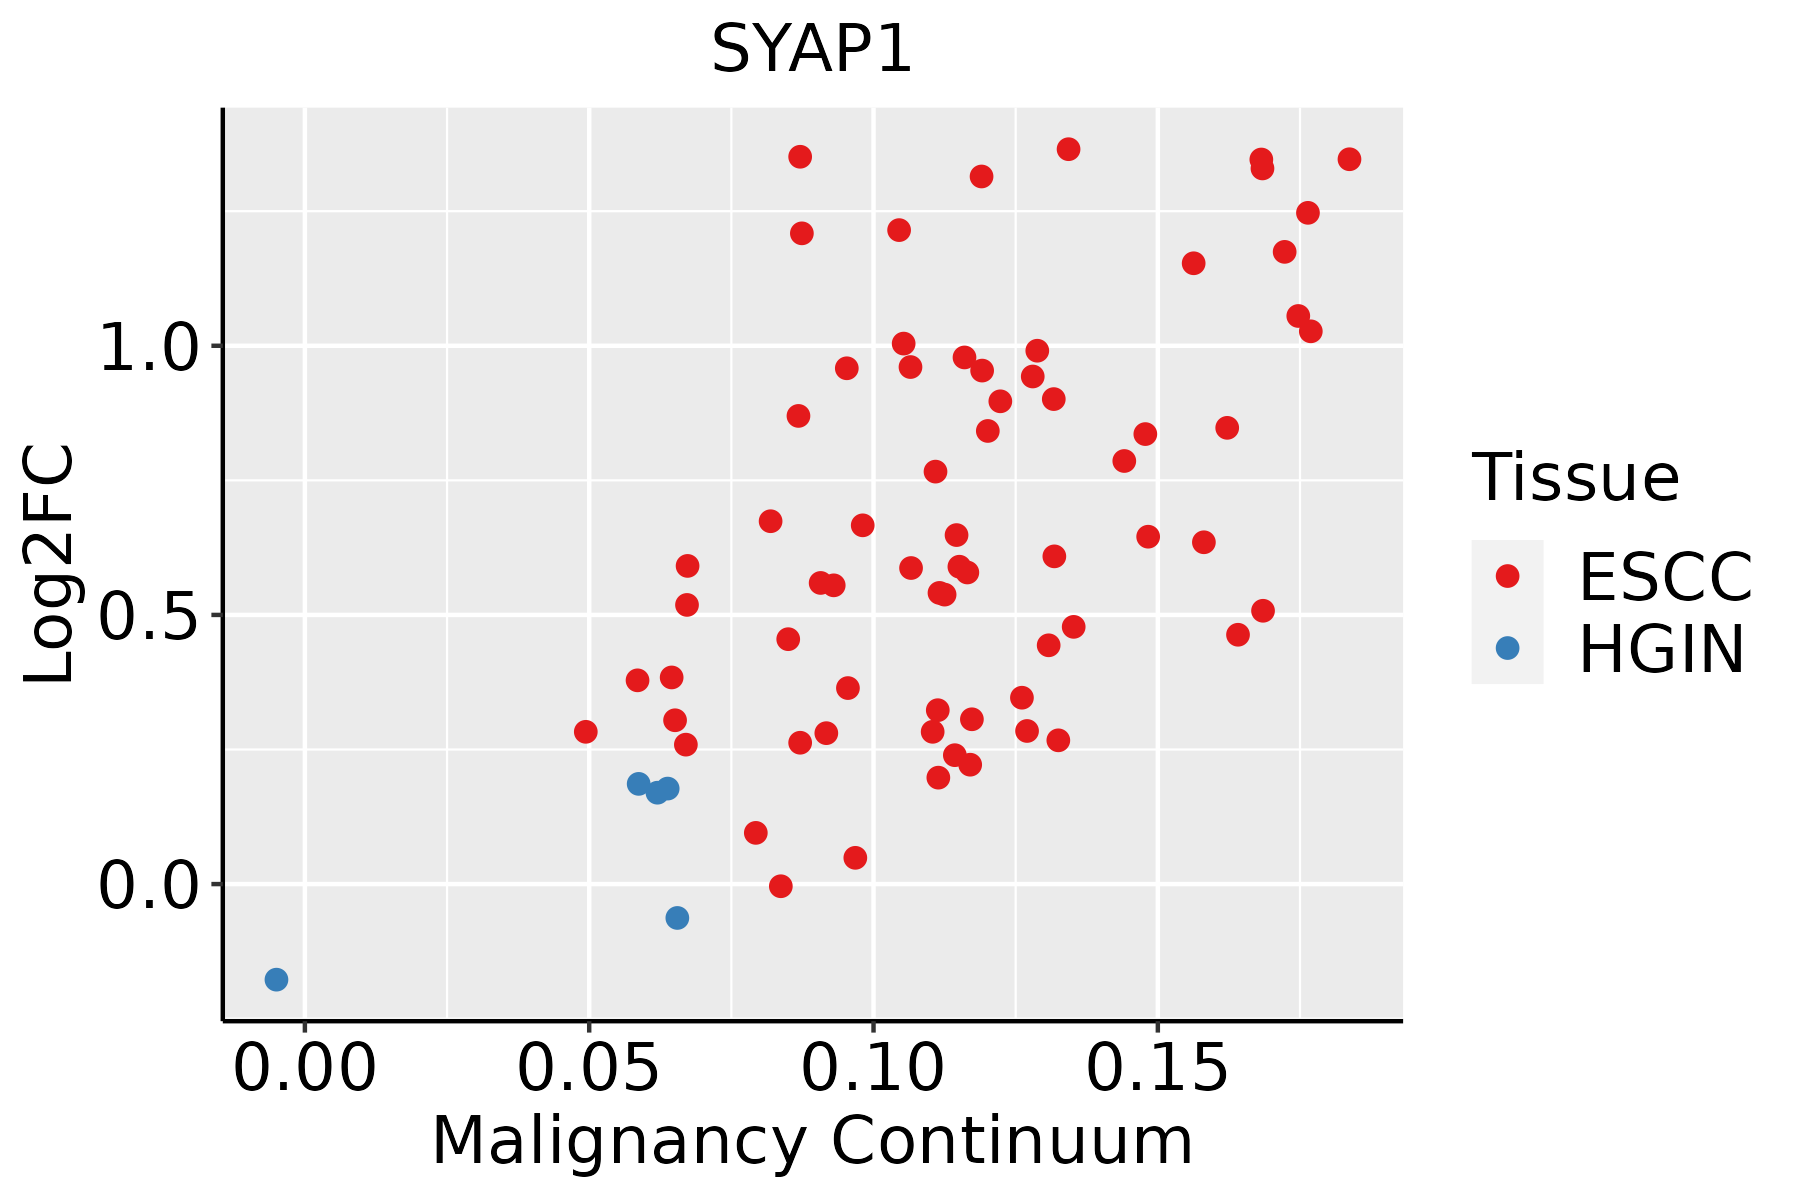 | ESCC: Esophageal squamous cell carcinoma |
| HGIN: High-grade intraepithelial neoplasias | ||
| LGIN: Low-grade intraepithelial neoplasias | ||
| Liver | 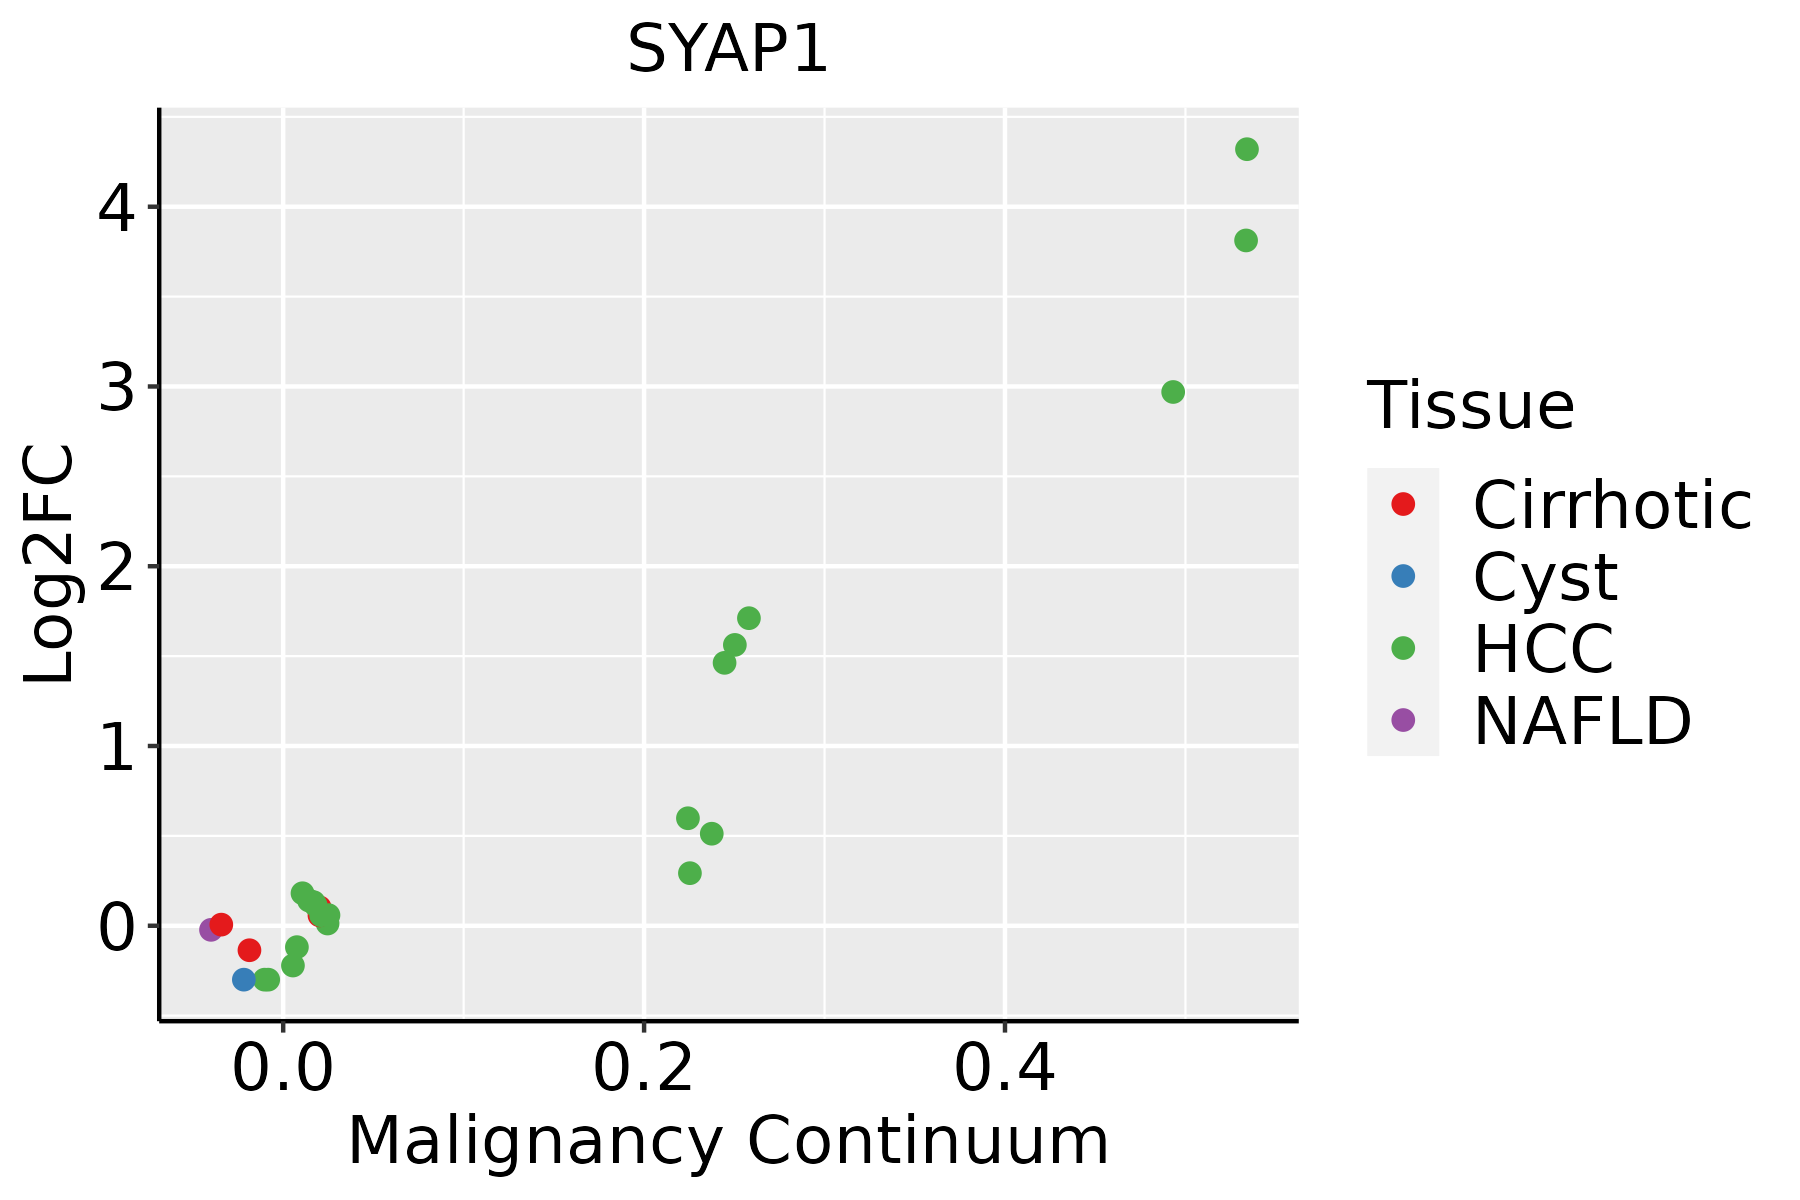 | HCC: Hepatocellular carcinoma |
| NAFLD: Non-alcoholic fatty liver disease | ||
| Lung | 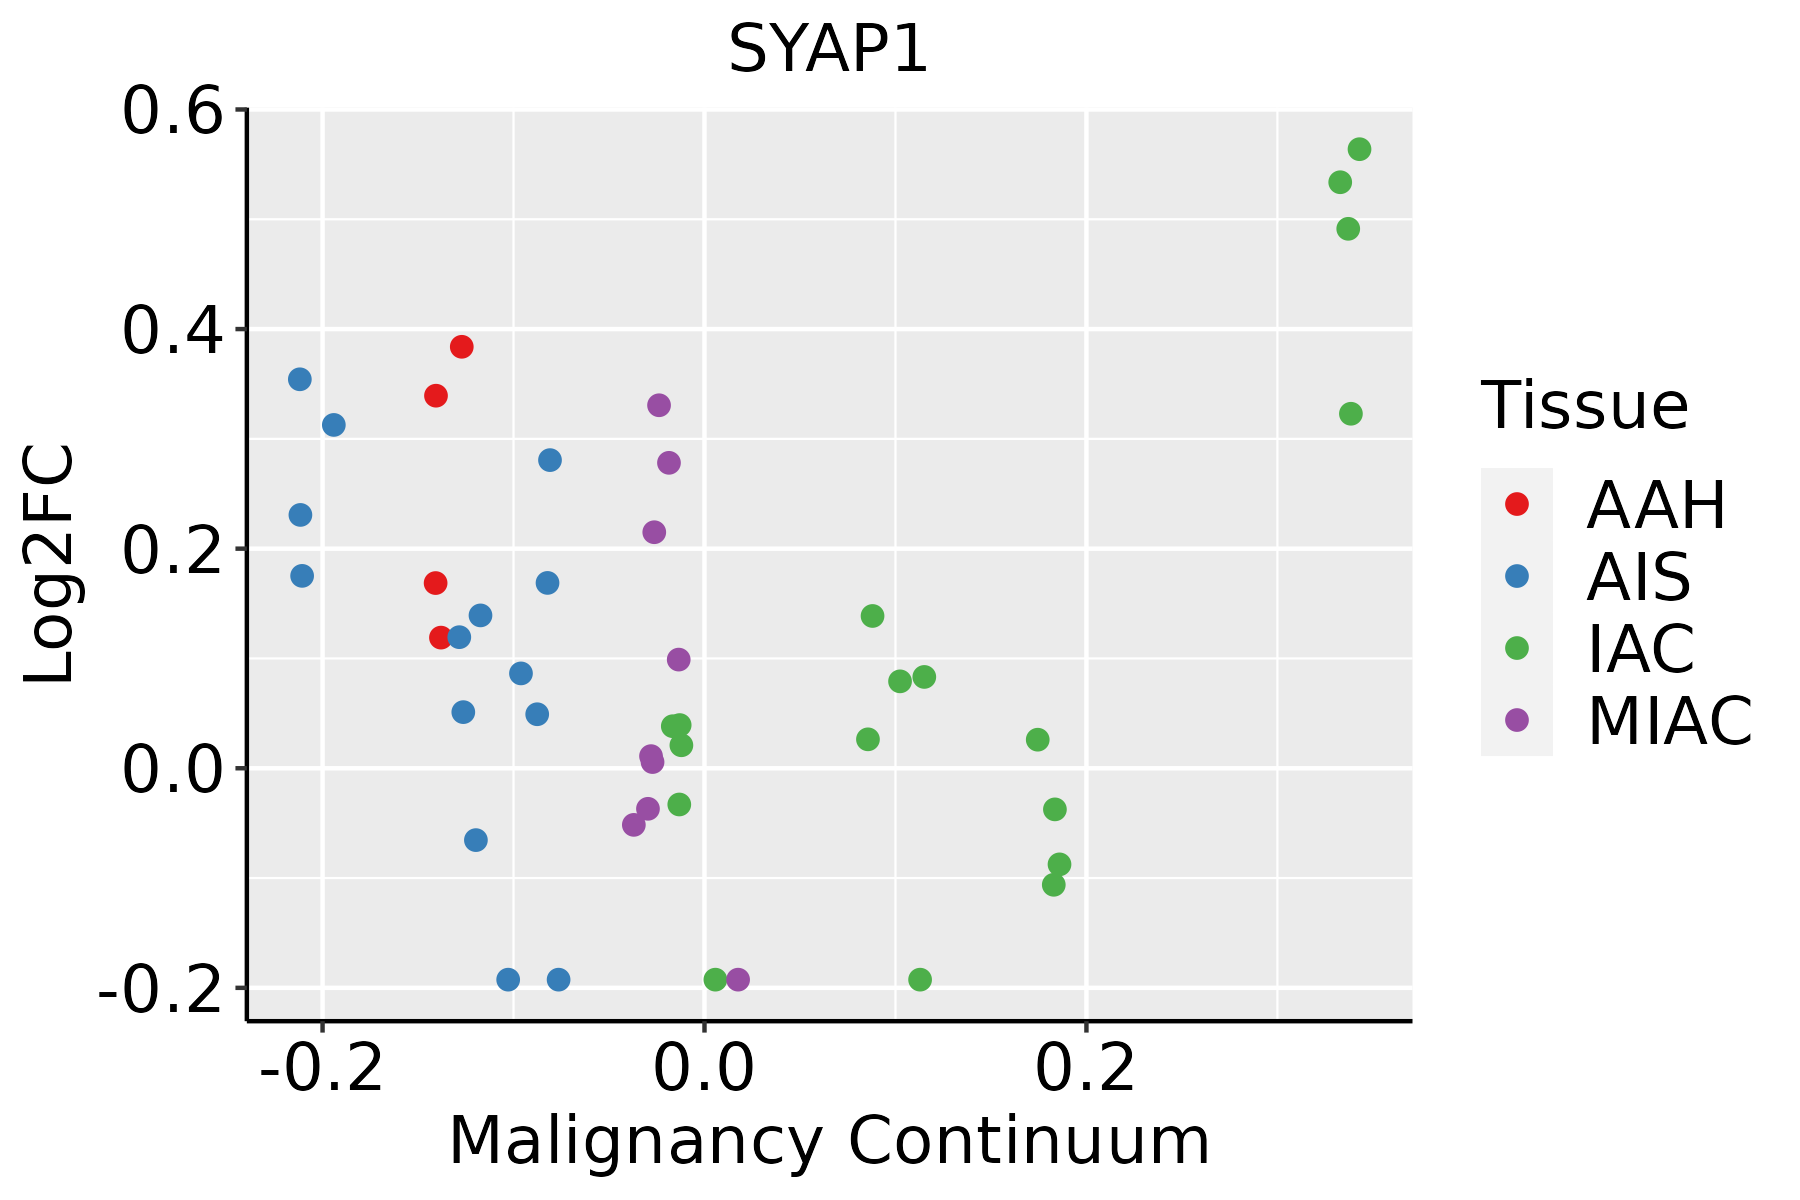 | AAH: Atypical adenomatous hyperplasia |
| AIS: Adenocarcinoma in situ | ||
| IAC: Invasive lung adenocarcinoma | ||
| MIA: Minimally invasive adenocarcinoma | ||
| Oral Cavity |  | EOLP: Erosive Oral lichen planus |
| LP: leukoplakia | ||
| NEOLP: Non-erosive oral lichen planus | ||
| OSCC: Oral squamous cell carcinoma | ||
| Prostate |  | BPH: Benign Prostatic Hyperplasia |
| Skin | 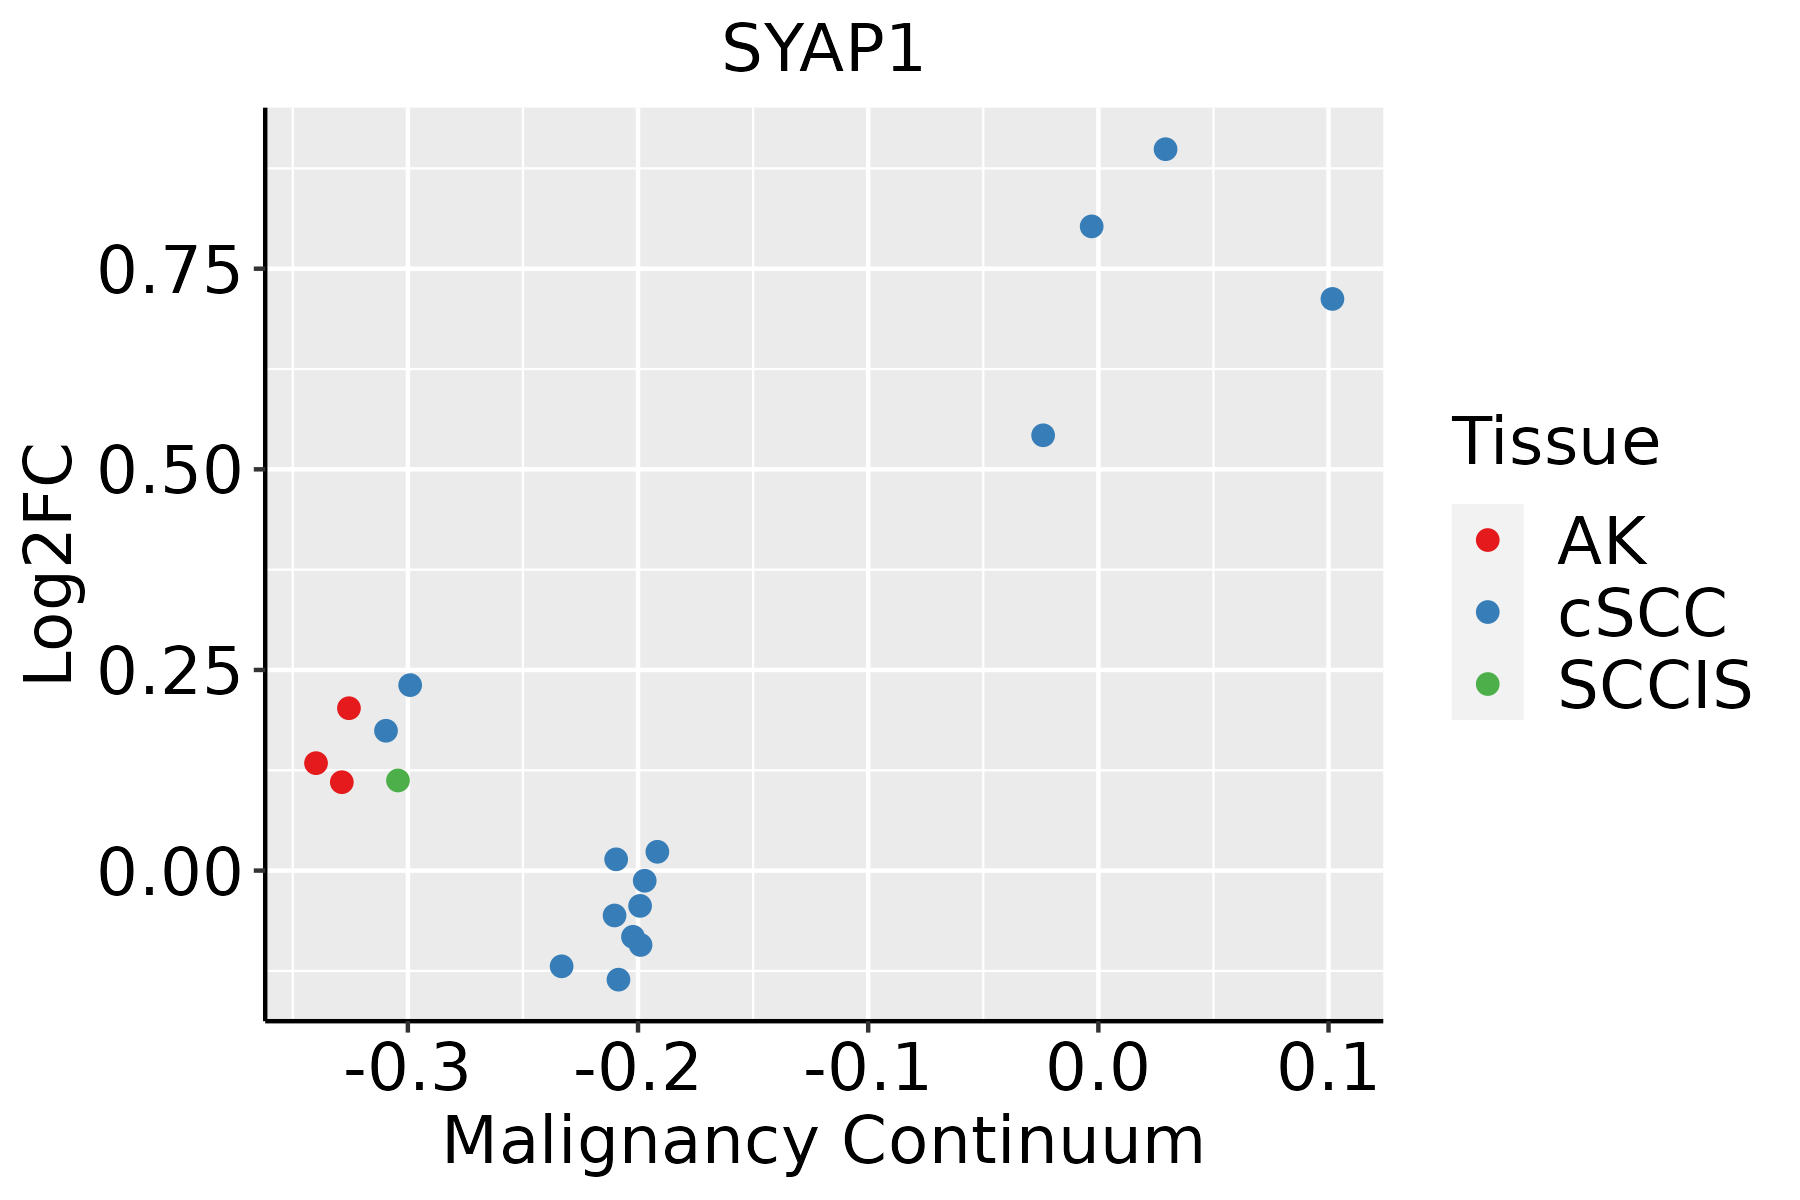 | AK: Actinic keratosis |
| cSCC: Cutaneous squamous cell carcinoma | ||
| SCCIS:squamous cell carcinoma in situ | ||
| Thyroid |  | ATC: Anaplastic thyroid cancer |
| HT: Hashimoto's thyroiditis | ||
| PTC: Papillary thyroid cancer |
| ∗log2FC in expression of this searched gene in stem-like cells from each diseased tissue sample relative to stem-like cells in normal samples in each tissue plotted against the malignancy continuum. Samples are colored based on if they are from different disease stage. |
Top |
Malignant transformation related pathway analysis |
| Find out the enriched GO biological processes and KEGG pathways involved in transition from healthy to precancer to cancer |
| Tissue | Disease Stage | Enriched GO biological Processes |
| Colorectum | AD |  |
| Colorectum | SER |  |
| Colorectum | MSS |  |
| Colorectum | MSI-H |  |
| Colorectum | FAP |  |
| ∗Top 15 enriched GO BP terms are showed in the bar plot of each disease state in each tissue. Each row represents a significant GO biological process which is colored according to the -log10(p.adjust). |
| Page: 1 2 3 4 5 6 7 8 9 |
| GO ID | Tissue | Disease Stage | Description | Gene Ratio | Bg Ratio | pvalue | p.adjust | Count |
| GO:00454444 | Breast | Precancer | fat cell differentiation | 26/1080 | 229/18723 | 7.60e-04 | 9.04e-03 | 26 |
| GO:00336749 | Breast | Precancer | positive regulation of kinase activity | 42/1080 | 467/18723 | 2.94e-03 | 2.54e-02 | 42 |
| GO:00713647 | Breast | Precancer | cellular response to epidermal growth factor stimulus | 8/1080 | 45/18723 | 3.82e-03 | 3.06e-02 | 8 |
| GO:00456003 | Breast | Precancer | positive regulation of fat cell differentiation | 10/1080 | 66/18723 | 4.34e-03 | 3.39e-02 | 10 |
| GO:00708497 | Breast | Precancer | response to epidermal growth factor | 8/1080 | 49/18723 | 6.53e-03 | 4.51e-02 | 8 |
| GO:00434348 | Breast | IDC | response to peptide hormone | 54/1434 | 414/18723 | 8.25e-05 | 1.61e-03 | 54 |
| GO:007136413 | Breast | IDC | cellular response to epidermal growth factor stimulus | 11/1434 | 45/18723 | 4.57e-04 | 6.13e-03 | 11 |
| GO:007084913 | Breast | IDC | response to epidermal growth factor | 11/1434 | 49/18723 | 9.88e-04 | 1.11e-02 | 11 |
| GO:004544412 | Breast | IDC | fat cell differentiation | 30/1434 | 229/18723 | 2.72e-03 | 2.41e-02 | 30 |
| GO:004560011 | Breast | IDC | positive regulation of fat cell differentiation | 12/1434 | 66/18723 | 3.99e-03 | 3.23e-02 | 12 |
| GO:00328687 | Breast | IDC | response to insulin | 32/1434 | 264/18723 | 6.61e-03 | 4.62e-02 | 32 |
| GO:00328697 | Breast | IDC | cellular response to insulin stimulus | 26/1434 | 203/18723 | 6.74e-03 | 4.68e-02 | 26 |
| GO:004343414 | Breast | DCIS | response to peptide hormone | 52/1390 | 414/18723 | 1.33e-04 | 2.28e-03 | 52 |
| GO:007136422 | Breast | DCIS | cellular response to epidermal growth factor stimulus | 10/1390 | 45/18723 | 1.43e-03 | 1.46e-02 | 10 |
| GO:004544421 | Breast | DCIS | fat cell differentiation | 30/1390 | 229/18723 | 1.70e-03 | 1.68e-02 | 30 |
| GO:007084922 | Breast | DCIS | response to epidermal growth factor | 10/1390 | 49/18723 | 2.80e-03 | 2.43e-02 | 10 |
| GO:004560021 | Breast | DCIS | positive regulation of fat cell differentiation | 12/1390 | 66/18723 | 3.10e-03 | 2.63e-02 | 12 |
| GO:003286813 | Breast | DCIS | response to insulin | 32/1390 | 264/18723 | 4.20e-03 | 3.31e-02 | 32 |
| GO:003286913 | Breast | DCIS | cellular response to insulin stimulus | 26/1390 | 203/18723 | 4.53e-03 | 3.47e-02 | 26 |
| GO:0032868 | Colorectum | AD | response to insulin | 91/3918 | 264/18723 | 2.02e-07 | 8.48e-06 | 91 |
| Page: 1 2 3 4 5 6 7 8 9 10 11 12 13 |
| Pathway ID | Tissue | Disease Stage | Description | Gene Ratio | Bg Ratio | pvalue | p.adjust | qvalue | Count |
| Page: 1 |
Top |
Cell-cell communication analysis |
| Identification of potential cell-cell interactions between two cell types and their ligand-receptor pairs for different disease states |
| Ligand | Receptor | LRpair | Pathway | Tissue | Disease Stage |
| Page: 1 |
Top |
Single-cell gene regulatory network inference analysis |
| Find out the significant the regulons (TFs) and the target genes of each regulon across cell types for different disease states |
| TF | Cell Type | Tissue | Disease Stage | Target Gene | RSS | Regulon Activity |
| ∗The dot plots of a searched regulon are shown for all cell subpopulations in each disease state of each tissue based on the regulon specific score inferred using pySCENIC and by calculating the average expression. |
| Page: 1 |
Top |
Somatic mutation of malignant transformation related genes |
| Annotation of somatic variants for genes involved in malignant transformation |
| Hugo Symbol | Variant Class | Variant Classification | dbSNP RS | HGVSc | HGVSp | HGVSp Short | SWISSPROT | BIOTYPE | SIFT | PolyPhen | Tumor Sample Barcode | Tissue | Histology | Sex | Age | Stage | Therapy Types | Drugs | Outcome |
| SYAP1 | SNV | Missense_Mutation | c.910N>C | p.Glu304Gln | p.E304Q | Q96A49 | protein_coding | tolerated(0.11) | benign(0.003) | TCGA-AN-A0FV-01 | Breast | breast invasive carcinoma | Female | <65 | I/II | Unknown | Unknown | SD | |
| SYAP1 | SNV | Missense_Mutation | novel | c.371N>C | p.Val124Ala | p.V124A | Q96A49 | protein_coding | deleterious(0) | benign(0.342) | TCGA-C5-A8ZZ-01 | Cervix | cervical & endocervical cancer | Female | <65 | I/II | Unspecific | Cisplatin | SD |
| SYAP1 | SNV | Missense_Mutation | novel | c.701G>C | p.Arg234Thr | p.R234T | Q96A49 | protein_coding | tolerated(0.63) | benign(0.024) | TCGA-C5-A902-01 | Cervix | cervical & endocervical cancer | Female | <65 | I/II | Chemotherapy | cisplatin | SD |
| SYAP1 | SNV | Missense_Mutation | c.912N>T | p.Glu304Asp | p.E304D | Q96A49 | protein_coding | tolerated(0.24) | benign(0) | TCGA-AA-3672-01 | Colorectum | colon adenocarcinoma | Female | >=65 | III/IV | Unknown | Unknown | SD | |
| SYAP1 | SNV | Missense_Mutation | rs140529370 | c.454N>T | p.Arg152Cys | p.R152C | Q96A49 | protein_coding | deleterious(0) | probably_damaging(0.994) | TCGA-CM-6162-01 | Colorectum | colon adenocarcinoma | Female | <65 | III/IV | Chemotherapy | oxaliplatin | SD |
| SYAP1 | SNV | Missense_Mutation | c.920N>T | p.Ala307Val | p.A307V | Q96A49 | protein_coding | tolerated(0.27) | benign(0) | TCGA-G4-6309-01 | Colorectum | colon adenocarcinoma | Female | <65 | III/IV | Chemotherapy | xeloda | PD | |
| SYAP1 | SNV | Missense_Mutation | novel | c.257C>T | p.Ser86Phe | p.S86F | Q96A49 | protein_coding | deleterious(0) | benign(0.326) | TCGA-A5-A1OF-01 | Endometrium | uterine corpus endometrioid carcinoma | Female | <65 | I/II | Unknown | Unknown | SD |
| SYAP1 | SNV | Missense_Mutation | c.565N>A | p.Val189Ile | p.V189I | Q96A49 | protein_coding | deleterious(0) | probably_damaging(0.999) | TCGA-AP-A0LM-01 | Endometrium | uterine corpus endometrioid carcinoma | Female | <65 | III/IV | Chemotherapy | cisplatin | SD | |
| SYAP1 | SNV | Missense_Mutation | rs140529370 | c.454N>T | p.Arg152Cys | p.R152C | Q96A49 | protein_coding | deleterious(0) | probably_damaging(0.994) | TCGA-AP-A1DV-01 | Endometrium | uterine corpus endometrioid carcinoma | Female | <65 | I/II | Unknown | Unknown | SD |
| SYAP1 | SNV | Missense_Mutation | c.1056N>G | p.Asn352Lys | p.N352K | Q96A49 | protein_coding | deleterious(0.01) | possibly_damaging(0.63) | TCGA-AX-A05Z-01 | Endometrium | uterine corpus endometrioid carcinoma | Female | <65 | III/IV | Chemotherapy | adriamycin | SD |
| Page: 1 2 3 4 |
Top |
Related drugs of malignant transformation related genes |
| Identification of chemicals and drugs interact with genes involved in malignant transfromation |
| (DGIdb 4.0) |
| Entrez ID | Symbol | Category | Interaction Types | Drug Claim Name | Drug Name | PMIDs |
| Page: 1 |

Copyright 2023-Present -The University of Texas Health Science Center at Houston |