Schematic overview of the cellular and molecular mechanisms involved in the cancer progression, including the proposed cellular and molecular mechanisms in cancer cells trajectory. AT1: alveolar type 1 cells; AT2: alveolar type 2 cells; AAH: atypical adenomatous hyperplasia; AIS: adenocarcinoma in situ; MIA: minimally invasive adenocarcinoma; IA: invasive adenocarcinoma; EMT: epithelial-mesenchymal transition

Home

Download

Statistics

Help

Contact

Center for Computational Systems Medicine
leaf

Gene summary

leaf

Malignant transformation analysis

leaf

Malignant transformation related pathway analysis

leaf

Cell-cell communication analysis

leaf

Single-cell gene regulatory network inference analysis

leaf

Somatic mutation of malignant transformation related genes

leaf

Related drugs of malignant transformation related genes

Gene: STXBP1

Gene summary for STXBP1

check button Gene summary.

Gene informationSpeciesHuman
Gene symbol

STXBP1

Gene ID

6812

Gene namesyntaxin binding protein 1
Gene AliasDEE4
Cytomap9q34.11
Gene Typeprotein-coding
GO ID

GO:0000003

UniProtAcc

P61764


Top

Malignant transformation analysis

check button Identification of the aberrant gene expression in precancerous and cancerous lesions by comparing the gene expression of stem-like cells in diseased tissues with normal stem cells
check button Malignant transformation involving gene list.
Entrez IDSymbolReplicatesSpeciesOrganTissueAdj P-valueLog2FCMalignancy
6812STXBP1LZE4THumanEsophagusESCC1.10e-025.60e-020.0811
6812STXBP1LZE24THumanEsophagusESCC2.96e-044.16e-020.0596
6812STXBP1P2T-EHumanEsophagusESCC1.04e-132.69e-010.1177
6812STXBP1P4T-EHumanEsophagusESCC3.21e-173.45e-010.1323
6812STXBP1P5T-EHumanEsophagusESCC2.53e-084.55e-020.1327
6812STXBP1P8T-EHumanEsophagusESCC4.78e-081.61e-020.0889
6812STXBP1P9T-EHumanEsophagusESCC4.93e-031.04e-010.1131
6812STXBP1P10T-EHumanEsophagusESCC3.49e-202.50e-010.116
6812STXBP1P11T-EHumanEsophagusESCC1.65e-083.88e-010.1426
6812STXBP1P15T-EHumanEsophagusESCC3.50e-091.71e-010.1149
6812STXBP1P16T-EHumanEsophagusESCC1.09e-111.19e-010.1153
6812STXBP1P17T-EHumanEsophagusESCC3.44e-042.50e-010.1278
6812STXBP1P19T-EHumanEsophagusESCC6.65e-052.49e-010.1662
6812STXBP1P21T-EHumanEsophagusESCC2.95e-256.03e-010.1617
6812STXBP1P22T-EHumanEsophagusESCC3.96e-193.00e-010.1236
6812STXBP1P23T-EHumanEsophagusESCC6.04e-043.87e-020.108
6812STXBP1P24T-EHumanEsophagusESCC2.41e-112.50e-010.1287
6812STXBP1P26T-EHumanEsophagusESCC2.46e-152.09e-010.1276
6812STXBP1P27T-EHumanEsophagusESCC5.05e-109.59e-020.1055
6812STXBP1P28T-EHumanEsophagusESCC3.22e-111.44e-010.1149
Page: 1 2 3 4 5 

check button Transcriptomic changes along malignancy continuum.
TissueExpression DynamicsAbbreviation
Colorectum (GSE201348)The image shows the transcriptomic changes along malignancy continuum.log2FC in expression of this searched gene in stem-like cells from each diseased tissue sample relative to stem-like cells in normal samples in each tissue plotted against the malignancy continuum. Samples are colored based on if they are from different disease stage.FAP: Familial adenomatous polyposis
CRC: Colorectal cancer
Colorectum (HTA11)The image shows the transcriptomic changes along malignancy continuum.log2FC in expression of this searched gene in stem-like cells from each diseased tissue sample relative to stem-like cells in normal samples in each tissue plotted against the malignancy continuum. Samples are colored based on if they are from different disease stage.AD: Adenomas
SER: Sessile serrated lesions
MSI-H: Microsatellite-high colorectal cancer
MSS: Microsatellite stable colorectal cancer
EsophagusThe image shows the transcriptomic changes along malignancy continuum.log2FC in expression of this searched gene in stem-like cells from each diseased tissue sample relative to stem-like cells in normal samples in each tissue plotted against the malignancy continuum. Samples are colored based on if they are from different disease stage.ESCC: Esophageal squamous cell carcinoma
HGIN: High-grade intraepithelial neoplasias
LGIN: Low-grade intraepithelial neoplasias
LiverThe image shows the transcriptomic changes along malignancy continuum.log2FC in expression of this searched gene in stem-like cells from each diseased tissue sample relative to stem-like cells in normal samples in each tissue plotted against the malignancy continuum. Samples are colored based on if they are from different disease stage.
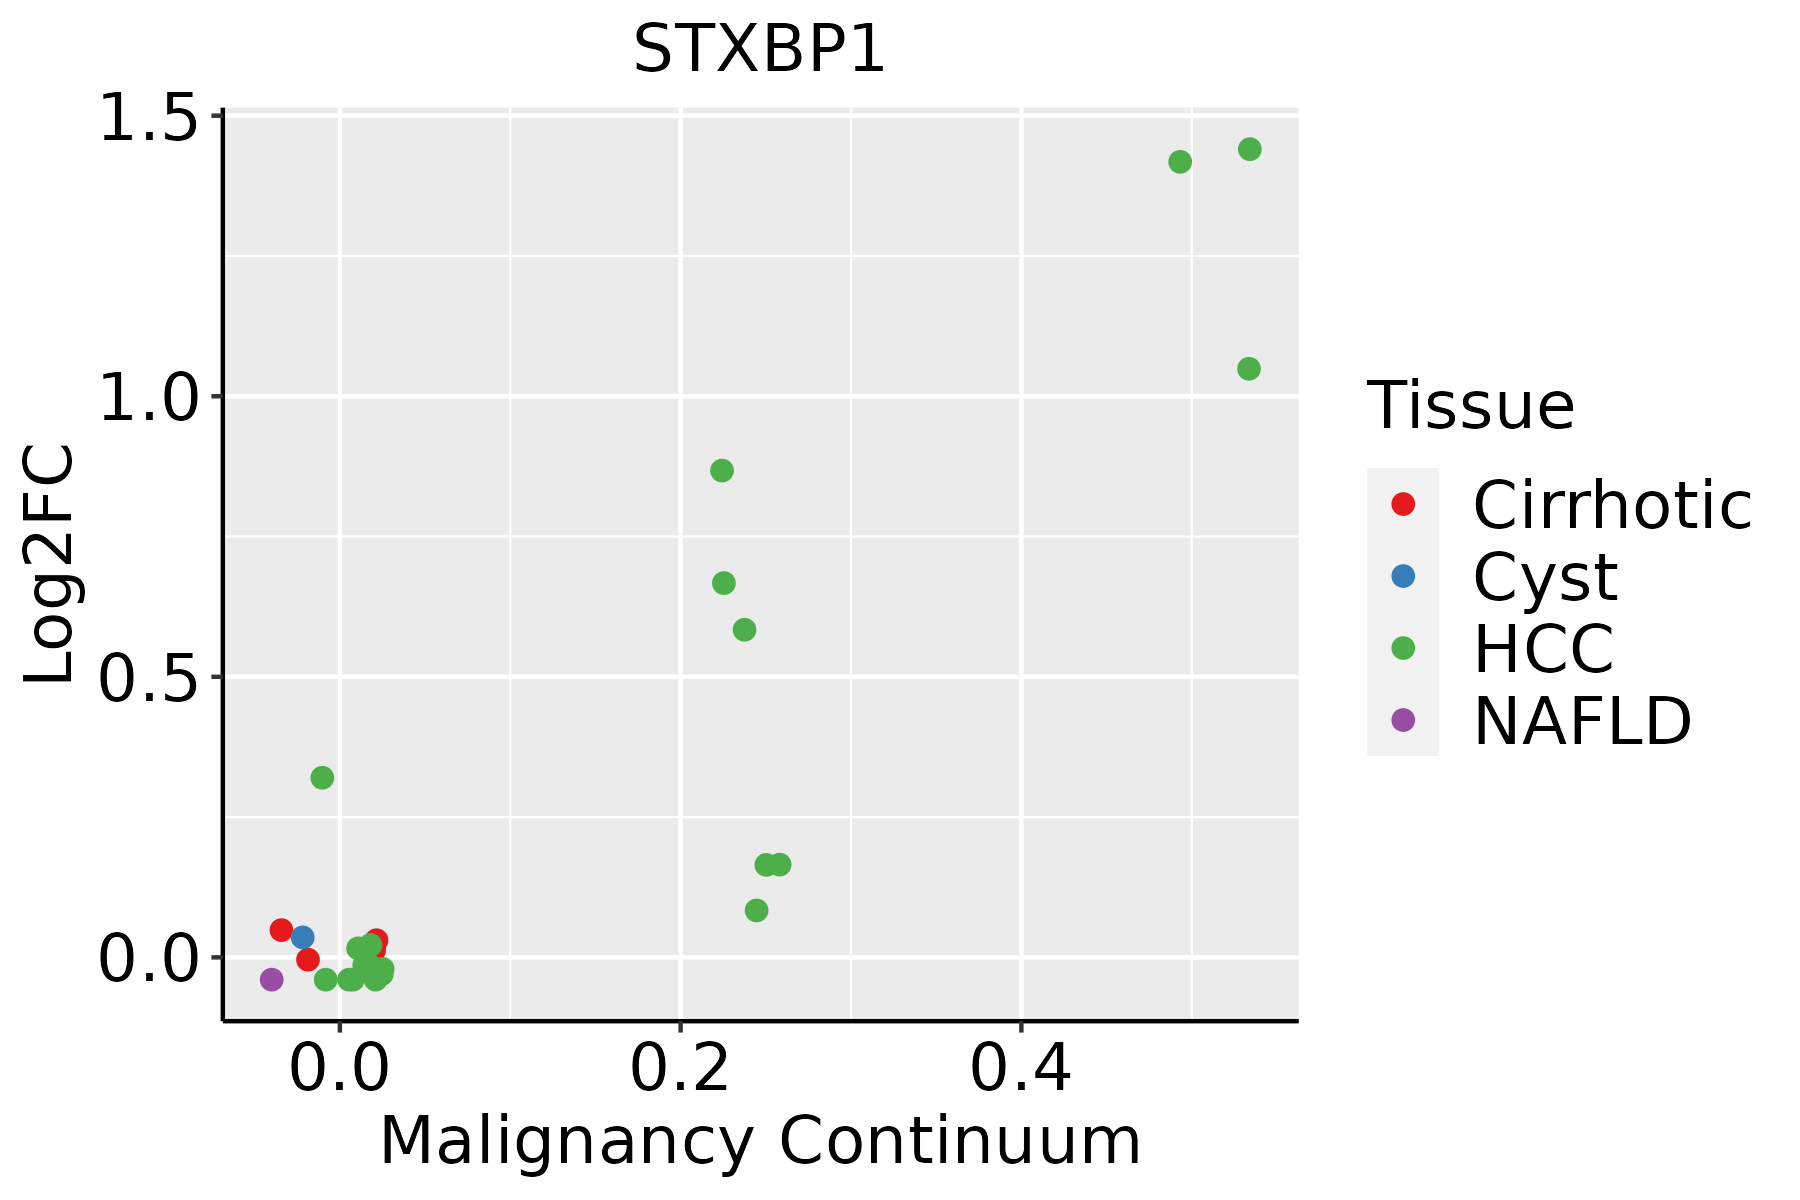
HCC: Hepatocellular carcinoma
NAFLD: Non-alcoholic fatty liver disease
∗log2FC in expression of this searched gene in stem-like cells from each diseased tissue sample relative to stem-like cells in normal samples in each tissue plotted against the malignancy continuum. Samples are colored based on if they are from different disease stage.

Top

Malignant transformation related pathway analysis

check buttonFind out the enriched GO biological processes and KEGG pathways involved in transition from healthy to precancer to cancer
check button Figure of enriched GO biological processes.
TissueDisease StageEnriched GO biological Processes
ColorectumADGO analysis - Figure of enriched GO biological processes: Top 15 enriched GO BP terms are showed in the bar plot of each disease state in each tissue. Each row represents a significant GO biological process which is colored according to the -log10(p.adjust).
ColorectumSERGO analysis - Figure of enriched GO biological processes: Top 15 enriched GO BP terms are showed in the bar plot of each disease state in each tissue. Each row represents a significant GO biological process which is colored according to the -log10(p.adjust).
ColorectumMSSGO analysis - Figure of enriched GO biological processes: Top 15 enriched GO BP terms are showed in the bar plot of each disease state in each tissue. Each row represents a significant GO biological process which is colored according to the -log10(p.adjust).
ColorectumMSI-HGO analysis - Figure of enriched GO biological processes: Top 15 enriched GO BP terms are showed in the bar plot of each disease state in each tissue. Each row represents a significant GO biological process which is colored according to the -log10(p.adjust).
ColorectumFAPGO analysis - Figure of enriched GO biological processes: Top 15 enriched GO BP terms are showed in the bar plot of each disease state in each tissue. Each row represents a significant GO biological process which is colored according to the -log10(p.adjust).
∗Top 15 enriched GO BP terms are showed in the bar plot of each disease state in each tissue. Each row represents a significant GO biological process which is colored according to the -log10(p.adjust).
Page: 1 2 3 4 5 6 7 8 9 

check button Enriched GO biological processes.
GO IDTissueDisease StageDescriptionGene RatioBg Ratiopvaluep.adjustCount
GO:0072659ColorectumADprotein localization to plasma membrane122/3918284/187232.86e-171.49e-14122
GO:1990778ColorectumADprotein localization to cell periphery129/3918333/187235.51e-141.15e-11129
GO:0043254ColorectumADregulation of protein-containing complex assembly148/3918428/187232.64e-113.18e-09148
GO:0031647ColorectumADregulation of protein stability108/3918298/187236.33e-105.08e-08108
GO:0051656ColorectumADestablishment of organelle localization131/3918390/187233.00e-092.06e-07131
GO:0050821ColorectumADprotein stabilization73/3918191/187233.02e-081.64e-0673
GO:0016050ColorectumADvesicle organization101/3918300/187231.65e-077.17e-06101
GO:0034109ColorectumADhomotypic cell-cell adhesion40/391890/187234.37e-071.67e-0540
GO:0070997ColorectumADneuron death114/3918361/187231.13e-063.72e-05114
GO:0042060ColorectumADwound healing128/3918422/187232.73e-067.89e-05128
GO:0031333ColorectumADnegative regulation of protein-containing complex assembly52/3918141/187239.27e-062.18e-0452
GO:1901214ColorectumADregulation of neuron death99/3918319/187231.26e-052.76e-0499
GO:0007409ColorectumADaxonogenesis122/3918418/187233.36e-056.15e-04122
GO:0051402ColorectumADneuron apoptotic process77/3918246/187238.07e-051.28e-0377
GO:0061564ColorectumADaxon development132/3918467/187238.40e-051.31e-03132
GO:1901215ColorectumADnegative regulation of neuron death67/3918208/187238.81e-051.35e-0367
GO:0045921ColorectumADpositive regulation of exocytosis33/391886/187231.58e-042.20e-0333
GO:0050878ColorectumADregulation of body fluid levels108/3918379/187232.54e-043.20e-03108
GO:0051047ColorectumADpositive regulation of secretion90/3918310/187234.11e-044.66e-0390
GO:0070527ColorectumADplatelet aggregation26/391867/187236.20e-046.48e-0326
Page: 1 2 3 4 5 6 7 8 9 10 

check button Enriched KEGG pathways.
Pathway IDTissueDisease StageDescriptionGene RatioBg Ratiopvaluep.adjustqvalueCount
Page: 1 

Top

Cell-cell communication analysis

check buttonIdentification of potential cell-cell interactions between two cell types and their ligand-receptor pairs for different disease states
LigandReceptorLRpairPathwayTissueDisease Stage
Page: 1 

Top

Single-cell gene regulatory network inference analysis

check buttonFind out the significant the regulons (TFs) and the target genes of each regulon across cell types for different disease states
TFCell TypeTissueDisease StageTarget GeneRSSRegulon Activity
∗The dot plots of a searched regulon are shown for all cell subpopulations in each disease state of each tissue based on the regulon specific score inferred using pySCENIC and by calculating the average expression.
Page: 1 

Top

Somatic mutation of malignant transformation related genes

check buttonAnnotation of somatic variants for genes involved in malignant transformation
Hugo SymbolVariant ClassVariant ClassificationdbSNP RSHGVScHGVSpHGVSp ShortSWISSPROTBIOTYPESIFTPolyPhenTumor Sample BarcodeTissueHistologySexAgeStageTherapy TypesDrugsOutcome
STXBP1SNVMissense_Mutationnovelc.605N>Ap.Ala202Aspp.A202DP61764protein_codingdeleterious(0)possibly_damaging(0.816)TCGA-AN-A046-01Breastbreast invasive carcinomaFemale>=65I/IIUnknownUnknownSD
STXBP1SNVMissense_Mutationc.406G>Ap.Ala136Thrp.A136TP61764protein_codingdeleterious(0.01)probably_damaging(0.996)TCGA-BH-A0AW-01Breastbreast invasive carcinomaFemale<65I/IIChemotherapycarboplatinSD
STXBP1SNVMissense_Mutationc.821N>Tp.Ala274Valp.A274VP61764protein_codingtolerated(0.23)benign(0.005)TCGA-C8-A131-01Breastbreast invasive carcinomaFemale>=65III/IVChemotherapy5-fluorouracilCR
STXBP1insertionFrame_Shift_Insnovelc.1327_1328insTCATATTp.Met443IlefsTer51p.M443Ifs*51P61764protein_codingTCGA-AN-A0FX-01Breastbreast invasive carcinomaFemale<65I/IIUnknownUnknownSD
STXBP1insertionNonsense_Mutationnovelc.1329_1330insTCCGTGCCAGGTTTTTAATTGGTTTCCATTTTTp.Met443_Ala444insSerValProGlyPheTerLeuValSerIlePhep.M443_A444insSVPGF*LVSIFP61764protein_codingTCGA-AN-A0FX-01Breastbreast invasive carcinomaFemale<65I/IIUnknownUnknownSD
STXBP1insertionIn_Frame_Insnovelc.1646_1647insCCTTCTCATp.Glu549delinsAspLeuLeuMetp.E549delinsDLLMP61764protein_codingTCGA-BH-A0AY-01Breastbreast invasive carcinomaFemale<65I/IIChemotherapySD
STXBP1insertionIn_Frame_Insnovelc.1647_1648insGCAGCAGAGGTAAAACGTTTTTTGCCAAATp.Glu549_Met550insAlaAlaGluValLysArgPheLeuProAsnp.E549_M550insAAEVKRFLPNP61764protein_codingTCGA-BH-A0AY-01Breastbreast invasive carcinomaFemale<65I/IIChemotherapySD
STXBP1SNVMissense_Mutationnovelc.278N>Gp.Asp93Glyp.D93GP61764protein_codingtolerated(0.65)benign(0.009)TCGA-2W-A8YY-01Cervixcervical & endocervical cancerFemale<65I/IIChemotherapycisplatinCR
STXBP1SNVMissense_Mutationnovelc.495N>Tp.Lys165Asnp.K165NP61764protein_codingdeleterious(0.04)possibly_damaging(0.572)TCGA-2W-A8YY-01Cervixcervical & endocervical cancerFemale<65I/IIChemotherapycisplatinCR
STXBP1SNVMissense_Mutationrs794727970c.704N>Ap.Arg235Glnp.R235QP61764protein_codingdeleterious(0.01)probably_damaging(1)TCGA-C5-A1BK-01Cervixcervical & endocervical cancerFemale<65I/IIUnknownUnknownSD
Page: 1 2 3 4 5 6 7 8 

Top

Related drugs of malignant transformation related genes

check buttonIdentification of chemicals and drugs interact with genes involved in malignant transfromation
(DGIdb 4.0)
Entrez IDSymbolCategoryInteraction TypesDrug Claim NameDrug NamePMIDs
Page: 1