
|
|||||
|
 | |
| |
| |
| |
| |
| |
|
Gene: STX6 |
Gene summary for STX6 |
| Gene information | Species | Human | Gene symbol | STX6 | Gene ID | 10228 |
| Gene name | syntaxin 6 | |
| Gene Alias | STX6 | |
| Cytomap | 1q25.3 | |
| Gene Type | protein-coding | GO ID | GO:0006810 | UniProtAcc | O43752 |
Top |
Malignant transformation analysis |
| Identification of the aberrant gene expression in precancerous and cancerous lesions by comparing the gene expression of stem-like cells in diseased tissues with normal stem cells |
| Entrez ID | Symbol | Replicates | Species | Organ | Tissue | Adj P-value | Log2FC | Malignancy |
| 10228 | STX6 | P17T-E | Human | Esophagus | ESCC | 1.51e-03 | 2.11e-01 | 0.1278 |
| 10228 | STX6 | P19T-E | Human | Esophagus | ESCC | 1.73e-04 | 5.70e-01 | 0.1662 |
| 10228 | STX6 | P20T-E | Human | Esophagus | ESCC | 1.63e-20 | 5.14e-01 | 0.1124 |
| 10228 | STX6 | P21T-E | Human | Esophagus | ESCC | 1.54e-28 | 5.49e-01 | 0.1617 |
| 10228 | STX6 | P22T-E | Human | Esophagus | ESCC | 5.38e-30 | 5.16e-01 | 0.1236 |
| 10228 | STX6 | P23T-E | Human | Esophagus | ESCC | 3.24e-30 | 7.07e-01 | 0.108 |
| 10228 | STX6 | P24T-E | Human | Esophagus | ESCC | 4.67e-21 | 4.09e-01 | 0.1287 |
| 10228 | STX6 | P26T-E | Human | Esophagus | ESCC | 1.81e-38 | 7.05e-01 | 0.1276 |
| 10228 | STX6 | P27T-E | Human | Esophagus | ESCC | 1.66e-24 | 3.56e-01 | 0.1055 |
| 10228 | STX6 | P28T-E | Human | Esophagus | ESCC | 2.98e-27 | 5.60e-01 | 0.1149 |
| 10228 | STX6 | P30T-E | Human | Esophagus | ESCC | 5.16e-35 | 9.79e-01 | 0.137 |
| 10228 | STX6 | P31T-E | Human | Esophagus | ESCC | 1.07e-22 | 3.86e-01 | 0.1251 |
| 10228 | STX6 | P32T-E | Human | Esophagus | ESCC | 1.18e-24 | 4.40e-01 | 0.1666 |
| 10228 | STX6 | P36T-E | Human | Esophagus | ESCC | 2.91e-18 | 5.51e-01 | 0.1187 |
| 10228 | STX6 | P37T-E | Human | Esophagus | ESCC | 1.32e-12 | 2.31e-01 | 0.1371 |
| 10228 | STX6 | P38T-E | Human | Esophagus | ESCC | 2.67e-02 | 1.60e-01 | 0.127 |
| 10228 | STX6 | P39T-E | Human | Esophagus | ESCC | 5.47e-14 | 2.71e-01 | 0.0894 |
| 10228 | STX6 | P40T-E | Human | Esophagus | ESCC | 1.07e-15 | 5.34e-01 | 0.109 |
| 10228 | STX6 | P42T-E | Human | Esophagus | ESCC | 5.78e-20 | 6.34e-01 | 0.1175 |
| 10228 | STX6 | P44T-E | Human | Esophagus | ESCC | 4.53e-02 | 1.45e-01 | 0.1096 |
| Page: 1 2 3 4 5 |
| Tissue | Expression Dynamics | Abbreviation |
| Cervix | 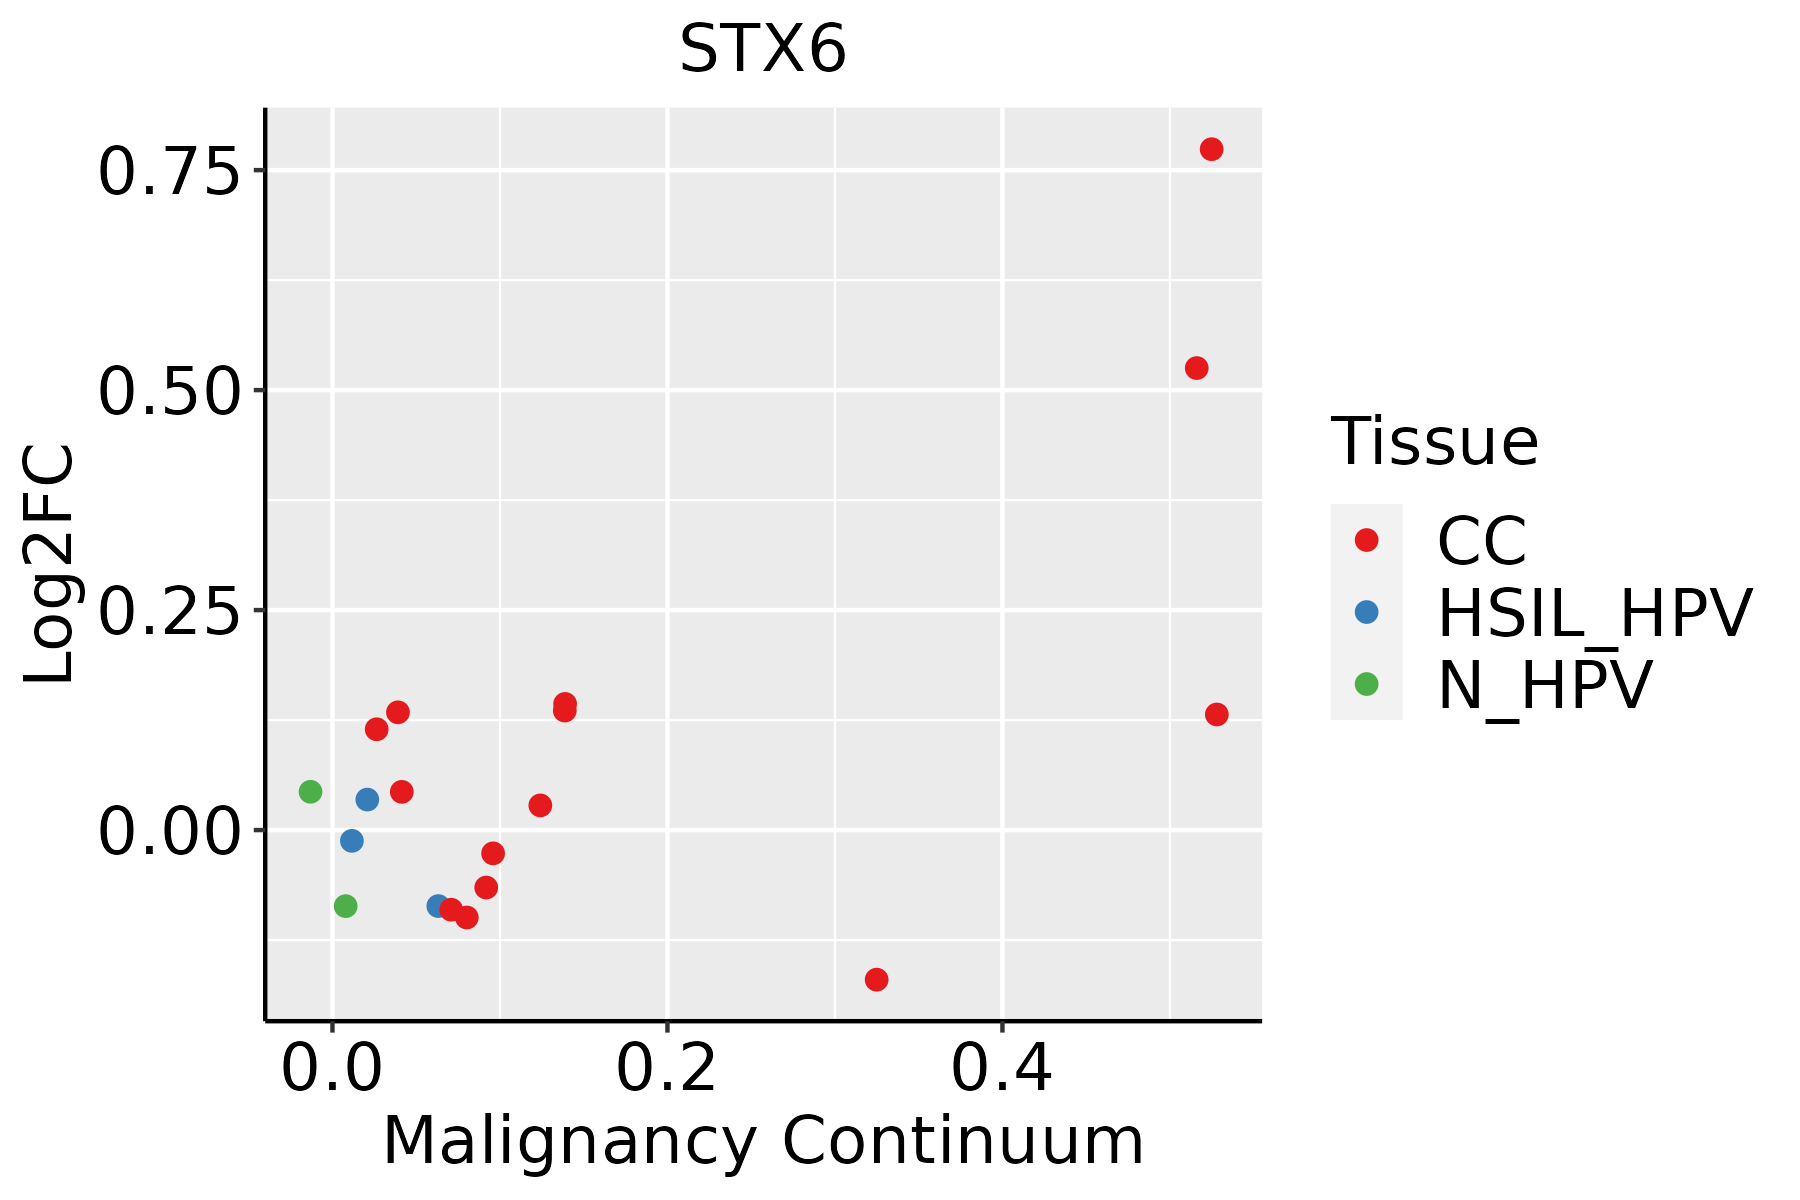 | CC: Cervix cancer |
| HSIL_HPV: HPV-infected high-grade squamous intraepithelial lesions | ||
| N_HPV: HPV-infected normal cervix | ||
| Esophagus | 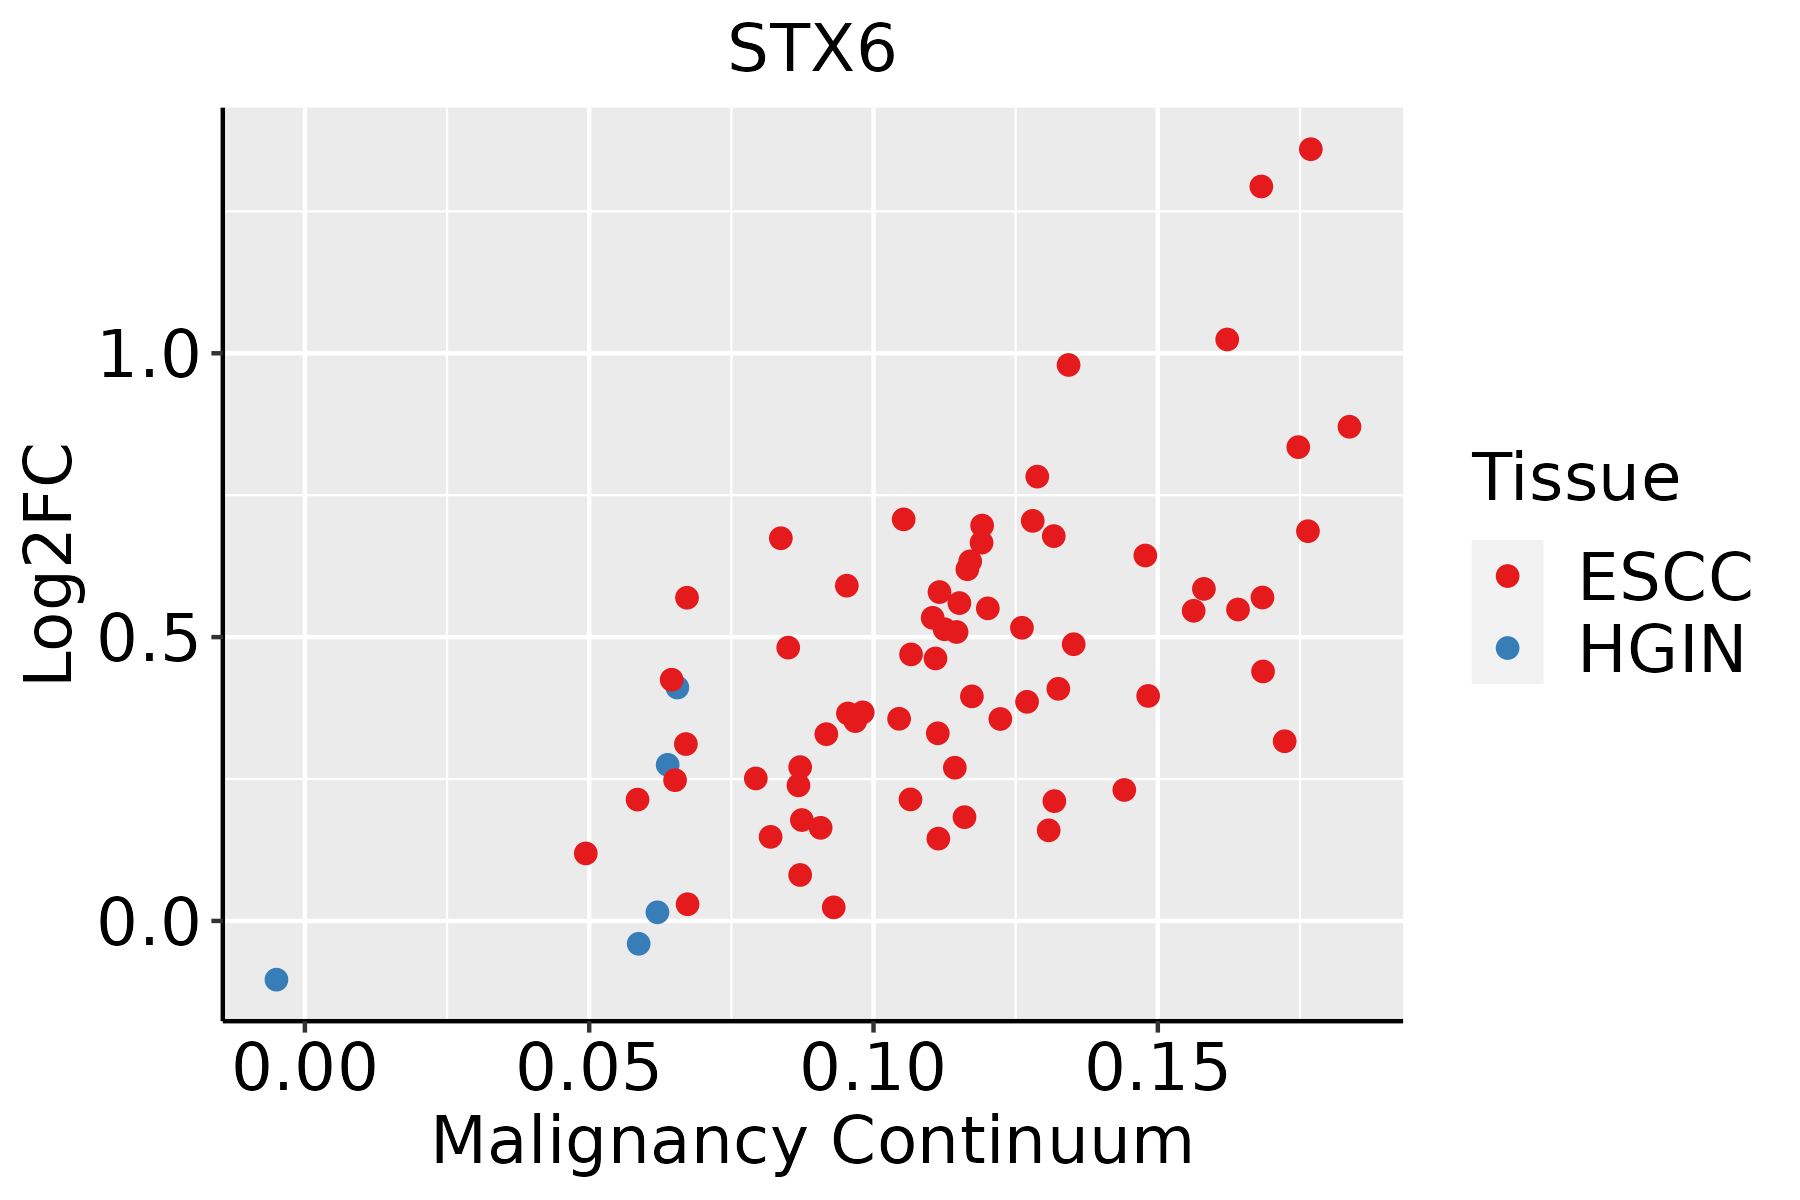 | ESCC: Esophageal squamous cell carcinoma |
| HGIN: High-grade intraepithelial neoplasias | ||
| LGIN: Low-grade intraepithelial neoplasias | ||
| Liver | 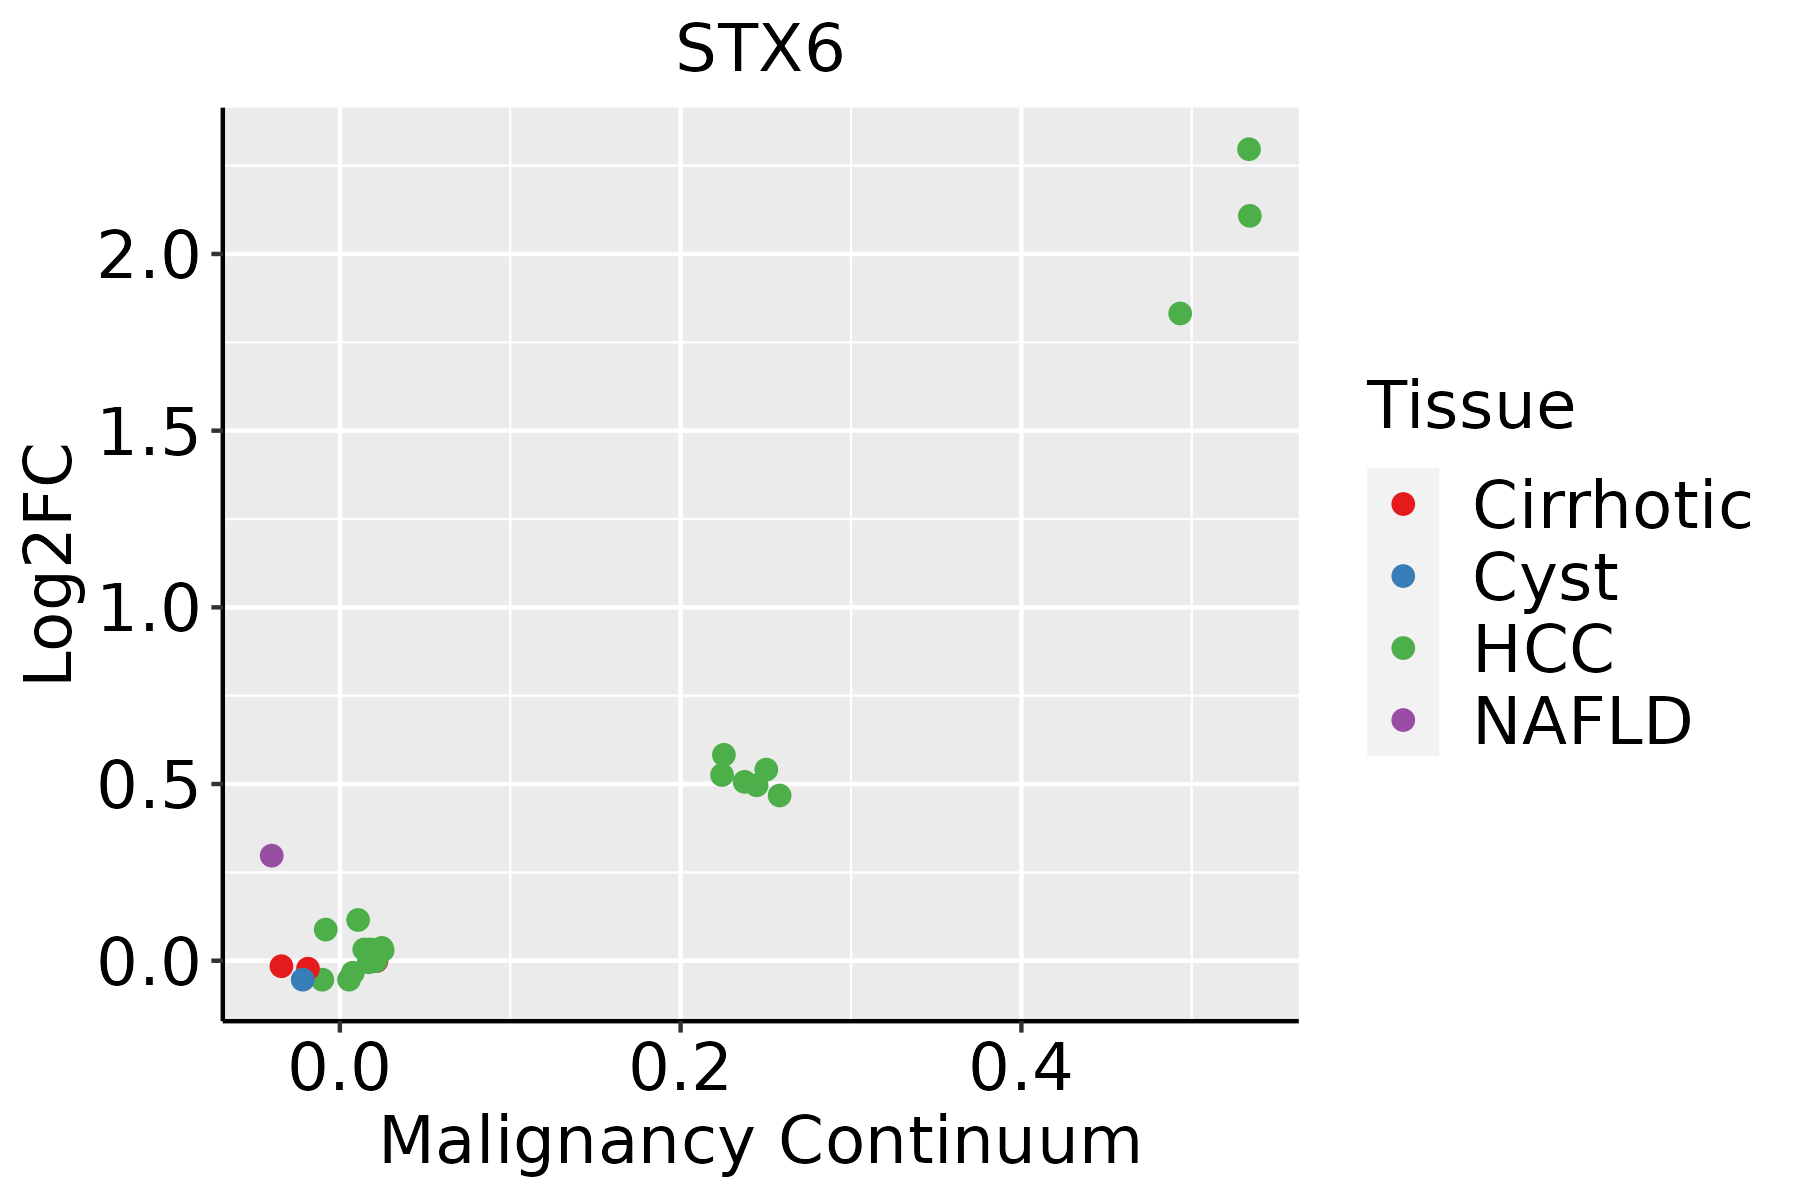 | HCC: Hepatocellular carcinoma |
| NAFLD: Non-alcoholic fatty liver disease | ||
| Oral Cavity | 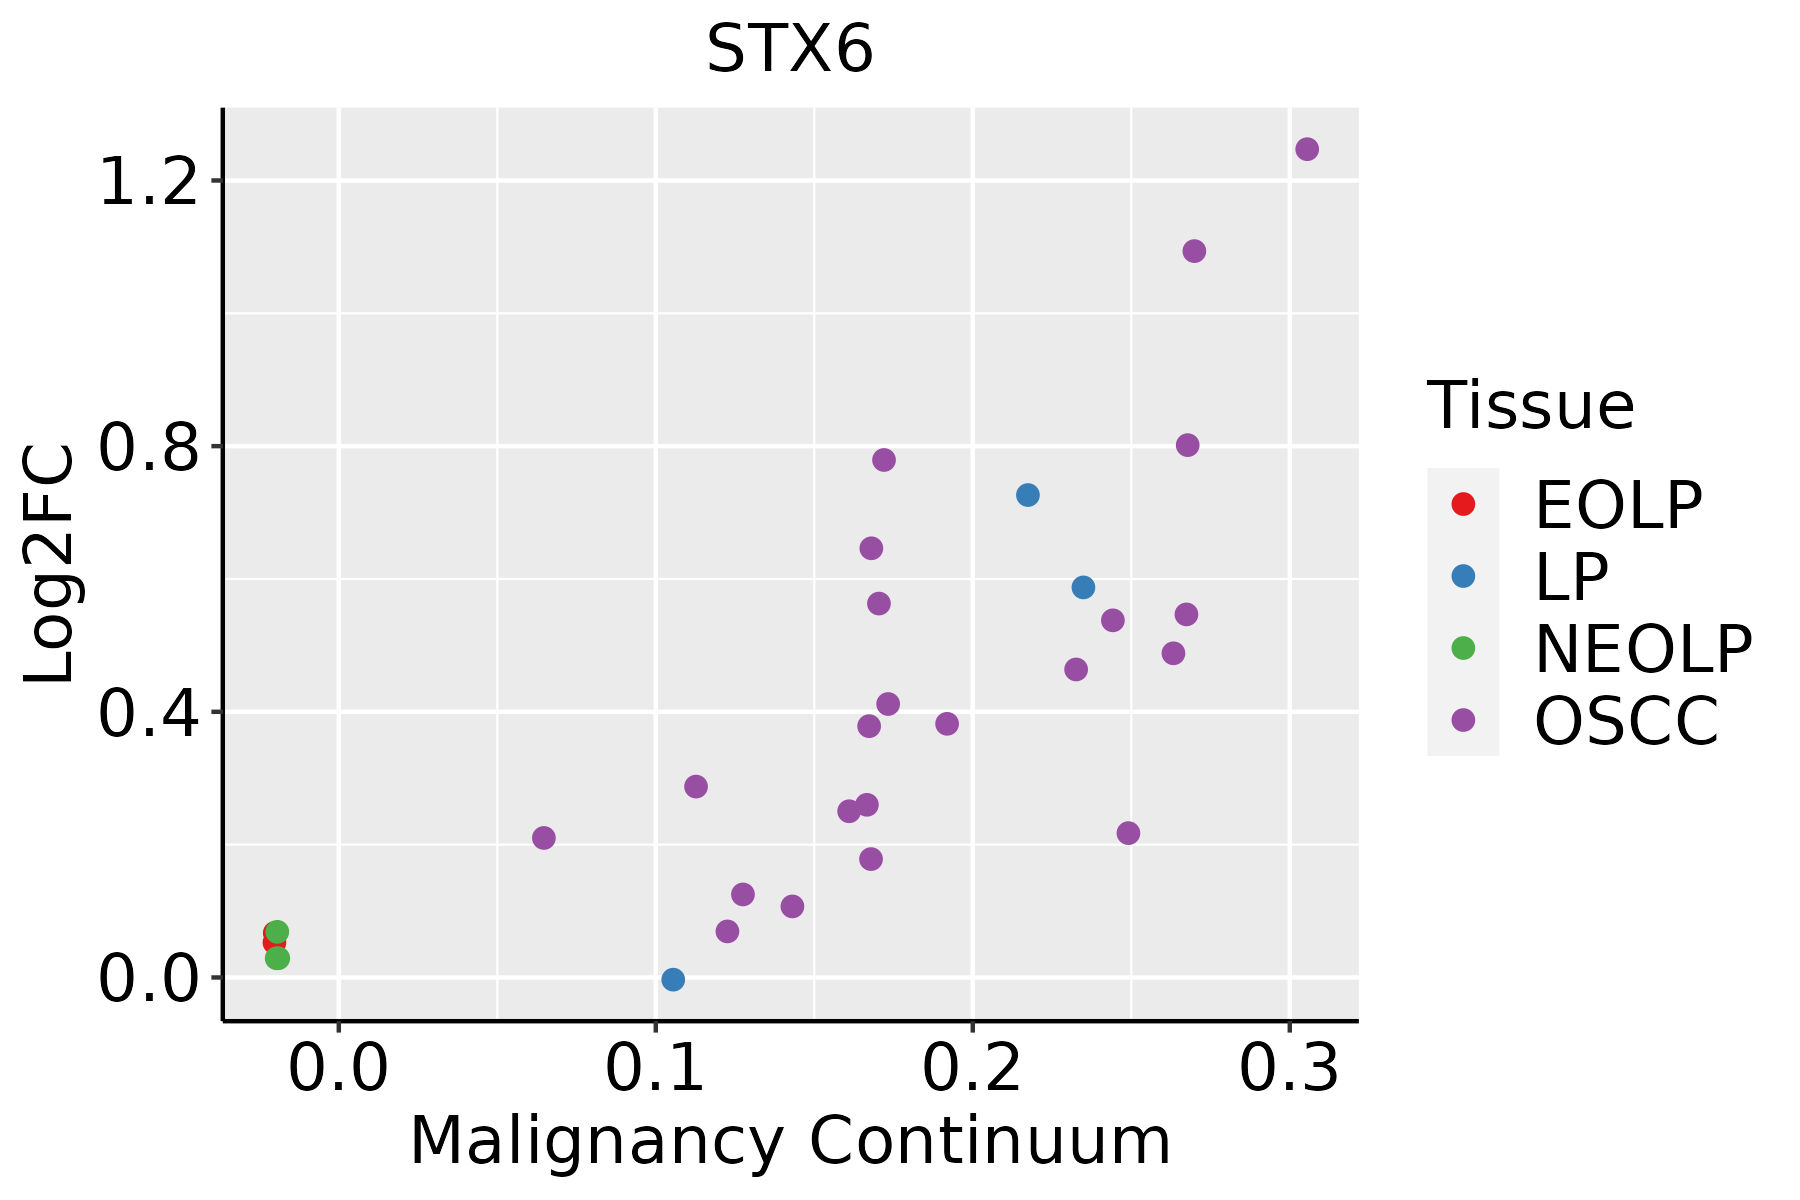 | EOLP: Erosive Oral lichen planus |
| LP: leukoplakia | ||
| NEOLP: Non-erosive oral lichen planus | ||
| OSCC: Oral squamous cell carcinoma | ||
| Skin |  | AK: Actinic keratosis |
| cSCC: Cutaneous squamous cell carcinoma | ||
| SCCIS:squamous cell carcinoma in situ |
| ∗log2FC in expression of this searched gene in stem-like cells from each diseased tissue sample relative to stem-like cells in normal samples in each tissue plotted against the malignancy continuum. Samples are colored based on if they are from different disease stage. |
Top |
Malignant transformation related pathway analysis |
| Find out the enriched GO biological processes and KEGG pathways involved in transition from healthy to precancer to cancer |
| Tissue | Disease Stage | Enriched GO biological Processes |
| Colorectum | AD |  |
| Colorectum | SER |  |
| Colorectum | MSS |  |
| Colorectum | MSI-H |  |
| Colorectum | FAP |  |
| ∗Top 15 enriched GO BP terms are showed in the bar plot of each disease state in each tissue. Each row represents a significant GO biological process which is colored according to the -log10(p.adjust). |
| Page: 1 2 3 4 5 6 7 8 9 |
| GO ID | Tissue | Disease Stage | Description | Gene Ratio | Bg Ratio | pvalue | p.adjust | Count |
| GO:00988767 | Cervix | CC | vesicle-mediated transport to the plasma membrane | 34/2311 | 136/18723 | 3.75e-05 | 5.91e-04 | 34 |
| GO:00161977 | Cervix | CC | endosomal transport | 48/2311 | 230/18723 | 1.65e-04 | 1.97e-03 | 48 |
| GO:00481938 | Cervix | CC | Golgi vesicle transport | 58/2311 | 296/18723 | 2.24e-04 | 2.54e-03 | 58 |
| GO:00995322 | Cervix | CC | synaptic vesicle endosomal processing | 6/2311 | 10/18723 | 4.73e-04 | 4.68e-03 | 6 |
| GO:00160506 | Cervix | CC | vesicle organization | 54/2311 | 300/18723 | 2.71e-03 | 1.85e-02 | 54 |
| GO:00070304 | Cervix | CC | Golgi organization | 32/2311 | 157/18723 | 2.78e-03 | 1.87e-02 | 32 |
| GO:00164827 | Cervix | CC | cytosolic transport | 33/2311 | 168/18723 | 4.43e-03 | 2.70e-02 | 33 |
| GO:004819318 | Esophagus | ESCC | Golgi vesicle transport | 231/8552 | 296/18723 | 1.82e-30 | 9.63e-28 | 231 |
| GO:001605014 | Esophagus | ESCC | vesicle organization | 211/8552 | 300/18723 | 2.85e-18 | 2.87e-16 | 211 |
| GO:001619715 | Esophagus | ESCC | endosomal transport | 168/8552 | 230/18723 | 2.28e-17 | 1.93e-15 | 168 |
| GO:001648210 | Esophagus | ESCC | cytosolic transport | 124/8552 | 168/18723 | 9.69e-14 | 4.69e-12 | 124 |
| GO:009887615 | Esophagus | ESCC | vesicle-mediated transport to the plasma membrane | 99/8552 | 136/18723 | 1.13e-10 | 3.39e-09 | 99 |
| GO:000703214 | Esophagus | ESCC | endosome organization | 61/8552 | 82/18723 | 1.13e-07 | 1.85e-06 | 61 |
| GO:00482844 | Esophagus | ESCC | organelle fusion | 94/8552 | 141/18723 | 3.72e-07 | 5.16e-06 | 94 |
| GO:00224069 | Esophagus | ESCC | membrane docking | 62/8552 | 86/18723 | 5.93e-07 | 7.79e-06 | 62 |
| GO:00070308 | Esophagus | ESCC | Golgi organization | 101/8552 | 157/18723 | 1.78e-06 | 2.10e-05 | 101 |
| GO:00421477 | Esophagus | ESCC | retrograde transport, endosome to Golgi | 63/8552 | 91/18723 | 4.58e-06 | 4.87e-05 | 63 |
| GO:00901743 | Esophagus | ESCC | organelle membrane fusion | 73/8552 | 110/18723 | 9.29e-06 | 8.88e-05 | 73 |
| GO:00069063 | Esophagus | ESCC | vesicle fusion | 70/8552 | 106/18723 | 1.82e-05 | 1.60e-04 | 70 |
| GO:00324565 | Esophagus | ESCC | endocytic recycling | 51/8552 | 73/18723 | 2.47e-05 | 2.10e-04 | 51 |
| Page: 1 2 3 4 5 |
| Pathway ID | Tissue | Disease Stage | Description | Gene Ratio | Bg Ratio | pvalue | p.adjust | qvalue | Count |
| hsa041305 | Esophagus | ESCC | SNARE interactions in vesicular transport | 28/4205 | 33/8465 | 2.75e-05 | 1.32e-04 | 6.75e-05 | 28 |
| hsa0413012 | Esophagus | ESCC | SNARE interactions in vesicular transport | 28/4205 | 33/8465 | 2.75e-05 | 1.32e-04 | 6.75e-05 | 28 |
| hsa041302 | Liver | HCC | SNARE interactions in vesicular transport | 25/4020 | 33/8465 | 8.78e-04 | 3.38e-03 | 1.88e-03 | 25 |
| hsa041303 | Liver | HCC | SNARE interactions in vesicular transport | 25/4020 | 33/8465 | 8.78e-04 | 3.38e-03 | 1.88e-03 | 25 |
| hsa041304 | Oral cavity | OSCC | SNARE interactions in vesicular transport | 28/3704 | 33/8465 | 1.31e-06 | 7.18e-06 | 3.66e-06 | 28 |
| hsa0413011 | Oral cavity | OSCC | SNARE interactions in vesicular transport | 28/3704 | 33/8465 | 1.31e-06 | 7.18e-06 | 3.66e-06 | 28 |
| hsa0413021 | Oral cavity | LP | SNARE interactions in vesicular transport | 22/2418 | 33/8465 | 6.00e-06 | 4.76e-05 | 3.07e-05 | 22 |
| hsa0413031 | Oral cavity | LP | SNARE interactions in vesicular transport | 22/2418 | 33/8465 | 6.00e-06 | 4.76e-05 | 3.07e-05 | 22 |
| Page: 1 |
Top |
Cell-cell communication analysis |
| Identification of potential cell-cell interactions between two cell types and their ligand-receptor pairs for different disease states |
| Ligand | Receptor | LRpair | Pathway | Tissue | Disease Stage |
| Page: 1 |
Top |
Single-cell gene regulatory network inference analysis |
| Find out the significant the regulons (TFs) and the target genes of each regulon across cell types for different disease states |
| TF | Cell Type | Tissue | Disease Stage | Target Gene | RSS | Regulon Activity |
| ∗The dot plots of a searched regulon are shown for all cell subpopulations in each disease state of each tissue based on the regulon specific score inferred using pySCENIC and by calculating the average expression. |
| Page: 1 |
Top |
Somatic mutation of malignant transformation related genes |
| Annotation of somatic variants for genes involved in malignant transformation |
| Hugo Symbol | Variant Class | Variant Classification | dbSNP RS | HGVSc | HGVSp | HGVSp Short | SWISSPROT | BIOTYPE | SIFT | PolyPhen | Tumor Sample Barcode | Tissue | Histology | Sex | Age | Stage | Therapy Types | Drugs | Outcome |
| STX6 | SNV | Missense_Mutation | novel | c.583G>A | p.Glu195Lys | p.E195K | O43752 | protein_coding | deleterious(0) | benign(0.3) | TCGA-AN-A046-01 | Breast | breast invasive carcinoma | Female | >=65 | I/II | Unknown | Unknown | SD |
| STX6 | SNV | Missense_Mutation | c.214G>A | p.Glu72Lys | p.E72K | O43752 | protein_coding | deleterious(0.01) | possibly_damaging(0.865) | TCGA-EW-A1PE-01 | Breast | breast invasive carcinoma | Female | <65 | I/II | Chemotherapy | fluorouracil | SD | |
| STX6 | insertion | Nonsense_Mutation | novel | c.456_457insATGTTCTTTTGTTCTTTACATTAGTATGTCTGCTTAACCAG | p.His153MetfsTer8 | p.H153Mfs*8 | O43752 | protein_coding | TCGA-A2-A0CX-01 | Breast | breast invasive carcinoma | Female | <65 | I/II | Chemotherapy | adriamycin | SD | ||
| STX6 | SNV | Missense_Mutation | c.204N>G | p.Ile68Met | p.I68M | O43752 | protein_coding | deleterious(0) | probably_damaging(0.989) | TCGA-C5-A1M5-01 | Cervix | cervical & endocervical cancer | Female | <65 | I/II | Unknown | Unknown | PD | |
| STX6 | SNV | Missense_Mutation | c.250G>A | p.Glu84Lys | p.E84K | O43752 | protein_coding | deleterious(0.01) | probably_damaging(0.993) | TCGA-A6-2686-01 | Colorectum | colon adenocarcinoma | Female | >=65 | I/II | Unknown | Unknown | SD | |
| STX6 | SNV | Missense_Mutation | rs776504795 | c.206G>A | p.Ser69Asn | p.S69N | O43752 | protein_coding | tolerated(0.7) | benign(0) | TCGA-A6-3807-01 | Colorectum | colon adenocarcinoma | Female | <65 | III/IV | Ancillary | leucovorin | SD |
| STX6 | SNV | Missense_Mutation | c.343G>A | p.Ala115Thr | p.A115T | O43752 | protein_coding | tolerated(0.59) | benign(0.001) | TCGA-AA-3977-01 | Colorectum | colon adenocarcinoma | Male | >=65 | I/II | Unknown | Unknown | SD | |
| STX6 | SNV | Missense_Mutation | novel | c.380N>A | p.Ser127Asn | p.S127N | O43752 | protein_coding | tolerated(0.15) | benign(0.009) | TCGA-A5-A2K5-01 | Endometrium | uterine corpus endometrioid carcinoma | Female | >=65 | I/II | Unknown | Unknown | SD |
| STX6 | SNV | Missense_Mutation | novel | c.112N>T | p.Ala38Ser | p.A38S | O43752 | protein_coding | tolerated(0.32) | benign(0.03) | TCGA-A5-A2K5-01 | Endometrium | uterine corpus endometrioid carcinoma | Female | >=65 | I/II | Unknown | Unknown | SD |
| STX6 | SNV | Missense_Mutation | c.448G>A | p.Ala150Thr | p.A150T | O43752 | protein_coding | tolerated(0.15) | benign(0.027) | TCGA-D1-A177-01 | Endometrium | uterine corpus endometrioid carcinoma | Female | >=65 | I/II | Unknown | Unknown | PD |
| Page: 1 2 3 |
Top |
Related drugs of malignant transformation related genes |
| Identification of chemicals and drugs interact with genes involved in malignant transfromation |
| (DGIdb 4.0) |
| Entrez ID | Symbol | Category | Interaction Types | Drug Claim Name | Drug Name | PMIDs |
| Page: 1 |

Copyright 2023-Present -The University of Texas Health Science Center at Houston |