
|
|||||
|
 | |
| |
| |
| |
| |
| |
|
Gene: SRRM3 |
Gene summary for SRRM3 |
| Gene information | Species | Human | Gene symbol | SRRM3 | Gene ID | 222183 |
| Gene name | serine/arginine repetitive matrix 3 | |
| Gene Alias | SRRM3 | |
| Cytomap | 7q11.23 | |
| Gene Type | protein-coding | GO ID | GO:0003674 | UniProtAcc | A0A087WXA3 |
Top |
Malignant transformation analysis |
| Identification of the aberrant gene expression in precancerous and cancerous lesions by comparing the gene expression of stem-like cells in diseased tissues with normal stem cells |
| Entrez ID | Symbol | Replicates | Species | Organ | Tissue | Adj P-value | Log2FC | Malignancy |
| 222183 | SRRM3 | P37T-E | Human | Esophagus | ESCC | 1.92e-04 | 1.09e-01 | 0.1371 |
| 222183 | SRRM3 | P39T-E | Human | Esophagus | ESCC | 4.34e-02 | 8.78e-02 | 0.0894 |
| 222183 | SRRM3 | P40T-E | Human | Esophagus | ESCC | 1.48e-02 | 1.22e-01 | 0.109 |
| 222183 | SRRM3 | P42T-E | Human | Esophagus | ESCC | 2.52e-03 | 9.04e-02 | 0.1175 |
| 222183 | SRRM3 | P47T-E | Human | Esophagus | ESCC | 2.02e-21 | 3.55e-01 | 0.1067 |
| 222183 | SRRM3 | P48T-E | Human | Esophagus | ESCC | 4.07e-13 | 2.18e-01 | 0.0959 |
| 222183 | SRRM3 | P49T-E | Human | Esophagus | ESCC | 3.47e-05 | 5.36e-01 | 0.1768 |
| 222183 | SRRM3 | P52T-E | Human | Esophagus | ESCC | 5.98e-09 | 2.56e-01 | 0.1555 |
| 222183 | SRRM3 | P54T-E | Human | Esophagus | ESCC | 3.09e-02 | 6.39e-02 | 0.0975 |
| 222183 | SRRM3 | P61T-E | Human | Esophagus | ESCC | 9.18e-10 | 2.23e-01 | 0.099 |
| 222183 | SRRM3 | P62T-E | Human | Esophagus | ESCC | 1.00e-24 | 4.58e-01 | 0.1302 |
| 222183 | SRRM3 | P74T-E | Human | Esophagus | ESCC | 9.86e-36 | 8.54e-01 | 0.1479 |
| 222183 | SRRM3 | P76T-E | Human | Esophagus | ESCC | 8.08e-05 | 1.65e-01 | 0.1207 |
| 222183 | SRRM3 | P79T-E | Human | Esophagus | ESCC | 1.61e-02 | 6.88e-02 | 0.1154 |
| 222183 | SRRM3 | P80T-E | Human | Esophagus | ESCC | 3.12e-33 | 8.33e-01 | 0.155 |
| 222183 | SRRM3 | P82T-E | Human | Esophagus | ESCC | 3.97e-03 | 1.58e-01 | 0.1072 |
| 222183 | SRRM3 | P83T-E | Human | Esophagus | ESCC | 6.15e-26 | 6.98e-01 | 0.1738 |
| 222183 | SRRM3 | P84T-E | Human | Esophagus | ESCC | 6.13e-05 | 3.23e-01 | 0.0933 |
| 222183 | SRRM3 | P89T-E | Human | Esophagus | ESCC | 3.38e-04 | 3.83e-01 | 0.1752 |
| 222183 | SRRM3 | P107T-E | Human | Esophagus | ESCC | 7.34e-14 | 2.41e-01 | 0.171 |
| Page: 1 2 3 |
| Tissue | Expression Dynamics | Abbreviation |
| Esophagus |  | ESCC: Esophageal squamous cell carcinoma |
| HGIN: High-grade intraepithelial neoplasias | ||
| LGIN: Low-grade intraepithelial neoplasias | ||
| Liver | 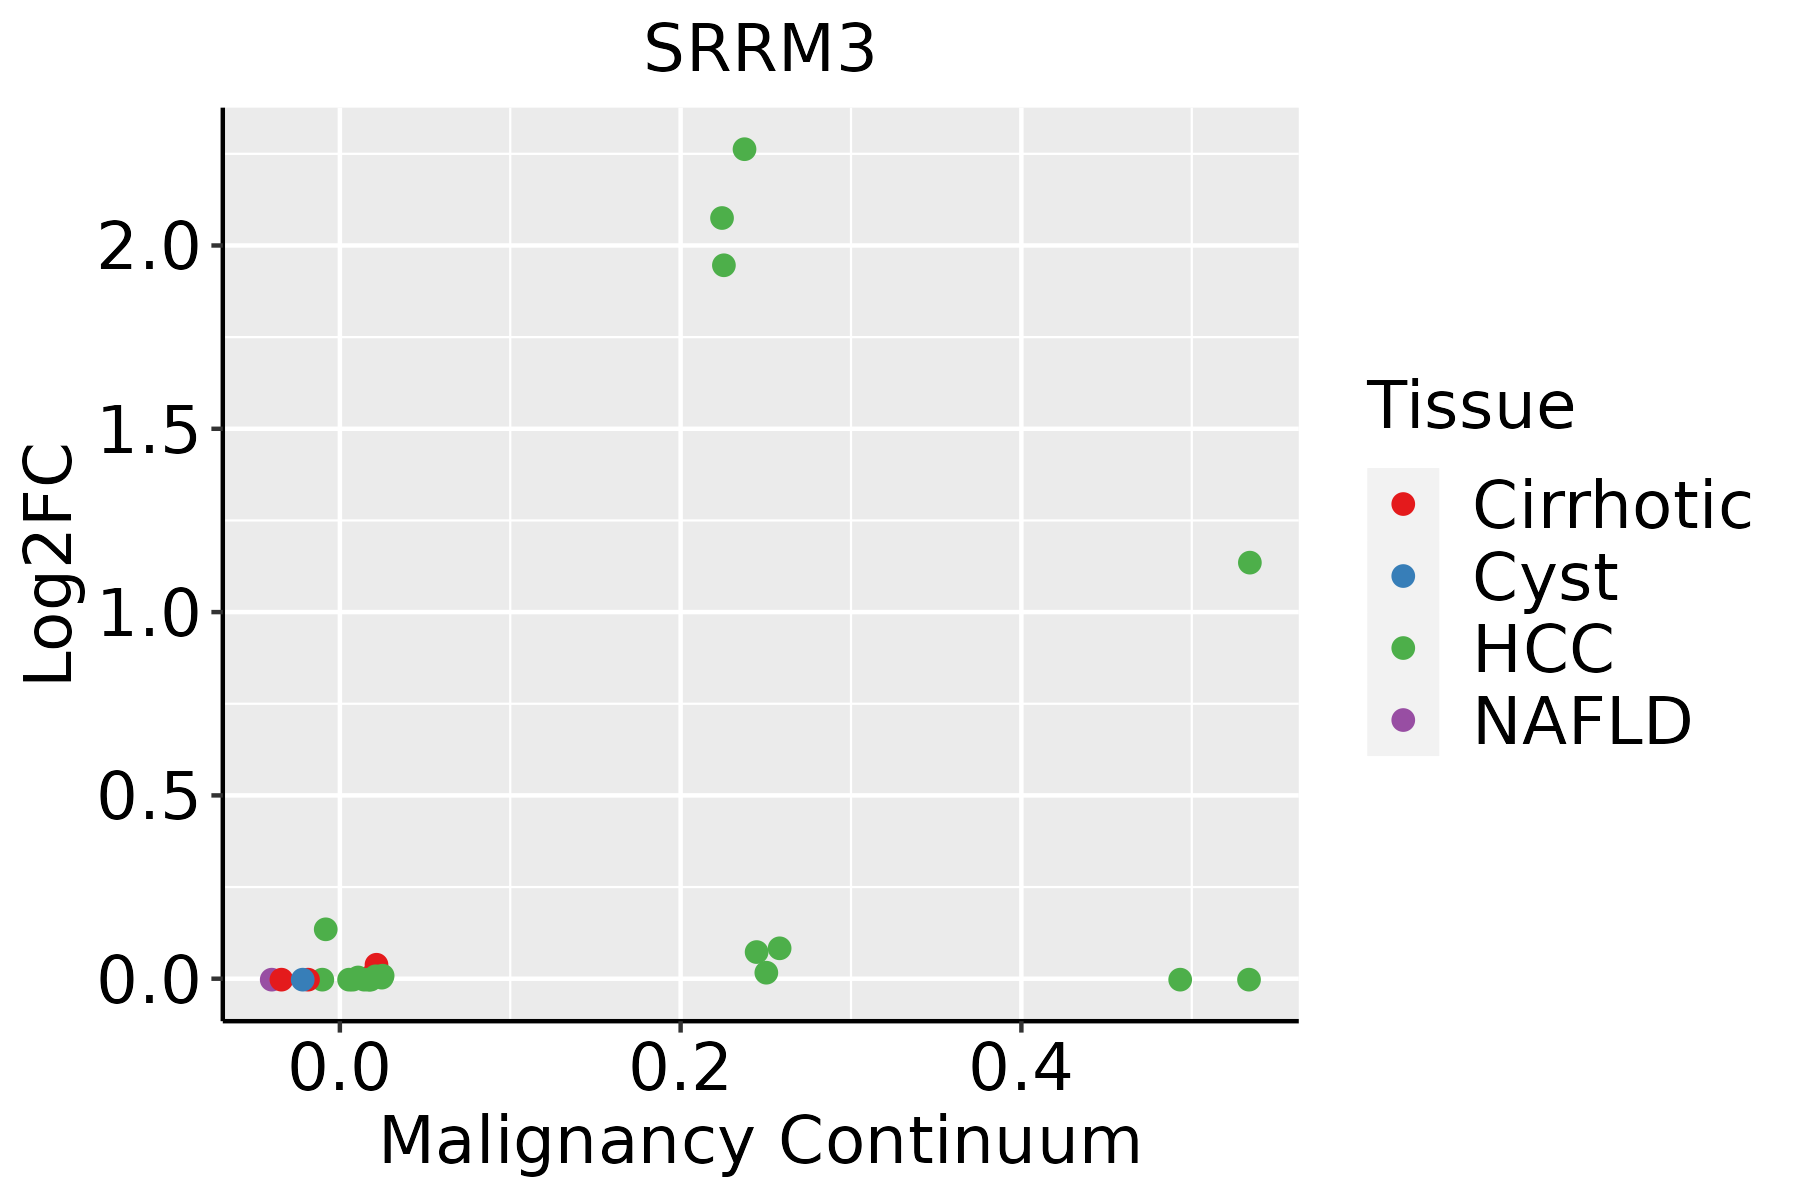 | HCC: Hepatocellular carcinoma |
| NAFLD: Non-alcoholic fatty liver disease |
| ∗log2FC in expression of this searched gene in stem-like cells from each diseased tissue sample relative to stem-like cells in normal samples in each tissue plotted against the malignancy continuum. Samples are colored based on if they are from different disease stage. |
Top |
Malignant transformation related pathway analysis |
| Find out the enriched GO biological processes and KEGG pathways involved in transition from healthy to precancer to cancer |
| Tissue | Disease Stage | Enriched GO biological Processes |
| Colorectum | AD |  |
| Colorectum | SER |  |
| Colorectum | MSS |  |
| Colorectum | MSI-H |  |
| Colorectum | FAP |  |
| ∗Top 15 enriched GO BP terms are showed in the bar plot of each disease state in each tissue. Each row represents a significant GO biological process which is colored according to the -log10(p.adjust). |
| Page: 1 2 3 4 5 6 7 8 9 |
| GO ID | Tissue | Disease Stage | Description | Gene Ratio | Bg Ratio | pvalue | p.adjust | Count |
| Page: 1 |
| Pathway ID | Tissue | Disease Stage | Description | Gene Ratio | Bg Ratio | pvalue | p.adjust | qvalue | Count |
| Page: 1 |
Top |
Cell-cell communication analysis |
| Identification of potential cell-cell interactions between two cell types and their ligand-receptor pairs for different disease states |
| Ligand | Receptor | LRpair | Pathway | Tissue | Disease Stage |
| Page: 1 |
Top |
Single-cell gene regulatory network inference analysis |
| Find out the significant the regulons (TFs) and the target genes of each regulon across cell types for different disease states |
| TF | Cell Type | Tissue | Disease Stage | Target Gene | RSS | Regulon Activity |
| ∗The dot plots of a searched regulon are shown for all cell subpopulations in each disease state of each tissue based on the regulon specific score inferred using pySCENIC and by calculating the average expression. |
| Page: 1 |
Top |
Somatic mutation of malignant transformation related genes |
| Annotation of somatic variants for genes involved in malignant transformation |
| Hugo Symbol | Variant Class | Variant Classification | dbSNP RS | HGVSc | HGVSp | HGVSp Short | SWISSPROT | BIOTYPE | SIFT | PolyPhen | Tumor Sample Barcode | Tissue | Histology | Sex | Age | Stage | Therapy Types | Drugs | Outcome |
| SRRM3 | SNV | Missense_Mutation | novel | c.890N>A | p.Ser297Asn | p.S297N | protein_coding | deleterious(0) | probably_damaging(0.969) | TCGA-EA-A1QT-01 | Cervix | cervical & endocervical cancer | Female | <65 | I/II | Unknown | Unknown | SD | |
| SRRM3 | SNV | Missense_Mutation | rs782810649 | c.629N>A | p.Arg210His | p.R210H | protein_coding | deleterious(0.02) | benign(0.015) | TCGA-AD-6963-01 | Colorectum | colon adenocarcinoma | Male | <65 | I/II | Unknown | Unknown | SD | |
| SRRM3 | SNV | Missense_Mutation | rs570515153 | c.1852G>A | p.Gly618Arg | p.G618R | protein_coding | tolerated_low_confidence(0.17) | benign(0.024) | TCGA-AZ-6601-01 | Colorectum | colon adenocarcinoma | Male | >=65 | I/II | Unknown | Unknown | PD | |
| SRRM3 | SNV | Missense_Mutation | rs782810649 | c.629N>A | p.Arg210His | p.R210H | protein_coding | deleterious(0.02) | benign(0.015) | TCGA-CM-4743-01 | Colorectum | colon adenocarcinoma | Male | >=65 | I/II | Chemotherapy | capecitabine | SD | |
| SRRM3 | SNV | Missense_Mutation | rs190294181 | c.1889N>A | p.Arg630Gln | p.R630Q | protein_coding | tolerated_low_confidence(0.05) | benign(0.015) | TCGA-F5-6864-01 | Colorectum | rectum adenocarcinoma | Female | >=65 | III/IV | Chemotherapy | 5-fluorouracil | CR | |
| SRRM3 | SNV | Missense_Mutation | novel | c.1862G>T | p.Ser621Ile | p.S621I | protein_coding | deleterious_low_confidence(0) | possibly_damaging(0.735) | TCGA-AJ-A3BH-01 | Endometrium | uterine corpus endometrioid carcinoma | Female | Unknown | I/II | Unknown | Unknown | SD | |
| SRRM3 | SNV | Missense_Mutation | novel | c.634G>T | p.Asp212Tyr | p.D212Y | protein_coding | deleterious(0) | probably_damaging(0.987) | TCGA-AX-A2HC-01 | Endometrium | uterine corpus endometrioid carcinoma | Female | <65 | III/IV | Chemotherapy | paclitaxel | PD | |
| SRRM3 | SNV | Missense_Mutation | novel | c.647N>A | p.Ser216Tyr | p.S216Y | protein_coding | deleterious(0) | probably_damaging(0.994) | TCGA-DF-A2KU-01 | Endometrium | uterine corpus endometrioid carcinoma | Female | Unknown | I/II | Unknown | Unknown | SD | |
| SRRM3 | SNV | Missense_Mutation | novel | c.1898N>A | p.Ser633Asn | p.S633N | protein_coding | deleterious_low_confidence(0.01) | probably_damaging(0.979) | TCGA-DI-A1BU-01 | Endometrium | uterine corpus endometrioid carcinoma | Female | <65 | I/II | Chemotherapy | paclitaxel | SD | |
| SRRM3 | SNV | Missense_Mutation | rs782033133 | c.1867N>T | p.Arg623Cys | p.R623C | protein_coding | deleterious_low_confidence(0) | probably_damaging(0.994) | TCGA-EO-A22R-01 | Endometrium | uterine corpus endometrioid carcinoma | Female | <65 | I/II | Unknown | Unknown | SD |
| Page: 1 2 3 |
Top |
Related drugs of malignant transformation related genes |
| Identification of chemicals and drugs interact with genes involved in malignant transfromation |
| (DGIdb 4.0) |
| Entrez ID | Symbol | Category | Interaction Types | Drug Claim Name | Drug Name | PMIDs |
| Page: 1 |

Copyright 2023-Present -The University of Texas Health Science Center at Houston |